 🔨 Auction
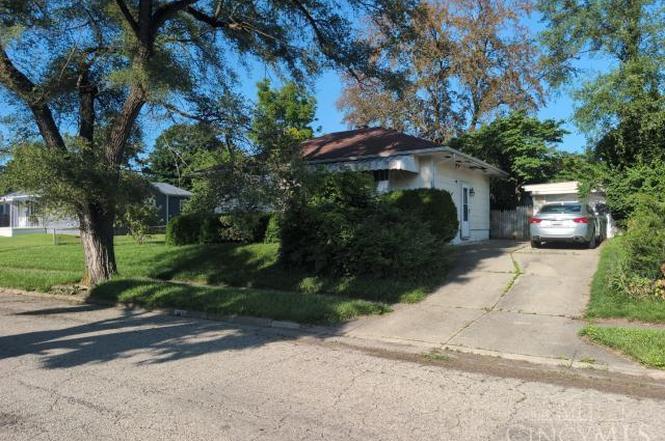
400 Murchison Ln · Riverside, OH
Flood risk 1/10 · Minimal
- FEMA flood zone
- X (unshaded)
- Chance of flooding over 30 yrs
- 0.0%
- Est. flood insurance / yr
- $473 – $860
Fire risk 1/10 · Minimal
- Est. fire insurance / yr
- $713 – $1,323
Heat risk 4/10 · Minor
- Hot days now (above 101°F)
- 7 days/yr
- Hot days in 30 yrs
- 18 days/yr
Wind risk 2/10 · Minimal
- Chance of severe wind over 30 yrs
- 1.0%
Air-quality risk 4/10 · Minor
- Unhealthy air days now
- 4 days/yr
- Unhealthy air days in 30 yrs
- 5 days/yr
Risk factors via First Street. Map © Google.
Why this score? — see what drove the F grade
The composite is a weighted blend of 9 inputs, each scored 0–100. Each bar is that input's sub-score; the figure is the points it added to the 100-point composite (weight × sub-score).
- Cash flow +7.6/30.0
- ARV discount +7.5/15.0
- Rent growth +3.9/5.0
- Schools +3.5/10.0
- Livability +3.2/5.0
- Condition / age +2.5/5.0
- 1% rule +2.2/10.0
- DSCR +1.7/10.0
- Appreciation +0.0/10.0
$1
🖨 Deal sheet (PDF) 📄 Offer letter ✓ Due diligence
Listing remarks
Court Ordered Sale by Private Selling Officer. Auction ends on June 25, 2026. All information we have on the property is included. We have no additional information, property condition is unknown. NO SHOWINGS, NO trespassing for any reason. Information is thought to be correct but not guaranteed. 10% Buyer Premium added to the high bid, $5,000 deposit is due within 24 hours of bidding end.
Key facts
- 7,841 sq ft lot
- Garage
- Built 1954
Property features AI
Finance
- Other: Auction listed
- HOA & community: No HOA
Exterior
- Parking: Detached 1-car garage
- Utilities: Public water; Public sewer; Natural gas; Other water heating
- Home design: Ranch single-family home; One level; Poured foundation
- Construction: Aluminum siding construction
- Exterior features: Aluminum siding; Aluminum windows; Shingle roof; Lot approximately 0.18 acres
Interior
- Kitchen: Kitchen approx. 10 x 10
- Bedrooms: Two bedrooms (both on main level); Primary bedroom approx. 10 x 10; Second bedroom approx. 10 x 10
- Bathrooms: One full bathroom on main level with shower
- Heating & cooling: Forced air heating; Central air conditioning
- Interior features: Full basement; Total of 4 rooms
Neighborhood map
What this means for you Summary
Snapshot
- This is a 2-bed/1.0-bath single-family listed at $1.
Deal economics
- At list price, monthly cash flow is $-194 ($-2k/yr) — negative.
- The deal already cash-flows at list — no discount required.
- Meets the 1% rule at list price ($1k rent vs $1).
Location & tenants
- Location reads 64/100 on livability (#775 in OH) — a middle-class / working-renter tenant base. Strengths: cost of living A+, housing A+; Watch: crime D+, employment D+, schools D.
- Mad River Local (suburban): math 34% / reading 50% proficiency, ranked #531 of 656 in OH (top 81%) — families likely to look elsewhere, expect single-tenant / working-renter base with shorter leases.
- Market conditions: Rents rising fast (+5.8%/yr); 124 active listings in the ZIP; 3 comparable units currently listed for rent nearby; rentals at typical pace (median 24d on market — plan ~3-4 weeks tenant-placement turnaround); solid renter incomes; 907 units permitted in Montgomery County in 2024 (416 in 5+ unit buildings).
- This rent is only 17% of the median local income ($83k/yr) — well below the 30% rent-burden line; pricing power to push rent on renewal without tenant pushback.
Forward outlook
- Local home prices are declining (-3.0%/yr); year-one equity from $1k of loan paydown is wiped out by about $5k of value loss. Plan a longer hold.
- Montgomery County population projected at -10% by 2050 — secular population decline; favor cash flow + early exit over multi-decade hold.
Negotiation context
- Only 1 days on market — expect competitive offers; lowballing is unlikely to land.
Risks & watch-outs
- Watch-outs: property tax is 239616.0% of price; built in 1954 — expect roof / HVAC / electrical / plumbing capex.
Questions for the listing agent
- What do current leases actually rent for vs. the listed asking? Can we see a recent rent roll and the last 12 months of T-12 income?
- Built in 1954 — when were the roof, HVAC, electrical panel, plumbing, and water heater last replaced?
- Property tax is high relative to price — has the assessment been appealed recently, and will the sale trigger a re-assessment?
- Is there a deadline driving the sale (1031 exchange, divorce, estate, relocation)? That informs how much negotiation room exists.
- Schools are D-rated, which usually means shorter tenancies and higher turnover. Who's the typical renter profile here, and what's been the actual vacancy rate?
- Crime grade is D in this area — have there been break-ins, vandalism, or insurance claims at this property in the last 3 years? What carrier currently insures it and at what premium?
- The area grade is low — what's the realistic commute time and amenity access for the typical tenant pool here? Any planned neighborhood developments (good or bad) we should know about?
- What's the average days-on-market for RENTAL listings here right now (not sales)? A rising rental-DOM trend means longer vacancies and softer asking-rent achievability than the comps imply.
- What's the recent tenant-quality profile in this submarket — average credit score on applications, eviction rate, late-payment / NSF rate, and stable-employment percentage? A property-management company in the area should have these aggregated.
- How much new for-sale + rental construction is in the pipeline within 1–3 miles? Heavy new supply typically softens prices + rents 12–24 months out; constrained supply supports both.
Investment metrics
- 1% rule
- 0.72% ✗
- Cap rate
- 4.84%
- Cash-on-cash
- -5.19%
- DSCR
- 0.77
- GRM
- 11.6
CMA / ARV
- ARV (on-the-fly)
- $159,744
- Comps found
- 8
Show comp detail 8 sales within ~0.75 mi
| Address | Dist | Beds/Ba | Sqft | Sold | Price | $/sf | Match |
|---|---|---|---|---|---|---|---|
| 372 Trunk Dr | 0.08mi | 2/1.0 | 768 (0%) | 8mo | $159,900 | $208 | 90 |
| 383 Travis Dr | 0.05mi | 2/1.0 | 768 (0%) | 15mo | $105,000 | $137 | 85 |
| 5833 Willaston Dr | 0.08mi | 2/1.0 | 768 (0%) | 15mo | $120,000 | $156 | 84 |
| 313 Willaston Dr | 0.26mi | 2/2.0 | 768 (0%) | 13mo | $186,000 | $242 | 73 |
| 5872 Hendon Ave | 0.25mi | 2/1.5 | 768 (0%) | 17mo | $175,000 | $228 | 72 |
| 345 Murchison Ln | 0.08mi | 2/1.0 | 864 (+12%) | 4mo | $95,000 | $110 | 72 |
| 5798 Hendon Ave | 0.23mi | 2/1.0 | 768 (0%) | 21mo | $89,900 | $117 | 72 |
| 358 Lawver Ln | 0.23mi | 3/2.0 (+1) | 864 (+12%) | 22mo | $205,000 | $237 | 41 |
Match score weights: distance 35% · size 25% · config 20% · recency 20%. Top-matched comps best support the ARV.
Projected returns pro-forma
-3.0% appreciation · 5.79% rent growth · sell at horizon
- IRR
- -22.1%
- Equity multiple
- 0.22×
- Total profit
- $-34,872
- Equity at exit
- $23,818
- IRR
- -10.4%
- Equity multiple
- 0.29×
- Total profit
- $-31,722
- Equity at exit
- $13,812
Cash invested: $44,728 (down + closing). Projections, not guarantees.
Landlord ↔ Tenant lean methodology
- Overall (STATE)
- 73 Landlord-Friendly
- State Ohio
- 73 Landlord-Friendly · R+6
- County
- — inherits STATE
- City
- — inherits STATE
ZIP-level market 45431
- Home prices YoY
- -35.0%
- Rents YoY
- 5.8%
- Active inventory
- 124
Monthly cashflow live
- Estimated rent
- $1,152 medium interval (Pro) →
- Mortgage (P&I)
- −$838
- Tax est. 1.5%
- −$200 /mo · $2,396/yr
- Insurance
- −$67
- HOA
- −$0
- Vacancy / Maint / Mgmt
- −$242
- Net cashflow
- $-194
Break-even live
Sensitivity live
| Price | -10% $-83 | -5% $-138 | +0% $-194 | +5% $-249 | +10% $-304 |
|---|---|---|---|---|---|
| Rent | -10% $-285 | -5% $-239 | +0% $-194 | +5% $-148 | +10% $-103 |
| Rate | -1.0pp $-113 | -0.5pp $-153 | base $-194 | +0.5pp $-235 | +1.0pp $-277 |
UW: 25.0% down · 7.5% · 30yr · 1.5% tax · 5.0% vac · 8.0% maint · 8.0% mgmt
Financing live
Cash to close
- Down payment
- $39,936
- Closing costs
- $4,792
- Reserves months
- —
- Total cash needed
- —
Loan-product check · same deal, 3 products live
Conventional
25% down · 7.5% · 30yr
- Down + closing
- —
- Monthly P&I
- —
- Monthly cashflow
- —
- DSCR
- —
- Eligible?
- —
Personal DTI + credit; lowest rate.
DSCR
20% down · 8.5% · 30yr
- Down + closing
- —
- Monthly P&I
- —
- Monthly cashflow
- —
- DSCR
- —
- Eligible?
- —
No personal income docs; deal must DSCR.
Hard money
10% down · 12.0% · 12mo
- Down + closing
- —
- Monthly P&I
- —
- Monthly cashflow
- —
- DSCR
- —
- Eligible?
- —
Short-term bridge; refi at stabilization.
Rent comps 3 comps
| Address | Beds | Baths | Sqft | Rent | $/sqft | DOM | Units | Dist |
|---|---|---|---|---|---|---|---|---|
| 1501 Rausch Ave Dayton, OH | 2.0 | 1.0 | 865 | $800 | $0.92 | 24d | 1 | 1.47mi |
| 1517 Rausch Ave Apt 4 Dayton, OH | 2.0 | 1.0 | 950 | $950 | $1.00 | 3d | 1 | 1.48mi |
| 1517 Rausch Ave Dayton, OH | 2.0 | 1.0 | 950 | $950 | $1.00 | 44d | 1 | 1.49mi |
Listing history 2 events
-
2026-06-16remarks 392-char remark
-
2026-06-16$1 Active 1 DOM
ⓘ Source: listings_history table (triggers on properties + properties_extension) + one-shot
backfill from property_details.listing_events for pre-trigger history.
Climate risk First Street
- Flood 1/10 Low FEMA zone X (unshaded) · 0% chance over 30 yrs
- Wildfire 1/10 Low
- Heat 4/10 Moderate 7 d/yr ≥101°F today · 18 d/yr by 30 yrs out
- Wind 2/10 Low 100% chance of damaging wind over 30 yrs
- Air quality 4/10 Moderate 4 unhealthy d/yr today · 5 by 30 yrs out
Nearby sold comps map
Loading sold comps map…
Walkable amenities ~0.75 mi
Loading nearby amenities…
Taxation est. · year 1
- Rental income
- $13,829
- − Mortgage interest
- −$8,948
- − Property taxes
- −$2,396
- − Insurance
- −$799
- − Repairs & maintenance
- −$1,106
- − Management
- −$1,106
- − Depreciation
- −$4,647
- Taxable loss
- −$5,174
- Est. tax savings @ 24.0%
- +$1,242
- After-tax cash flow
- $-1,081/yr
For passive investors: Depreciation is non-cash, so a rental often shows a tax loss while cash-flowing — sheltering income. Rental losses are passive: they offset passive income freely, and up to $25,000/yr can offset ordinary (W-2) income if you actively participate and your MAGI is under $100k (phasing out to $0 by $150k); unused losses carry forward. On sale, claimed depreciation is recaptured at up to 25%, and gains may owe capital-gains tax (a 1031 exchange can defer both). Figures are a year-1 estimate at your 24.0% rate — not tax advice; consult a CPA.
Schools (NCES district)
- District
- Mad River Local
- NCES district ID
- 3904870
- Math proficiency
- 34% ▼ -23.00%
- Reading proficiency
- 50% ▼ -8.00%
- Median HH income
- $41,560
- Composite
- 35.28/100
- National rank
- #4972
- State rank
- #531 of 656 in OH
Livability — Riverside
- Score
- 64/100
- State rank
- #775
- US rank
- #14045
Category grades
Schools grade is shown separately in the Schools card above.
Census & demographics
- Census place
- Riverside, OH
- County
- Greene County · 132,120 people
- Metro
- Dayton-Kettering, OH
- Population (ZIP)
- 27,951
- Household income
- $83,175
- Rent vs Own
- Severe rent burden
- 622.0
Population outlook (Montgomery County) Hauer SSP2
- Today (2025)
- 523,241 people
- By 2030
- 514,948 · -1.6%
- By 2040
- 493,378 · -5.7%
- By 2050
- 469,639 · -10.2%
- By 2075
- 418,360 · -20.0%
- By 2100
- 353,315 · -32.5%
Race, ethnicity, and origin ACS 2023
- Neighborhood character
- Predominantly White (78%)
- Race & ethnicity
- White 78% Two or more races 8% Hispanic / Latino 6% Asian 5% Black 4%
- Hispanic origin (detail)
- Mexican 1% Puerto Rican 2%
- Common ancestry
- Italian 3% Slovak 2% Lithuanian 2%
- Foreign-born
- 6% · South Korea, Canada, Jamaica
- Languages at home
- 92% English-only · Spanish 3% Other Indo-European 2% Korean 1%
Political lean MEDSL · Montgomery
- 2024 margin
- Toss-up / Even · D 49.8% · R 49.3%
- 2008→2024 swing
- -5.8pp toward R · 2008: 6.2pp · 2024: 0.5pp
- All cycles
- 2024: D+0.5 2020: D+2.2 2016: R+1.2 2012: D+3.1 2008: D+6.2
Not yet ingested
- Civics
- —
Market trends
- HPI YoY
- ▼ -148.58%
- Current HPI
- 276.444
- Rent YoY
- ▲ 5.79%
- Metro
- Dayton-Kettering, OH
- State GDP YoY
- ▲ 1.98%
- F500 in state
- 48
Industry mix (Fortune 500 HQ in OH)
| Industry | F500 HQs | Revenue |
|---|---|---|
| Insurance | 3 | $145B |
|
||
| Industrial Machinery | 3 | $49B |
|
||
| Financial Services | 3 | $24B |
|
||
| Consumer Goods | 2 | $93B |
|
||
| Aerospace / Defense | 2 | $47B |
|
||
| Utilities | 2 | $33B |
|
||
Price history
+46.4% since first listed3 events — show timeline
- 2026-06-16 Listed $1 Cincy MLS
- 1987-07-15 Sold (Public Records) $41,000 Public Records
- 1982-09-01 Sold (Public Records) $28,000 Public Records
Property tax history
+0.5%/yrLatest (2025): $1,945 · +7.8% YoY. Source: county tax records.
Cash-flow waterfall
monthlySold comps — $/sqft
last 12 mo · ≤1 miLoading sold comps…