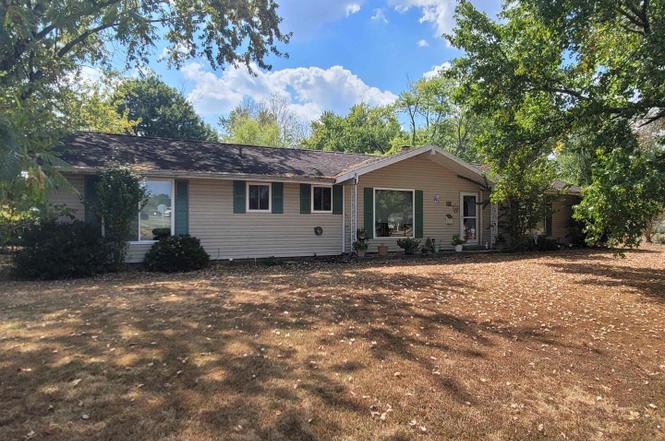
1133 W Boone St · Salem, IL
Flood risk 1/10 · Minimal
- FEMA flood zone
- X (unshaded)
- Chance of flooding over 30 yrs
- 0.0%
- Est. flood insurance / yr
- $473 – $860
Fire risk 1/10 · Minimal
- Est. fire insurance / yr
- $804 – $1,492
Heat risk 4/10 · Minor
- Hot days now (above 106°F)
- 7 days/yr
- Hot days in 30 yrs
- 20 days/yr
Wind risk 2/10 · Minimal
- Chance of severe wind over 30 yrs
- 2.0%
Air-quality risk 2/10 · Minimal
- Unhealthy air days now
- 1 days/yr
- Unhealthy air days in 30 yrs
- 2 days/yr
Risk factors via First Street. Map © Google.
Why this score? — see what drove the B- grade
The composite is a weighted blend of 9 inputs, each scored 0–100. Each bar is that input's sub-score; the figure is the points it added to the 100-point composite (weight × sub-score).
- Cash flow +26.7/30.0
- ARV discount +15.0/15.0
- DSCR +9.2/10.0
- 1% rule +6.4/10.0
- Livability +3.4/5.0
- Schools +2.6/10.0
- Rent growth +2.5/5.0
- Condition / age +2.5/5.0
- Appreciation +0.0/10.0
$107,500
🖨 Deal sheet 📄 Offer letter ✓ Due diligence
Listing remarks
Ranch style home on large corner lot. Furnace AND the AC both new in 2024 Also in 2024 added new doors and sliding windows including the larger ones in living room adding natural and the extra large "escape style" sliding window in master bedroom. Oversized 2 car garage with storage and pull down attic. Ceiling fans in every room. Patio located in the fenced back yard. Wide drive for extra parking. Solar lease transfer shall be in place with new owner prior to close. Being sold AS IS
Key facts
- Sliding windows
- New doors
- Fenced back yard
Tags
Property features AI
Finance
- Other: Living area per assessor; Total living area reported as 1,330
- Financial info: Special service area included in tax bill
Exterior
- Parking: Attached garage (2 cars); Two total parking spaces
- Utilities: Public water; Public sewer; 100 amp electric service
- Home design: Detached single-family home; One-story layout; Fee simple ownership; Not rebuilt; Built before 1978
- Construction: Vinyl siding over frame construction; Block foundation; Approximately 51–60 years old
- Exterior features: Corner lot; Lot dimensions approximately 137 x 110
Interior
- Kitchen: Dishwasher; Range; Refrigerator
- Bedrooms: Three bedrooms (all on main level); Master bedroom on main level
- Flooring: Carpet in bedrooms and living room; Laminate flooring in kitchen
- Bathrooms: Two full bathrooms; Master bathroom included
- Heating & cooling: Forced-air heating (natural gas); Solar-assisted heating; Central air conditioning
- Interior features: Egress window in basement
- Laundry & utility: Washer; Dryer
Neighborhood map
What this means for you Summary
Snapshot
- This is a 3-bed/2.0-bath single-family listed at $108k.
Deal economics
- At list price, monthly cash flow is $292 ($4k/yr) — positive.
- The deal already cash-flows at list — no discount required.
- Meets the 1% rule at list price ($1k rent vs $108k).
- Recommended offer: $95k (12.0% below list) — sets the bar for market timing.
- Cap rate 9.6% vs local median 5.6% in Salem — top-decile yield for the area; either an underpriced asset or a hidden risk that comps aren't pricing in. Stress-test before assuming the spread holds.
Location & tenants
- Location reads 68/100 on livability (#467 in IL) — a middle-class / working-renter tenant base. Strengths: cost of living A+, housing A+, health & safety A+; Watch: schools D, amenities F, commute F.
- Salem Chsd 600 (town): math 25% / reading 30% proficiency, ranked #571 of 919 in IL (top 62%) — low school quality limits family demand, transient renter base, plan for 1-2y turnover.
- Market conditions: 48 active listings in the ZIP; 2 units permitted in Marion County in 2024 (0 in 5+ unit buildings).
Forward outlook
- Local home prices are declining (-3.0%/yr); year-one equity from $743 of loan paydown is wiped out by about $3k of value loss. Plan a longer hold.
- Marion County population projected at -20% by 2050 — secular population decline; favor cash flow + early exit over multi-decade hold.
- At projected returns (-3.0% appreciation + 3.0% rent growth), your $30k cash investment doubles in ~10 years — after that, you're playing with house money.
Negotiation context
- It's been on market 180 days — a 12% lower offer ($95k) is reasonable based on typical stale-listing flexibility.
- 6 sale attempts since 21y ago with the ask held roughly flat each time — persistent listings suggest the price (not the market) is what's stuck; bring a comps-based counter.
- Current owner paid $77k; 40% above their basis — modest negotiation headroom, anchor on the comps not their cost.
Questions for the listing agent
- It's been on market 180 days. Have you received any prior offers? Is the seller open to a 12% concession, seller financing, or rate buy-down credit?
- Built in 1967 — when were the roof, HVAC, electrical panel, plumbing, and water heater last replaced?
- Why hasn't it sold? Are there any deal-killer items the seller is aware of (foundation, flood, title, zoning, code violations)?
- Is there a deadline driving the sale (1031 exchange, divorce, estate, relocation)? That informs how much negotiation room exists.
- Schools are D-rated, which usually means shorter tenancies and higher turnover. Who's the typical renter profile here, and what's been the actual vacancy rate?
- What's the average days-on-market for RENTAL listings here right now (not sales)? A rising rental-DOM trend means longer vacancies and softer asking-rent achievability than the comps imply.
- What's the recent tenant-quality profile in this submarket — average credit score on applications, eviction rate, late-payment / NSF rate, and stable-employment percentage? A property-management company in the area should have these aggregated.
- How much new for-sale + rental construction is in the pipeline within 1–3 miles? Heavy new supply typically softens prices + rents 12–24 months out; constrained supply supports both.
Investment metrics
- 1% rule
- 1.14% ✓
- Cap rate
- 9.56%
- Cash-on-cash
- 11.66%
- DSCR
- 1.52
- GRM
- 7.3
CMA / ARV
- ARV (on-the-fly)
- $148,960
- Comps found
- 12
Show comp detail 12 sales within ~0.75 mi
| Address | Dist | Beds/Ba | Sqft | Sold | Price | $/sf | Match |
|---|---|---|---|---|---|---|---|
| 1409 Rig | 0.12mi | 3/1.0 | 1,326 (-0%) | 9mo | $135,000 | $102 | 83 |
| 1108 Hawthorn Rd Rd | 0.08mi | 3/2.0 | 1,434 (+8%) | 6mo | $160,500 | $112 | 78 |
| 1022 W Boone St | 0.14mi | 2/1.0 (-1) | 1,408 (+6%) | 2mo | $65,000 | $46 | 73 |
| 437 Prairie View Dr | 0.48mi | 3/2.0 | 1,384 (+4%) | 7mo | $174,000 | $126 | 65 |
| 1201 N Franklin St | 0.47mi | 3/2.0 | 1,255 (-6%) | 5mo | $160,000 | $127 | 64 |
| 509 W Warmouth St | 0.54mi | 3/2.0 | 1,300 (-2%) | 12mo | $190,000 | $146 | 61 |
| 326 N Indiana St | 0.41mi | 4/1.0 (+1) | 1,297 (-2%) | 9mo | $145,000 | $112 | 60 |
| 505 Schroeder Dr | 0.49mi | 3/2.0 | 1,448 (+9%) | 4mo | $175,000 | $121 | 59 |
| 732 W Lovell St | 0.45mi | 3/1.5 | 1,419 (+7%) | 11mo | $140,000 | $99 | 56 |
| 727 N Broadway Ave | 0.72mi | 3/1.0 | 1,375 (+3%) | 2mo | $84,800 | $62 | 56 |
| 441 N Ohio Ave | 0.34mi | 2/1.0 (-1) | 1,184 (-11%) | 6mo | $126,000 | $106 | 51 |
| 1110 N Franklin St | 0.48mi | 3/1.5 | 1,521 (+14%) | 2mo | $182,500 | $120 | 50 |
Match score weights: distance 35% · size 25% · config 20% · recency 20%. Top-matched comps best support the ARV.
Projected returns pro-forma
-3.0% appreciation · 3.0% rent growth · sell at horizon
- IRR
- 1.0%
- Equity multiple
- 1.04×
- Total profit
- $1,184
- Equity at exit
- $16,029
- IRR
- 10.6%
- Equity multiple
- 1.83×
- Total profit
- $24,926
- Equity at exit
- $9,295
Cash invested: $30,100 (down + closing). Projections, not guarantees.
Landlord ↔ Tenant lean methodology
- Overall (STATE)
- 43 Moderately Tenant-Leaning
- State Illinois
- 43 Moderately Tenant-Leaning · D+7
- County
- — inherits STATE
- City
- — inherits STATE
ZIP-level market 62881
- Home prices YoY
- -28.0%
- Active inventory
- 48
- Price-to-rent
- 7.3×
Monthly cashflow live
- Estimated rent
- $1,228 medium interval (Pro) →
- Mortgage (P&I)
- −$564
- Tax from tax record
- −$69 /mo · $828/yr
- Insurance
- −$45
- HOA
- −$0
- Vacancy / Maint / Mgmt
- −$258
- Net cashflow
- $292
Break-even live
UW: 25.0% down · 7.5% · 30yr · 1.5% tax · 5.0% vac · 8.0% maint · 8.0% mgmt
Financing live
Cash to close
- Down payment
- $26,875
- Closing costs
- $3,225
- Reserves months
- —
- Total cash needed
- —
Loan-product check · same deal, 3 products live
Conventional
25% down · 7.5% · 30yr
- Down + closing
- —
- Monthly P&I
- —
- Monthly cashflow
- —
- DSCR
- —
- Eligible?
- —
Personal DTI + credit; lowest rate.
DSCR
20% down · 8.5% · 30yr
- Down + closing
- —
- Monthly P&I
- —
- Monthly cashflow
- —
- DSCR
- —
- Eligible?
- —
No personal income docs; deal must DSCR.
Hard money
10% down · 12.0% · 12mo
- Down + closing
- —
- Monthly P&I
- —
- Monthly cashflow
- —
- DSCR
- —
- Eligible?
- —
Short-term bridge; refi at stabilization.
Listing history 40 events
-
2026-06-18days on market $107,500 Active 180 DOM
-
2026-06-17days on market $107,500 Active 179 DOM
-
2026-06-16days on market $107,500 Active 178 DOM
-
2026-06-15days on market $107,500 Active 177 DOM
-
2026-06-13days on market $107,500 Active 175 DOM
-
2026-06-12days on market $107,500 Active 174 DOM
-
2026-06-09days on market $107,500 Active 171 DOM
-
2026-06-08days on market $107,500 Active 170 DOM
-
2026-06-07days on market $107,500 Active 169 DOM
-
2026-06-07days on market $107,500 Active 168 DOM
-
2026-06-04days on market $107,500 Active 165 DOM
-
2026-06-02days on market $107,500 Active 164 DOM
-
2026-06-01days on market $107,500 Active 163 DOM
-
2026-05-31days on market $107,500 Active 162 DOM
-
2026-05-31days on market $107,500 Active 161 DOM
-
2026-05-23historical
-
2026-05-21$107,500 Active
-
2026-01-13price
-
2026-01-08status Active
-
2026-01-06historical
-
2026-01-05historical
-
2025-12-16price
-
2025-11-04price
-
2025-09-15Active
-
2021-08-06historical
-
2021-08-06historical
-
2021-08-06historical
-
2021-08-06historical
-
2021-08-06historical
-
2014-12-02historical
-
2014-01-17soldstatus $77,000
-
2014-01-17soldstatus $77,000
-
2013-11-02$77,000
-
2013-11-02$77,000
-
2010-11-26historical
-
2009-06-05historical
-
2005-10-14soldstatus $73,000
-
2005-07-13$76,000
-
2005-05-28historical
-
2004-11-15historical
ⓘ Source: listings_history table (triggers on properties + properties_extension) + one-shot
backfill from property_details.listing_events for pre-trigger history.
Tax reassessment forecast IL · Partial reset (capped growth)
- Current annual tax
- $828 · $69/mo
- Projected year-2 tax
- $1,634 · $136/mo
- Expected delta
- +$806/yr (+$67/mo · 97.4%)
ⓘ Screening estimate from a state-policy table — verify with the county assessor before closing.
Climate risk First Street
- Flood 1/10 Low FEMA zone X (unshaded) · 0% chance over 30 yrs
- Wildfire 1/10 Low
- Heat 4/10 Moderate 7 d/yr ≥106°F today · 20 d/yr by 30 yrs out
- Wind 2/10 Low 2% chance of damaging wind over 30 yrs
- Air quality 2/10 Low 1 unhealthy d/yr today · 2 by 30 yrs out
Nearby sold comps map
Loading sold comps map…
Walkable amenities ~0.75 mi
Loading nearby amenities…
Taxation est. · year 1
- Rental income
- $14,733
- − Mortgage interest
- −$6,022
- − Property taxes
- −$828
- − Insurance
- −$538
- − Repairs & maintenance
- −$1,179
- − Management
- −$1,179
- − Depreciation
- −$3,127
- Taxable income
- $1,862
- Est. tax owed @ 24.0%
- −$447
- After-tax cash flow
- $3,062/yr
For passive investors: Depreciation is non-cash, so a rental often shows a tax loss while cash-flowing — sheltering income. Rental losses are passive: they offset passive income freely, and up to $25,000/yr can offset ordinary (W-2) income if you actively participate and your MAGI is under $100k (phasing out to $0 by $150k); unused losses carry forward. On sale, claimed depreciation is recaptured at up to 25%, and gains may owe capital-gains tax (a 1031 exchange can defer both). Figures are a year-1 estimate at your 24.0% rate — not tax advice; consult a CPA.
Schools (NCES district)
- District
- Salem Chsd 600
- NCES district ID
- 1735190
- Math proficiency
- 25% ▲ 10.00%
- Reading proficiency
- 30% ▲ 5.00%
- Median HH income
- $39,305
- Composite
- 26.04/100
- National rank
- #12738
- State rank
- #571 of 919 in IL
Livability — Salem
- Score
- 68/100
- State rank
- #467
- US rank
- #9634
Category grades
Schools grade is shown separately in the Schools card above.
Census & demographics
- Census place
- Salem, IL
- City population
- 11,218
- Population (ZIP)
- 11,218
Population outlook (Marion County) Hauer SSP2
- Today (2025)
- 36,071 people
- By 2030
- 34,598 · -4.1%
- By 2040
- 31,754 · -12.0%
- By 2050
- 28,912 · -19.8%
- By 2075
- 22,527 · -37.5%
- By 2100
- 16,455 · -54.4%
Race, ethnicity, and origin ACS 2023
- Neighborhood character
- Predominantly White (93%)
- Race & ethnicity
- White 93% Black 3% Two or more races 2%
- Common ancestry
- Romanian 2% Italian 2% Iranian 2%
- Foreign-born
- 1%
- Languages at home
- 99% English-only · Spanish 1%
Political lean MEDSL · Marion
- 2024 margin
- Solid R (+49.5) · D 24.6% · R 74.1% · Other 1.4%
- 2008→2024 swing
- -47.5pp toward R · 2008: -2.0pp · 2024: -49.5pp
- All cycles
- 2024: R+49.5 2020: R+46.6 2016: R+44.9 2012: R+19.2 2008: R+2.0
Not yet ingested
- Civics
- —
Market trends
- HPI YoY
- ▼ -63.16%
- Current HPI
- 162.55
- Rent YoY
- —
- Metro
- —
- State GDP YoY
- ▲ 1.59%
- F500 in state
- 60
Industry mix (Fortune 500 HQ in IL)
| Industry | F500 HQs | Revenue |
|---|---|---|
| Insurance | 4 | $201B |
|
||
| Consumer Goods | 4 | $87B |
|
||
| Industrial Machinery | 3 | $64B |
|
||
| Healthcare | 2 | $55B |
|
||
| Retail / Pharmacy | 1 | $148B |
|
||
| Agriculture / Food | 1 | $86B |
|
||
Price history
+41.4% since first listed25 events — show timeline
- 2026-05-23 Listing Removed — MRED as Distributed by MLS Grid
- 2026-05-21 Listed $107,500 MARIS as Distributed by MLS Grid
- 2026-01-13 Price Changed — MRED as Distributed by MLS Grid
- 2026-01-08 Relisted — MRED as Distributed by MLS Grid
- 2026-01-06 Listing Removed — RMLSA as Distributed by MLS Grid
- 2026-01-05 Listing Removed — MRED as Distributed by MLS Grid
- 2025-12-16 Price Changed — RMLSA as Distributed by MLS Grid
- 2025-11-04 Price Changed — RMLSA as Distributed by MLS Grid
- 2025-09-15 Listed — RMLSA as Distributed by MLS Grid
- 2021-08-06 Listing Removed — RMLSA as Distributed by MLS Grid
- 2021-08-06 Listing Removed — RMLSA as Distributed by MLS Grid
- 2021-08-06 Listing Removed — RMLSA as Distributed by MLS Grid
- 2021-08-06 Listing Removed — RMLSA as Distributed by MLS Grid
- 2021-08-06 Listing Removed — RMLSA as Distributed by MLS Grid
- 2014-12-02 Listing Removed — MRED as Distributed by MLS Grid
- 2014-01-17 Sold (MLS) $77,000 MRED as Distributed by MLS Grid
- 2014-01-17 Sold (MLS) $77,000 RMLSA as Distributed by MLS Grid
- 2013-11-02 Listed $77,000 MRED as Distributed by MLS Grid
- 2013-11-02 Listed $77,000 RMLSA as Distributed by MLS Grid
- 2010-11-26 Listing Removed — MRED as Distributed by MLS Grid
- 2009-06-05 Listing Removed — MRED as Distributed by MLS Grid
- 2005-10-14 Sold (MLS) $73,000 RMLSA as Distributed by MLS Grid
- 2005-07-13 Listed $76,000 RMLSA as Distributed by MLS Grid
- 2005-05-28 Listing Removed — MRED as Distributed by MLS Grid
- 2004-11-15 Listing Removed — MRED as Distributed by MLS Grid
Property tax history
-5.2%/yrLatest (2024): $828 · -6.9% YoY. Source: county tax records.
Cash-flow waterfall
monthlySold comps — $/sqft
last 12 mo · ≤1 miLoading sold comps…