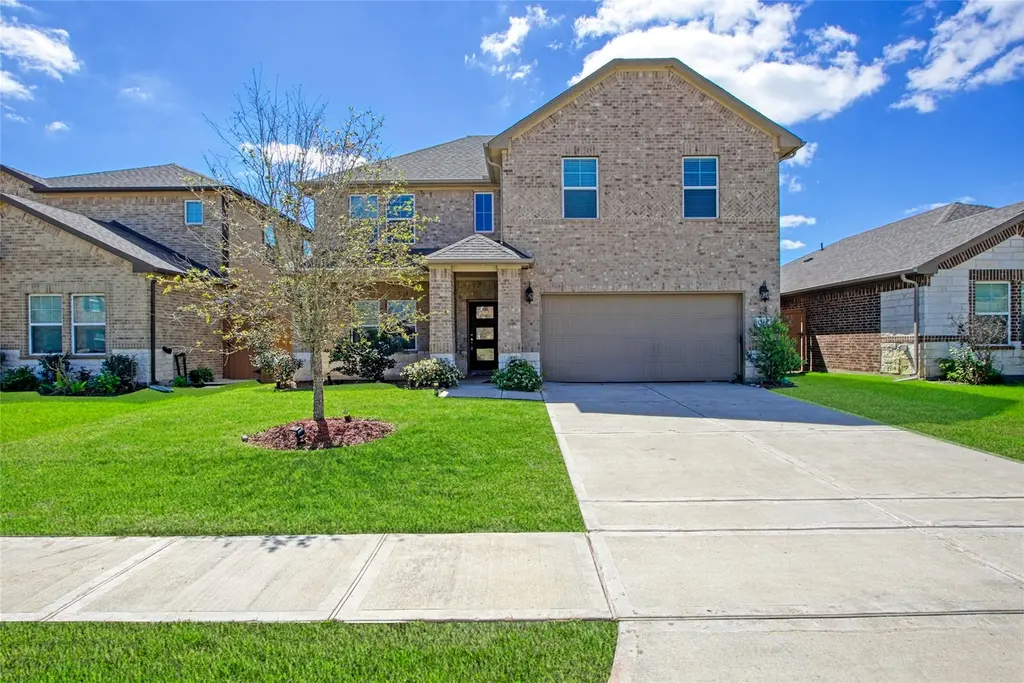
1334 Eagle Pass Dr · Iowa Colony, TX
Flood risk 4/10 · Minor
- FEMA flood zone
- X (unshaded)
- Chance of flooding over 30 yrs
- 0.2%
- Est. flood insurance / yr
- $507 – $1,088
Fire risk 4/10 · Minor
- Est. fire insurance / yr
- $1,222 – $2,270
Heat risk 9/10 · Severe
- Hot days now (above 110°F)
- 7 days/yr
- Hot days in 30 yrs
- 23 days/yr
Wind risk 9/10 · Severe
- Chance of severe wind over 30 yrs
- 99.0%
Air-quality risk 2/10 · Minimal
- Unhealthy air days now
- 1 days/yr
- Unhealthy air days in 30 yrs
- 2 days/yr
Risk factors via First Street. Map © Google.
Why this score? — see what drove the D grade
The composite is a weighted blend of 9 inputs, each scored 0–100. Each bar is that input's sub-score; the figure is the points it added to the 100-point composite (weight × sub-score).
- ARV discount +15.0/15.0
- Cash flow +7.2/30.0
- 1% rule +5.2/10.0
- Condition / age +4.0/5.0
- Schools +3.9/10.0
- Livability +3.2/5.0
- Rent growth +2.6/5.0
- DSCR +1.3/10.0
- Appreciation +0.0/10.0
$299,000
🖨 Deal sheet (PDF) 📄 Offer letter ✓ Due diligence
Listing remarks MLS
Welcome to 1334 Eagle Pass Drive in Rosharon. A beautifully built 2022 home designed for modern living and entertaining. This spacious property features 4 bedrooms, 3 full bathrooms, a private office, a game room, and a dedicated media room, offering plenty of flexibility for families and guests alike. The open-concept layout highlights a stunning kitchen with a large island that flows seamlessly into the living room perfect for gatherings and everyday comfort. Priced to sell, this home is a fantastic opportunity to own a move-in-ready property with all the space and features you’ve been looking for.
Key facts
- Private office
- Large island
- Game room
Tags
Neighborhood map
What this means for you Summary
Snapshot
- This is a 4-bed/3.5-bath single-family listed at $299k. Condition is rated good.
Deal economics
- At list price, monthly cash flow is $-418 ($-5k/yr) — negative.
- To cash-flow at today's rent, offer at most $246k (17.6% below list).
- Meets the 1% rule at list price ($3k rent vs $299k).
- Recommended offer: $246k (17.6% below list) — sets the bar for cash-flow.
Location & tenants
- Location reads 64/100 on livability (#757 in TX) — a middle-class / working-renter tenant base. Strengths: crime A+, employment A+, cost of living A+; Watch: schools F, amenities F, commute F.
- Alvin ISD (suburban): math 39% / reading 48% proficiency, ranked #255 of 826 in TX (top 31%) — families likely to look elsewhere, expect single-tenant / working-renter base with shorter leases.
- Market conditions: Rents flat; 1148 active listings in the ZIP; 12 comparable units currently listed for rent nearby; rentals lingering (median 46d on market — plan ~5-8 weeks vacancy on turnover, expect pricing pressure); 50% of comp listings sitting > 30 days — soft ceiling on asking rent; high-income renter base; 3,960 units permitted in Brazoria County in 2024 (593 in 5+ unit buildings).
- This rent runs 31% of the median local income ($119k/yr) — at the standard rent-burdened threshold; future hikes will face affordability resistance.
Forward outlook
- Local home prices are declining (-3.0%/yr); year-one equity from $2k of loan paydown is wiped out by about $9k of value loss. Plan a longer hold.
- Brazoria County population projected at +44% by 2050 — long-run rental-demand tailwind backs the buy-and-hold thesis.
Negotiation context
- It's been on market 69 days — a 6% lower offer ($281k) is reasonable based on typical stale-listing flexibility.
- 3 sale attempts since 4y ago with the ask held roughly flat each time — persistent listings suggest the price (not the market) is what's stuck; bring a comps-based counter.
Risks & watch-outs
- Watch-outs: property tax is 4.1% of price.
- Climate carrying-cost: severe wind risk, 99% chance of damaging wind over 30y; extreme-heat days projected 7→23/yr by 2055 (HVAC capex compounding) — expect insurance premiums to compound above CPI over the hold.
Questions for the listing agent
- What do current leases actually rent for vs. the listed asking? Can we see a recent rent roll and the last 12 months of T-12 income?
- It's been on market 69 days. Have you received any prior offers? Is the seller open to a 18% concession, seller financing, or rate buy-down credit?
- Property tax is high relative to price — has the assessment been appealed recently, and will the sale trigger a re-assessment?
- What does the HOA fee cover, when was the last increase, and are there any pending special assessments or reserve-fund shortfalls?
- Why hasn't it sold? Are there any deal-killer items the seller is aware of (foundation, flood, title, zoning, code violations)?
- Is there a deadline driving the sale (1031 exchange, divorce, estate, relocation)? That informs how much negotiation room exists.
- Schools are F-rated, which usually means shorter tenancies and higher turnover. Who's the typical renter profile here, and what's been the actual vacancy rate?
- The area grade is low — what's the realistic commute time and amenity access for the typical tenant pool here? Any planned neighborhood developments (good or bad) we should know about?
- What's the average days-on-market for RENTAL listings here right now (not sales)? A rising rental-DOM trend means longer vacancies and softer asking-rent achievability than the comps imply.
- What's the recent tenant-quality profile in this submarket — average credit score on applications, eviction rate, late-payment / NSF rate, and stable-employment percentage? A property-management company in the area should have these aggregated.
- How much new for-sale + rental construction is in the pipeline within 1–3 miles? Heavy new supply typically softens prices + rents 12–24 months out; constrained supply supports both.
Investment metrics
- 1% rule
- 1.02% ✓
- Cap rate
- 4.61%
- Cash-on-cash
- -6.00%
- DSCR
- 0.73
- GRM
- 8.2
CMA / ARV
- ARV (median comp)
- $376,948
- List price
- $299,000
- Delta
- -20.68%
- Verdict
- UNDERPRICED
- Comps
- 20 within 1.0 mi
Show comp detail 12 sales within ~0.75 mi
| Address | Dist | Beds/Ba | Sqft | Sold | Price | $/sf | Match |
|---|---|---|---|---|---|---|---|
| 1314 Eagle Pass Dr | 0.05mi | 4/3.5 | 2,604 (-1%) | 0mo | $339,900 | $131 | 97 |
| 10831 Bodie Hills Dr | 0.15mi | 4/3.5 | 2,598 (-1%) | 0mo | $378,000 | $145 | 91 |
| 4322 Eagle Pass Dr | 0.04mi | 4/3.5 | 2,894 (+10%) | 4mo | $414,990 | $143 | 78 |
| 10610 Kings River Dr | 0.36mi | 4/3.0 | 2,504 (-4%) | 6mo | $315,000 | $126 | 69 |
| 10507 Sutter Creek Dr | 0.66mi | 4/3.0 | 2,566 (-2%) | 2mo | $489,900 | $191 | 62 |
| 1702 Homewood Point Ln | 0.53mi | 3/3.5 (-1) | 2,718 (+4%) | 4mo | $429,000 | $158 | 61 |
| 1906 Temple Grove Dr | 0.64mi | 4/3.5 | 2,468 (-6%) | 3mo | $386,550 | $157 | 58 |
| 10902 Amador Peak Dr | 0.51mi | 5/3.5 (+1) | 2,841 (+8%) | 4mo | $465,780 | $164 | 54 |
| 1225 Scarlet Mountain Dr | 0.69mi | 4/2.5 | 2,468 (-6%) | 3mo | $290,000 | $118 | 52 |
| 10910 Amador Peak Dr | 0.54mi | 4/2.5 | 2,372 (-10%) | 5mo | $354,990 | $150 | 51 |
| 1843 Temple Grove Dr | 0.62mi | 4/2.5 | 2,372 (-10%) | 6mo | $349,195 | $147 | 47 |
| 1722 Darwin Cedar Dr | 0.71mi | 4/2.5 | 2,974 (+14%) | 4mo | $399,000 | $134 | 37 |
Match score weights: distance 35% · size 25% · config 20% · recency 20%. Top-matched comps best support the ARV.
Projected returns pro-forma
-3.0% appreciation · 0.44% rent growth · sell at horizon
- IRR
- -30.6%
- Equity multiple
- 0.02×
- Total profit
- $-82,233
- Equity at exit
- $44,582
- IRR
- -58.5%
- Equity multiple
- -0.60×
- Total profit
- $-133,651
- Equity at exit
- $25,852
Cash invested: $83,720 (down + closing). Projections, not guarantees.
Landlord ↔ Tenant lean methodology
- Overall (STATE)
- 87 Strongly Landlord-Friendly
- State Texas
- 87 Strongly Landlord-Friendly · R+5
- County
- — inherits STATE
- City
- — inherits STATE
ZIP-level market 77583
- Rents YoY
- 0.4%
- Active inventory
- 1148
- Price-to-rent
- 8.2×
Monthly cashflow live
- Estimated rent
- $3,044 high interval (Pro) →
- Mortgage (P&I)
- −$1,568
- Tax from tax record
- −$1,027 /mo · $12,324/yr
- Insurance
- −$125
- HOA
- −$104
- Vacancy / Maint / Mgmt
- −$639
- Net cashflow
- $-418
Break-even live
Sensitivity live
| Price | -10% $-249 | -5% $-334 | +0% $-418 | +5% $-503 | +10% $-588 |
|---|---|---|---|---|---|
| Rent | -10% $-659 | -5% $-539 | +0% $-418 | +5% $-298 | +10% $-178 |
| Rate | -1.0pp $-268 | -0.5pp $-342 | base $-418 | +0.5pp $-496 | +1.0pp $-575 |
UW: 25.0% down · 7.5% · 30yr · 1.5% tax · 5.0% vac · 8.0% maint · 8.0% mgmt
Financing live
Cash to close
- Down payment
- $74,750
- Closing costs
- $8,970
- Reserves months
- —
- Total cash needed
- —
Loan-product check · same deal, 3 products live
Conventional
25% down · 7.5% · 30yr
- Down + closing
- —
- Monthly P&I
- —
- Monthly cashflow
- —
- DSCR
- —
- Eligible?
- —
Personal DTI + credit; lowest rate.
DSCR
20% down · 8.5% · 30yr
- Down + closing
- —
- Monthly P&I
- —
- Monthly cashflow
- —
- DSCR
- —
- Eligible?
- —
No personal income docs; deal must DSCR.
Hard money
10% down · 12.0% · 12mo
- Down + closing
- —
- Monthly P&I
- —
- Monthly cashflow
- —
- DSCR
- —
- Eligible?
- —
Short-term bridge; refi at stabilization.
Rent comps 12 comps
| Address | Beds | Baths | Sqft | Rent | $/sqft | DOM | Units | Dist |
|---|---|---|---|---|---|---|---|---|
| 1403 Cascade Hills Dr Rosharon, TX | 4.0 | 3.0 | 2067 | $3,450 | $1.67 | 9d | 1 | 0.17mi |
| 10714 Cliffs View Dr Iowa Colony, TX | 4.0 | 3.5 | 2070 | $2,700 | $1.30 | 45d | 1 | 0.27mi |
| 10630 Cascade Creek Dr Rosharon, TX | 3.0 | 2.5 | 1940 | $2,875 | $1.48 | 4d | 1 | 0.32mi |
| 10622 Cascade Creek Dr Rosharon, TX | 4.0 | 2.0 | 1780 | $2,775 | $1.56 | 45d | 1 | 0.35mi |
| 10313 Malta Trace Dr Rosharon, TX | 4.0 | 2.0 | 1802 | $2,545 | $1.41 | 45d | 1 | 0.82mi |
| 1816 Corsica Creek Ln Rosharon, TX | 3.0–4.0 | 2.0–2.5 | 1653 | $2,669 | $1.61 | 0d | 20 | 0.89mi |
| 10211 Alpine Lake Ln Rosharon, TX | 3.0–4.0 | 2.0–2.5 | 1731 | $2,875 | $1.66 | 45d | 7 | 1.22mi |
| 10211 Alpine Lake Ln Rosharon, TX | 3.0–4.0 | 2.0–2.5 | 1731 | $3,025 | $1.75 | 0d | 6 | 1.22mi |
| 2314 Red Slate Dr Rosharon, TX | 4.0 | 4.0 | 2531 | $2,850 | $1.13 | 45d | 1 | 1.29mi |
| 9423 Grand Spark Dr Rosharon, TX | 3.0 | 3.0 | 1999 | $2,600 | $1.30 | 45d | 1 | 1.39mi |
| 9439 Ruby Mist Dr Rosharon, TX | 5.0 | 2.5 | 2605 | $2,276 | $0.87 | 0d | 1 | 1.42mi |
| 1123 Diamond Drape Dr Rosharon, TX | 4.0 | 2.0 | 1844 | $2,000 | $1.08 | 14d | 1 | 1.43mi |
HOA detail
- Monthly dues
- $104 · $1,248/yr
Listing history 27 events
-
2026-03-18$299,000 Active 613-char remark
Show marketing remark (613 chars)
Welcome to 1334 Eagle Pass Drive in Rosharon. A beautifully built 2022 home designed for modern living and entertaining. This spacious property features 4 bedrooms, 3 full bathrooms, a private office, a game room, and a dedicated media room, offering plenty of flexibility for families and guests alike. The open-concept layout highlights a stunning kitchen with a large island that flows seamlessly into the living room perfect for gatherings and everyday comfort. Priced to sell, this home is a fantastic opportunity to own a move-in-ready property with all the space and features you’ve been looking for.
-
2026-02-24historical
-
2025-07-03price $348,999
-
2025-05-05price $369,900
-
2025-05-01price $450,000
-
2025-02-24$478,999 Active
-
2023-07-06soldstatus Sold
-
2023-05-11status Pending
-
2023-05-02price $395,140
-
2023-04-21price $392,140
-
2023-03-17price $392,740
-
2023-02-24price $416,740
-
2023-02-22price $418,215
-
2023-02-21price $403,215
-
2023-02-18price $418,215
-
2023-02-08price $433,215
-
2023-02-01price $418,215
-
2023-01-27price $416,215
-
2023-01-04price $431,215
-
2022-11-18price $429,215
-
2022-11-02price $426,215
-
2022-10-21price $424,215
-
2022-10-05price $421,215
-
2022-09-22price $439,215
-
2022-09-02price $449,215
-
2022-08-18price $450,130
-
2022-07-18$455,130 Active
ⓘ Source: listings_history table (triggers on properties + properties_extension) + one-shot
backfill from property_details.listing_events for pre-trigger history.
Tax reassessment forecast TX · Resets to sale price
- Current annual tax
- $12,324 · $1,027/mo
- Projected year-2 tax
- $12,324 · $1,027/mo
- Expected delta
- $0/yr ($0/mo · 0.0%)
ⓘ Screening estimate from a state-policy table — verify with the county assessor before closing.
Climate risk First Street
- Flood 4/10 Moderate FEMA zone X (unshaded) · 20% chance over 30 yrs
- Wildfire 4/10 Moderate
- Heat 9/10 Extreme 7 d/yr ≥110°F today · 23 d/yr by 30 yrs out
- Wind 9/10 Extreme 99% chance of damaging wind over 30 yrs
- Air quality 2/10 Low 1 unhealthy d/yr today · 2 by 30 yrs out
Nearby sold comps map
Loading sold comps map…
Walkable amenities ~0.75 mi
Loading nearby amenities…
Taxation est. · year 1
- Rental income
- $36,534
- − Mortgage interest
- −$16,749
- − Property taxes
- −$12,324
- − Insurance
- −$1,495
- − Repairs & maintenance
- −$2,923
- − Management
- −$2,923
- − HOA
- −$1,248
- − Depreciation
- −$8,698
- Taxable loss
- −$9,825
- Est. tax savings @ 24.0%
- +$2,358
- After-tax cash flow
- $-2,663/yr
For passive investors: Depreciation is non-cash, so a rental often shows a tax loss while cash-flowing — sheltering income. Rental losses are passive: they offset passive income freely, and up to $25,000/yr can offset ordinary (W-2) income if you actively participate and your MAGI is under $100k (phasing out to $0 by $150k); unused losses carry forward. On sale, claimed depreciation is recaptured at up to 25%, and gains may owe capital-gains tax (a 1031 exchange can defer both). Figures are a year-1 estimate at your 24.0% rate — not tax advice; consult a CPA.
Condition & rehab AI · 6 photos
This move-in-ready home features a modern kitchen, well-maintained bathrooms, and a clean exterior. It offers a good investment opportunity with potential for further value enhancement through minor updates.
Value-add opportunities
- Both Painting the exterior and interior walls — Fresh paint can enhance curb appeal and interior aesthetics.
- Both Landscaping improvements — Enhanced landscaping can improve curb appeal and attract more potential buyers/tenants.
- Both Updating light fixtures — Modern light fixtures can improve the home's curb appeal and interior aesthetics.
- Both Adding smart home features — Smart home features can increase the home's value and attract tech-savvy buyers/tenants.
- Both Upgrading appliances — Upgrading to newer, more energy-efficient appliances can increase the home's value and attract more buyers/tenants.
Renovation cost estimate screening
Value-add ROI direction
- Both Painting the exterior and interior walls — Fresh paint can enhance curb appeal and interior aesthetics. ↑
- Both Landscaping improvements — Enhanced landscaping can improve curb appeal and attract more potential buyers/tenants. ↑
- Both Updating light fixtures — Modern light fixtures can improve the home's curb appeal and interior aesthetics. ↑
- Both Adding smart home features — Smart home features can increase the home's value and attract tech-savvy buyers/tenants. ↑
- Both Upgrading appliances — Upgrading to newer, more energy-efficient appliances can increase the home's value and attract more buyers/tenants. ↑
ⓘ Cost ranges are severity-bucket heuristics (US national rule-of-thumb). Get contractor quotes + a written scope before underwriting a rehab budget.
Schools (NCES district)
- District
- Alvin ISD
- NCES district ID
- 4808090
- Math proficiency
- 39% ▼ -11.00%
- Reading proficiency
- 48% ▬ 0.00%
- Median HH income
- $66,740
- Composite
- 38.96/100
- National rank
- #4080
- State rank
- #255 of 826 in TX
Livability — Iowa Colony
- Score
- 64/100
- State rank
- #757
- US rank
- #13904
Category grades
Schools grade is shown separately in the Schools card above.
Census & demographics
- County
- Brazoria County · 374,982 people
- City population
- 52,747
- Metro
- Houston-The Woodlands-Sugar Land, TX
- Population (ZIP)
- 52,747
- Household income
- $119,287
- Rent vs Own
- Severe rent burden
- 251.0
Population outlook (Brazoria County) Hauer SSP2
- Today (2025)
- 420,414 people
- By 2030
- 457,585 · +8.8%
- By 2040
- 532,232 · +26.6%
- By 2050
- 605,399 · +44.0%
- By 2075
- 779,358 · +85.4%
- By 2100
- 883,759 · +110.2%
Race, ethnicity, and origin ACS 2023
- Neighborhood character
- Highly diverse neighborhood (Simpson 0.70)
- Race & ethnicity
- Hispanic / Latino 38% Black 34% White 20% Two or more races 18% Asian 5%
- Hispanic origin (detail)
- Mexican 31% Puerto Rican 2%
- Common ancestry
- Lithuanian 1% Slovak 1% Romanian 1%
- Foreign-born
- 16% · Canada, Vietnam, China
- Languages at home
- 64% English-only · Spanish 28% Other Asian/Pacific 2% Vietnamese 1%
Political lean MEDSL · Brazoria
- 2024 margin
- R (+19.7) · D 39.5% · R 59.2% · Other 1.3%
- 2008→2024 swing
- +9.9pp toward D · 2008: -29.6pp · 2024: -19.7pp
- All cycles
- 2024: R+19.7 2020: R+18.2 2016: R+24.6 2012: R+34.2 2008: R+29.6
Not yet ingested
- Civics
- —
Market trends
- HPI YoY
- ▼ -120.19%
- Current HPI
- 198.6559
- Rent YoY
- ▲ 0.44%
- Metro
- Houston-The Woodlands-Sugar Land, TX
- State GDP YoY
- ▲ 3.95%
- F500 in state
- 110
Industry mix (Fortune 500 HQ in TX)
| Industry | F500 HQs | Revenue |
|---|---|---|
| Energy | 16 | $1,198B |
|
||
| Technology | 5 | $198B |
|
||
| Engineering / Construction | 4 | $72B |
|
||
| Energy Services | 3 | $60B |
|
||
| Utilities | 3 | $41B |
|
||
| Healthcare | 2 | $330B |
|
||
Price history
-34.3% since first listed27 events — show timeline
- 2026-03-18 Listed $299,000 HARMLS
- 2026-02-24 Listing Removed — HARMLS
- 2025-07-03 Price Changed $348,999 HARMLS
- 2025-05-05 Price Changed $369,900 HARMLS
- 2025-05-01 Price Changed $450,000 HARMLS
- 2025-02-24 Listed $478,999 HARMLS
- 2023-07-06 Sold (MLS) — HARMLS
- 2023-05-11 Pending — HARMLS
- 2023-05-02 Price Changed $395,140 HARMLS
- 2023-04-21 Price Changed $392,140 HARMLS
- 2023-03-17 Price Changed $392,740 HARMLS
- 2023-02-24 Price Changed $416,740 HARMLS
- 2023-02-22 Price Changed $418,215 HARMLS
- 2023-02-21 Price Changed $403,215 HARMLS
- 2023-02-18 Price Changed $418,215 HARMLS
- 2023-02-08 Price Changed $433,215 HARMLS
- 2023-02-01 Price Changed $418,215 HARMLS
- 2023-01-27 Price Changed $416,215 HARMLS
- 2023-01-04 Price Changed $431,215 HARMLS
- 2022-11-18 Price Changed $429,215 HARMLS
- 2022-11-02 Price Changed $426,215 HARMLS
- 2022-10-21 Price Changed $424,215 HARMLS
- 2022-10-05 Price Changed $421,215 HARMLS
- 2022-09-22 Price Changed $439,215 HARMLS
- 2022-09-02 Price Changed $449,215 HARMLS
- 2022-08-18 Price Changed $450,130 HARMLS
- 2022-07-18 Listed $455,130 HARMLS
Property tax history
+132.6%/yrLatest (2025): $12,324 · +2.2% YoY. Source: county tax records.
Cash-flow waterfall
monthlySold comps — $/sqft
last 12 mo · ≤1 miLoading sold comps…