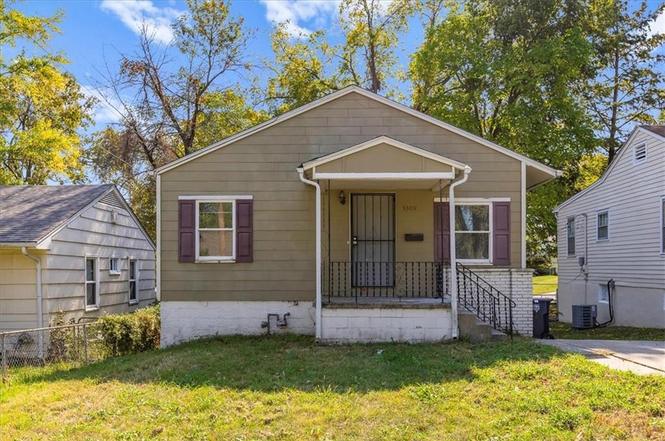
3309 E 73rd St · Kansas City, MO
Flood risk 1/10 · Minimal
- FEMA flood zone
- X (unshaded)
- Chance of flooding over 30 yrs
- 0.0%
- Est. flood insurance / yr
- $473 – $860
Fire risk 1/10 · Minimal
- Est. fire insurance / yr
- $1,054 – $1,958
Heat risk 4/10 · Minor
- Hot days now (above 106°F)
- 7 days/yr
- Hot days in 30 yrs
- 17 days/yr
Wind risk 2/10 · Minimal
- Chance of severe wind over 30 yrs
- —
Air-quality risk 3/10 · Minor
- Unhealthy air days now
- 3 days/yr
- Unhealthy air days in 30 yrs
- 5 days/yr
Risk factors via First Street. Map © Google.
Why this score? — see what drove the A- grade
The composite is a weighted blend of 9 inputs, each scored 0–100. Each bar is that input's sub-score; the figure is the points it added to the 100-point composite (weight × sub-score).
- Cash flow +30.0/30.0
- ARV discount +13.0/15.0
- DSCR +10.0/10.0
- Appreciation +10.0/10.0
- 1% rule +9.0/10.0
- Livability +3.9/5.0
- Rent growth +3.2/5.0
- Condition / age +2.5/5.0
- Schools +1.5/10.0
$79,000
🖨 Deal sheet (PDF) 📄 Offer letter ✓ Due diligence
Listing remarks MLS
Lots of Potential at this Bungalow. Selling As Is-No Seller’s Disclosure-Inspection(s) for buyer knowledge. Earnest Money Deposit is the greater of $1K or 2% of Selling Price, certified funds payable to title company-NO EXCEPTIONS!
Key facts
- Vinyl windows
- Unfinished basement
- Off-street parking
Tags
Property features AI
Finance
- HOA & community: No association fees
Exterior
- Parking: Off-street parking
- Utilities: Public water; Public sewer
- Home design: Single family residence; Bungalow/Ranch style; One story (bungalow/ranch entry)
- Construction: Frame construction; Composition roof; Built over 100 years ago
- Exterior features: City lot; Not in a flood plain
Interior
- Bedrooms: 2 bedrooms
- Bathrooms: 1 full bathroom
- Heating & cooling: Natural gas heating; Electric cooling
- Interior features: Living and dining combined
- Laundry & utility: Laundry in basement
Neighborhood map
What this means for you Summary
Snapshot
- This is a 2-bed/1.0-bath single-family listed at $79k.
Deal economics
- At list price, monthly cash flow is $405 ($5k/yr) — positive.
- The deal already cash-flows at list — no discount required.
- Meets the 1% rule at list price ($1k rent vs $79k).
- Recommended offer: $72k (9.0% below list) — sets the bar for market timing.
- Cap rate 12.4% vs local median 3.9% in Kansas City — top-decile yield for the area; either an underpriced asset or a hidden risk that comps aren't pricing in. Stress-test before assuming the spread holds.
Location & tenants
- Location reads 78/100 on livability (#28 in MO, #2,671 nationally) — a middle-class / working-renter tenant base. Strengths: amenities A+, commute A+, cost of living A+; Watch: schools C-, crime F.
- Kansas City 33 (urban): math 12% / reading 24% proficiency, ranked #308 of 324 in MO (top 95%) — low school quality limits family demand, transient renter base, plan for 1-2y turnover; 75% free/reduced lunch — lower-income household profile, screen leases tightly.
- Market conditions: Rents rising (+3.0%/yr); 93 active listings in the ZIP; 3 comparable units currently listed for rent nearby; rentals leasing fast (median 13d on market — plan ~1-2 weeks tenant-placement turnaround); 4,002 units permitted in Jackson County in 2024 (2,271 in 5+ unit buildings).
Forward outlook
- In year one you build about $8k of equity ($546 loan paydown + $8k appreciation (10.0% local appreciation)).
- Jackson County population projected at +4% by 2050 — modest demand growth; plan on rents tracking national, not racing it.
- At projected returns (10.0% appreciation + 3.0% rent growth), your $22k cash investment doubles in ~2 years — after that, you're playing with house money.
- By year 5, paydown + projected appreciation supports a ~$39k cash-out refi (75% LTV) — recoverable capital for the next deal without selling this one.
Negotiation context
- It's been on market 98 days — a 9% lower offer ($72k) is reasonable based on typical stale-listing flexibility.
- 5 sale attempts since 24y ago with the ask held roughly flat each time — persistent listings suggest the price (not the market) is what's stuck; bring a comps-based counter.
- Current owner paid $35k; list at $79k implies a 126% gain — meaningful room to come down on a strong offer.
Risks & watch-outs
- Watch-outs: built in 1924 — expect roof / HVAC / electrical / plumbing capex.
Questions for the listing agent
- It's been on market 98 days. Have you received any prior offers? Is the seller open to a 9% concession, seller financing, or rate buy-down credit?
- Built in 1924 — when were the roof, HVAC, electrical panel, plumbing, and water heater last replaced?
- Why hasn't it sold? Are there any deal-killer items the seller is aware of (foundation, flood, title, zoning, code violations)?
- Is there a deadline driving the sale (1031 exchange, divorce, estate, relocation)? That informs how much negotiation room exists.
- Crime grade is F in this area — have there been break-ins, vandalism, or insurance claims at this property in the last 3 years? What carrier currently insures it and at what premium?
- What's the average days-on-market for RENTAL listings here right now (not sales)? A rising rental-DOM trend means longer vacancies and softer asking-rent achievability than the comps imply.
- What's the recent tenant-quality profile in this submarket — average credit score on applications, eviction rate, late-payment / NSF rate, and stable-employment percentage? A property-management company in the area should have these aggregated.
- How much new for-sale + rental construction is in the pipeline within 1–3 miles? Heavy new supply typically softens prices + rents 12–24 months out; constrained supply supports both.
Investment metrics
- 1% rule
- 1.40% ✓
- Cap rate
- 12.45%
- Cash-on-cash
- 21.99%
- DSCR
- 1.98
- GRM
- 6.0
CMA / ARV
- ARV (on-the-fly)
- $90,048
- Comps found
- 12
Show comp detail 12 sales within ~0.75 mi
| Address | Dist | Beds/Ba | Sqft | Sold | Price | $/sf | Match |
|---|---|---|---|---|---|---|---|
| 3309 E 73rd St | 0.00mi | 2/1.0 | 672 (0%) | 1mo | $79,000 | $118 | 100 |
| 3315 E 73rd St | 0.01mi | 2/1.0 | 767 (+14%) | 10mo | $105,000 | $137 | 68 |
| 7403 Montgall Ave | 0.41mi | 2/1.0 | 614 (-9%) | 7mo | $85,000 | $138 | 61 |
| 3014 E 69 St | 0.56mi | 2/1.0 | 696 (+4%) | 14mo | $80,000 | $115 | 56 |
| 6920 Agnes St | 0.52mi | 3/1.0 (+1) | 691 (+3%) | 13mo | $90,000 | $130 | 55 |
| 7430 Chestnut Ave | 0.40mi | 2/1.0 | 596 (-11%) | 12mo | $69,500 | $117 | 52 |
| 7024 Bales Ave | 0.37mi | 2/1.0 | 740 (+10%) | 22mo | $99,000 | $134 | 48 |
| 6810 Monroe Ave | 0.64mi | 2/1.0 | 758 (+13%) | 8mo | $70,000 | $92 | 42 |
| 7212 Park Ave | 0.68mi | 2/1.0 | 762 (+13%) | 8mo | $169,900 | $223 | 39 |
| 6733 Askew Ave | 0.70mi | 2/1.0 | 731 (+9%) | 18mo | $75,000 | $103 | 38 |
| 3816 E 68th St | 0.73mi | 2/1.0 | 631 (-6%) | 23mo | $95,000 | $151 | 37 |
| 2209 E 72nd St | 0.70mi | 3/1.0 (+1) | 771 (+15%) | 9mo | $120,000 | $156 | 30 |
Match score weights: distance 35% · size 25% · config 20% · recency 20%. Top-matched comps best support the ARV.
Projected returns pro-forma
10.0% appreciation · 2.98% rent growth · sell at horizon
- IRR
- 40.7%
- Equity multiple
- 4.11×
- Total profit
- $68,783
- Equity at exit
- $71,169
- IRR
- 35.1%
- Equity multiple
- 9.23×
- Total profit
- $182,147
- Equity at exit
- $153,480
Cash invested: $22,120 (down + closing). Projections, not guarantees.
Landlord ↔ Tenant lean methodology
- Overall (STATE)
- 81 Strongly Landlord-Friendly
- State Missouri
- 81 Strongly Landlord-Friendly · R+10
- County
- — inherits STATE
- City
- — inherits STATE
ZIP-level market 64132
- Home prices YoY
- 23.6%
- Rents YoY
- 3.0%
- Active inventory
- 93
- Price-to-rent
- 6.0×
Monthly cashflow live
- Estimated rent
- $1,104 medium interval (Pro) →
- Mortgage (P&I)
- −$414
- Tax from tax record
- −$19 /mo · $232/yr
- Insurance
- −$33
- HOA
- −$0
- Vacancy / Maint / Mgmt
- −$232
- Net cashflow
- $405
Break-even live
Sensitivity live
| Price | -10% $450 | -5% $428 | +0% $405 | +5% $383 | +10% $361 |
|---|---|---|---|---|---|
| Rent | -10% $318 | -5% $362 | +0% $405 | +5% $449 | +10% $492 |
| Rate | -1.0pp $445 | -0.5pp $425 | base $405 | +0.5pp $385 | +1.0pp $364 |
UW: 25.0% down · 7.5% · 30yr · 1.5% tax · 5.0% vac · 8.0% maint · 8.0% mgmt
Financing live
Cash to close
- Down payment
- $19,750
- Closing costs
- $2,370
- Reserves months
- —
- Total cash needed
- —
Loan-product check · same deal, 3 products live
Conventional
25% down · 7.5% · 30yr
- Down + closing
- —
- Monthly P&I
- —
- Monthly cashflow
- —
- DSCR
- —
- Eligible?
- —
Personal DTI + credit; lowest rate.
DSCR
20% down · 8.5% · 30yr
- Down + closing
- —
- Monthly P&I
- —
- Monthly cashflow
- —
- DSCR
- —
- Eligible?
- —
No personal income docs; deal must DSCR.
Hard money
10% down · 12.0% · 12mo
- Down + closing
- —
- Monthly P&I
- —
- Monthly cashflow
- —
- DSCR
- —
- Eligible?
- —
Short-term bridge; refi at stabilization.
Rent comps 3 comps
| Address | Beds | Baths | Sqft | Rent | $/sqft | DOM | Units | Dist |
|---|---|---|---|---|---|---|---|---|
| 2422 E 70th Ter Kansas City, MO | 2.0 | 1.0 | 748 | $1,356 | $1.81 | 13d | 1 | 0.63mi |
| 6921 Prospect Ave Unit C Kansas City, MO | 1.0 | 1.0 | 538 | $850 | $1.58 | 4d | 1 | 0.66mi |
| 3601 E Meyer Blvd Kansas City, MO | 1.0 | 1.0 | 560 | $900 | $1.61 | 44d | 1 | 0.85mi |
Listing history 15 events
-
2026-05-01status Pending
-
2026-04-06status Active
-
2026-03-30historical Active Under Contract
-
2026-01-24$79,000 Active
-
2026-01-23historical
-
2025-10-22$79,000 Active
-
2007-02-21soldstatus
-
2006-10-27soldstatus 237-char remark
Show marketing remark (237 chars)
Lots of Potential at this Bungalow. Selling As Is-No Seller’s Disclosure-Inspection(s) for buyer knowledge. Earnest Money Deposit is the greater of $1K or 2% of Selling Price, certified funds payable to title company-NO EXCEPTIONS!
-
2006-07-03$17,100 237-char remark
Show marketing remark (237 chars)
Lots of Potential at this Bungalow. Selling As Is-No Seller’s Disclosure-Inspection(s) for buyer knowledge. Earnest Money Deposit is the greater of $1K or 2% of Selling Price, certified funds payable to title company-NO EXCEPTIONS!
-
2004-10-21soldstatus
-
2004-08-04soldstatus $35,000
-
2002-10-18soldstatus
-
2002-03-01$19,500
-
1997-11-13soldstatus
-
1991-06-30soldstatus
ⓘ Source: listings_history table (triggers on properties + properties_extension) + one-shot
backfill from property_details.listing_events for pre-trigger history.
Tax reassessment forecast MO · Resets to sale price
- Current annual tax
- $232 · $19/mo
- Projected year-2 tax
- $766 · $64/mo
- Expected delta
- +$535/yr (+$45/mo · 230.6%)
ⓘ Screening estimate from a state-policy table — verify with the county assessor before closing.
Climate risk First Street
- Flood 1/10 Low FEMA zone X (unshaded) · 0% chance over 30 yrs
- Wildfire 1/10 Low
- Heat 4/10 Moderate 7 d/yr ≥106°F today · 17 d/yr by 30 yrs out
- Wind 2/10 Low
- Air quality 3/10 Moderate 3 unhealthy d/yr today · 5 by 30 yrs out
Nearby sold comps map
Loading sold comps map…
Walkable amenities ~0.75 mi
Loading nearby amenities…
Taxation est. · year 1
- Rental income
- $13,242
- − Mortgage interest
- −$4,425
- − Property taxes
- −$232
- − Insurance
- −$395
- − Repairs & maintenance
- −$1,059
- − Management
- −$1,059
- − Depreciation
- −$2,298
- Taxable income
- $3,773
- Est. tax owed @ 24.0%
- −$906
- After-tax cash flow
- $3,958/yr
For passive investors: Depreciation is non-cash, so a rental often shows a tax loss while cash-flowing — sheltering income. Rental losses are passive: they offset passive income freely, and up to $25,000/yr can offset ordinary (W-2) income if you actively participate and your MAGI is under $100k (phasing out to $0 by $150k); unused losses carry forward. On sale, claimed depreciation is recaptured at up to 25%, and gains may owe capital-gains tax (a 1031 exchange can defer both). Figures are a year-1 estimate at your 24.0% rate — not tax advice; consult a CPA.
Schools (NCES district)
- District
- Kansas City 33
- NCES district ID
- 2916400
- Math proficiency
- 12% ▼ -8.00%
- Reading proficiency
- 24% ▬ 0.00%
- Median HH income
- $35,227
- Composite
- 14.8/100
- National rank
- #9387
- State rank
- #308 of 324 in MO
Livability — Kansas City
- Score
- 78/100
- State rank
- #28
- US rank
- #2671
Category grades
Schools grade is shown separately in the Schools card above.
Census & demographics
- Census place
- Kansas City, MO
- County
- Jackson County · 687,798 people
- City population
- 439,467
- Metro
- Kansas City, MO-KS
- Population (ZIP)
- 12,084
- Household income
- $45,622
- Rent vs Own
- Severe rent burden
- 679.0
Population outlook (Jackson County) Hauer SSP2
- Today (2025)
- 719,589 people
- By 2030
- 731,456 · +1.6%
- By 2040
- 746,689 · +3.8%
- By 2050
- 749,289 · +4.1%
- By 2075
- 736,227 · +2.3%
- By 2100
- 668,210 · -7.1%
Race, ethnicity, and origin ACS 2023
- Neighborhood character
- Predominantly Black (66%)
- Race & ethnicity
- Black 66% White 16% Hispanic / Latino 11% Two or more races 10%
- Hispanic origin (detail)
- Mexican 9%
- Common ancestry
- Italian 2% Scotch-Irish 1% Romanian 1%
- Foreign-born
- 6% · Canada, Jamaica
- Languages at home
- 92% English-only · Spanish 7%
Political lean MEDSL · Jackson
- 2024 margin
- D (+19.3) · D 58.9% · R 39.5% · Other 1.6%
- 2008→2024 swing
- -6.1pp toward R · 2008: 25.4pp · 2024: 19.3pp
- All cycles
- 2024: D+19.3 2020: D+22.0 2016: D+16.6 2012: D+19.0 2008: D+25.4
Not yet ingested
- Civics
- —
Market trends
- HPI YoY
- ▲ 79.13%
- Current HPI
- 414.4305
- Rent YoY
- ▲ 2.98%
- Metro
- Kansas City, MO-KS
- State GDP YoY
- ▲ 1.84%
- F500 in state
- 20
Industry mix (Fortune 500 HQ in MO)
| Industry | F500 HQs | Revenue |
|---|---|---|
| Healthcare | 1 | $163B |
|
||
| Insurance | 1 | $21B |
|
||
| Industrial Technology | 1 | $17B |
|
||
| Retail | 1 | $16B |
|
||
| Industrial Distribution | 1 | $10B |
|
||
| Utilities | 1 | $9B |
|
||
Price history
+305.1% since first listed15 events — show timeline
- 2026-05-01 Pending — Heartland MLS as Distributed by MLS Grid
- 2026-04-06 Relisted — Heartland MLS as Distributed by MLS Grid
- 2026-03-30 Contingent — Heartland MLS as Distributed by MLS Grid
- 2026-01-24 Listed $79,000 Heartland MLS as Distributed by MLS Grid
- 2026-01-23 Listing Removed — Heartland MLS as Distributed by MLS Grid
- 2025-10-22 Listed $79,000 Heartland MLS as Distributed by MLS Grid
- 2007-02-21 Sold (Public Records) — Public Records
- 2006-10-27 Sold (MLS) — Heartland MLS as Distributed by MLS Grid
- 2006-07-03 Listed $17,100 Heartland MLS as Distributed by MLS Grid
- 2004-10-21 Sold (Public Records) — Public Records
- 2004-08-04 Sold (Public Records) $35,000 Public Records
- 2002-10-18 Sold (MLS) — Heartland MLS as Distributed by MLS Grid
- 2002-03-01 Listed $19,500 Heartland MLS as Distributed by MLS Grid
- 1997-11-13 Sold (Public Records) — Public Records
- 1991-06-30 Sold (Public Records) — Public Records
Property tax history
+8.9%/yrLatest (2025): $232 · -48.0% YoY. Source: county tax records.
Cash-flow waterfall
monthlySold comps — $/sqft
last 12 mo · ≤1 miLoading sold comps…