36520 E 124 Rd · Seminole, OK
Flood risk 1/10 · Minimal
- FEMA flood zone
- X (unshaded)
- Chance of flooding over 30 yrs
- 0.0%
- Est. flood insurance / yr
- $507 – $1,088
Fire risk 8/10 · Major
- Est. fire insurance / yr
- $2,463 – $4,575
Heat risk 5/10 · Moderate
- Hot days now (above 110°F)
- 7 days/yr
- Hot days in 30 yrs
- 19 days/yr
Wind risk 4/10 · Minor
- Chance of severe wind over 30 yrs
- 9.0%
Air-quality risk 2/10 · Minimal
- Unhealthy air days now
- 1 days/yr
- Unhealthy air days in 30 yrs
- 1 days/yr
Risk factors via First Street. Map © Google.
Why this score? — see what drove the B- grade
The composite is a weighted blend of 9 inputs, each scored 0–100. Each bar is that input's sub-score; the figure is the points it added to the 100-point composite (weight × sub-score).
- Cash flow +30.0/30.0
- 1% rule +10.0/10.0
- DSCR +10.0/10.0
- Appreciation +8.2/10.0
- Livability +3.2/5.0
- Rent growth +2.5/5.0
- Condition / age +2.5/5.0
- Schools +1.6/10.0
- ARV discount +0.0/15.0
$75,000
🖨 Deal sheet 📄 Offer letter ✓ Due diligence
Listing remarks
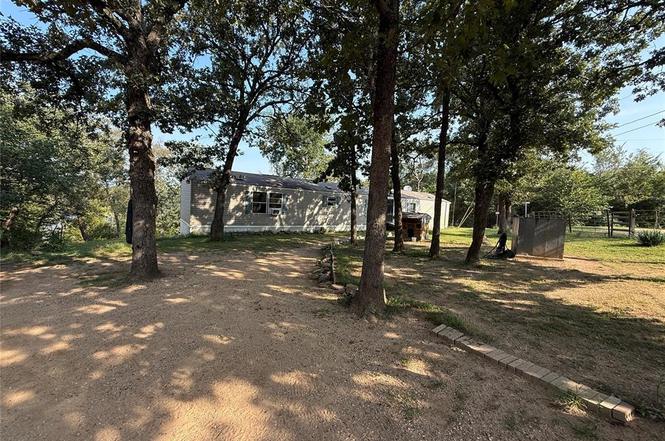
Country living with a Lake View! This 2013 Clayton 18x80 mobile home offers 3 bedrooms, 2 baths, and an inviting open floor plan. Sitting on a half-acre, the property features a private water well, total electric utilities, and gorgeous views of Del Marr Lake. Imagine relaxing on your porch with peaceful water views, or spending the day fishing just steps away. A perfect blend of comfort and country charm!
Key facts
- Fishing steps away
- Lake view
- Private water well
Tags
Property features AI
Finance
- Other: Homestead: yes
- Financial info: Cash offers only; Not assumable
- HOA & community: No mandatory association dues
Exterior
- Utilities: Electricity available; Private well available
- Home design: Single family residence; Mobile construction; One story; Entry condition: Move to site
- Construction: Composition roof; Conventional foundation; Built as a mobile home
- Exterior features: Lake access / waterfront; Water view; Rural setting; Wooded lot
Interior
- Bedrooms: 3 bedrooms
- Bathrooms: 2 full bathrooms
- Heating & cooling: Electric heating; Window cooling units
- Interior features: Ceiling fan(s); No fireplace
Neighborhood map
What this means for you Summary
Snapshot
- This is a 3-bed/2.0-bath single-family listed at $75k.
Deal economics
- At list price, monthly cash flow is $429 ($5k/yr) — positive.
- The deal already cash-flows at list — no discount required.
- Meets the 1% rule at list price ($1k rent vs $75k).
- Recommended offer: $66k (12.0% below list) — sets the bar for market timing.
- Cap rate 13.2% vs local median 4.8% in Seminole — top-decile yield for the area; either an underpriced asset or a hidden risk that comps aren't pricing in. Stress-test before assuming the spread holds.
Location & tenants
- Location reads 63/100 on livability (#222 in OK) — a middle-class / working-renter tenant base. Strengths: cost of living A+, housing A; Watch: crime D+, amenities F, commute F.
- Butner (rural): math 10% / reading 20% proficiency, ranked #475 of 513 in OK (top 93%) — low school quality limits family demand, transient renter base, plan for 1-2y turnover; 68% free/reduced lunch — lower-income household profile, screen leases tightly.
- Zoned schools: Butner Es (math 12% / reading 17%, grade F, #604 of 845 statewide, top 76%, 141 students, 0% FRL); Butner Hs (math 10% / reading 10%, grade F, #361 of 447 statewide, top 94%, 60 students, 0% FRL) — zoned schools average 0% FRL vs 68% district-wide (68 pts lower); this property's tenant base skews higher-income than the district average.
- Market conditions: 29 active listings in the ZIP; 93 units permitted in Seminole County in 2024 (43 in 5+ unit buildings).
Forward outlook
- In year one you build about $5k of equity ($519 loan paydown + $5k appreciation (6.5% local appreciation)).
- At projected returns (6.5% appreciation + 3.0% rent growth), your $21k cash investment doubles in ~2 years — after that, you're playing with house money.
- By year 7, paydown + projected appreciation supports a ~$36k cash-out refi (75% LTV) — recoverable capital for the next deal without selling this one.
Negotiation context
- It's been on market 283 days — a 12% lower offer ($66k) is reasonable based on typical stale-listing flexibility.
- 3 sale attempts since 2y ago with the ask held roughly flat each time — persistent listings suggest the price (not the market) is what's stuck; bring a comps-based counter.
Risks & watch-outs
- Climate carrying-cost: severe wildfire risk; extreme-heat days projected 7→19/yr by 2055 (HVAC capex compounding) — expect insurance premiums to compound above CPI over the hold.
Questions for the listing agent
- It's been on market 283 days. Have you received any prior offers? Is the seller open to a 12% concession, seller financing, or rate buy-down credit?
- Why hasn't it sold? Are there any deal-killer items the seller is aware of (foundation, flood, title, zoning, code violations)?
- Is there a deadline driving the sale (1031 exchange, divorce, estate, relocation)? That informs how much negotiation room exists.
- Schools are F-rated, which usually means shorter tenancies and higher turnover. Who's the typical renter profile here, and what's been the actual vacancy rate?
- Crime grade is D in this area — have there been break-ins, vandalism, or insurance claims at this property in the last 3 years? What carrier currently insures it and at what premium?
- What's the average days-on-market for RENTAL listings here right now (not sales)? A rising rental-DOM trend means longer vacancies and softer asking-rent achievability than the comps imply.
- What's the recent tenant-quality profile in this submarket — average credit score on applications, eviction rate, late-payment / NSF rate, and stable-employment percentage? A property-management company in the area should have these aggregated.
- How much new for-sale + rental construction is in the pipeline within 1–3 miles? Heavy new supply typically softens prices + rents 12–24 months out; constrained supply supports both.
Investment metrics
- 1% rule
- 1.60% ✓
- Cap rate
- 13.15%
- Cash-on-cash
- 24.50%
- DSCR
- 2.09
- GRM
- 5.2
CMA / ARV
- ARV (on-the-fly)
- $57,600
- Comps found
- 1
Show comp detail 1 sale within ~0.75 mi
| Address | Dist | Beds/Ba | Sqft | Sold | Price | $/sf | Match |
|---|---|---|---|---|---|---|---|
| 12404 Jane Dr | 0.23mi | 2/2.0 (-1) | 1,312 (-9%) | 23mo | $52,000 | $40 | 50 |
Match score weights: distance 35% · size 25% · config 20% · recency 20%. Top-matched comps best support the ARV.
Projected returns pro-forma
6.46% appreciation · 3.0% rent growth · sell at horizon
- IRR
- 36.8%
- Equity multiple
- 3.43×
- Total profit
- $51,028
- Equity at exit
- $49,323
- IRR
- 33.9%
- Equity multiple
- 7.11×
- Total profit
- $128,263
- Equity at exit
- $91,384
Cash invested: $21,000 (down + closing). Projections, not guarantees.
Landlord ↔ Tenant lean methodology
- Overall (STATE)
- 83 Strongly Landlord-Friendly
- State Oklahoma
- 83 Strongly Landlord-Friendly · R+20
- County
- — inherits STATE
- City
- — inherits STATE
ZIP-level market 74884
- Home prices YoY
- 2.7%
- Active inventory
- 29
- Price-to-rent
- 5.2×
Monthly cashflow live
- Estimated rent
- $1,199 medium interval (Pro) →
- Mortgage (P&I)
- −$393
- Tax est. 1.5%
- −$94 /mo · $1,125/yr
- Insurance
- −$31
- HOA
- −$0
- Vacancy / Maint / Mgmt
- −$252
- Net cashflow
- $429
Break-even live
UW: 25.0% down · 7.5% · 30yr · 1.5% tax · 5.0% vac · 8.0% maint · 8.0% mgmt
Financing live
Cash to close
- Down payment
- $18,750
- Closing costs
- $2,250
- Reserves months
- —
- Total cash needed
- —
Loan-product check · same deal, 3 products live
Conventional
25% down · 7.5% · 30yr
- Down + closing
- —
- Monthly P&I
- —
- Monthly cashflow
- —
- DSCR
- —
- Eligible?
- —
Personal DTI + credit; lowest rate.
DSCR
20% down · 8.5% · 30yr
- Down + closing
- —
- Monthly P&I
- —
- Monthly cashflow
- —
- DSCR
- —
- Eligible?
- —
No personal income docs; deal must DSCR.
Hard money
10% down · 12.0% · 12mo
- Down + closing
- —
- Monthly P&I
- —
- Monthly cashflow
- —
- DSCR
- —
- Eligible?
- —
Short-term bridge; refi at stabilization.
Listing history 19 events
-
2026-06-18days on market $75,000 Active 283 DOM
-
2026-06-17days on market $75,000 Active 282 DOM
-
2026-06-16days on market $75,000 Active 281 DOM
-
2026-06-15days on market $75,000 Active 280 DOM
-
2026-06-13days on market $75,000 Active 278 DOM
-
2026-06-12days on market $75,000 Active 277 DOM
-
2026-06-09days on market $75,000 Active 274 DOM
-
2026-06-08days on market $75,000 Active 273 DOM
-
2026-06-08days on market $75,000 Active 272 DOM
-
2026-06-05days on market $75,000 Active 270 DOM
-
2026-06-04days on market $75,000 Active 268 DOM
-
2026-06-02days on market $75,000 Active 267 DOM
-
2026-06-01days on market $75,000 Active 266 DOM
-
2026-05-31days on market $75,000 Active 265 DOM
-
2025-09-08$75,000 Active
-
2025-07-10historical
-
2024-08-03status Active
-
2024-08-02historical
-
2024-07-10$79,000 Active
ⓘ Source: listings_history table (triggers on properties + properties_extension) + one-shot
backfill from property_details.listing_events for pre-trigger history.
Climate risk First Street
- Flood 1/10 Low FEMA zone X (unshaded) · 0% chance over 30 yrs
- Wildfire 8/10 Severe
- Heat 5/10 Major 7 d/yr ≥110°F today · 19 d/yr by 30 yrs out
- Wind 4/10 Moderate 9% chance of damaging wind over 30 yrs
- Air quality 2/10 Low 1 unhealthy d/yr today · 1 by 30 yrs out
Nearby sold comps map
Loading sold comps map…
Walkable amenities ~0.75 mi
Loading nearby amenities…
Taxation est. · year 1
- Rental income
- $14,387
- − Mortgage interest
- −$4,201
- − Property taxes
- −$1,125
- − Insurance
- −$375
- − Repairs & maintenance
- −$1,151
- − Management
- −$1,151
- − Depreciation
- −$2,182
- Taxable income
- $4,202
- Est. tax owed @ 24.0%
- −$1,008
- After-tax cash flow
- $4,137/yr
For passive investors: Depreciation is non-cash, so a rental often shows a tax loss while cash-flowing — sheltering income. Rental losses are passive: they offset passive income freely, and up to $25,000/yr can offset ordinary (W-2) income if you actively participate and your MAGI is under $100k (phasing out to $0 by $150k); unused losses carry forward. On sale, claimed depreciation is recaptured at up to 25%, and gains may owe capital-gains tax (a 1031 exchange can defer both). Figures are a year-1 estimate at your 24.0% rate — not tax advice; consult a CPA.
Schools (NCES district)
- District
- Butner
- NCES district ID
- 4006000
- Math proficiency
- 10% ▲ 4.00%
- Reading proficiency
- 20% ▲ 5.00%
- Median HH income
- $37,261
- Composite
- 15.98/100
- National rank
- #14305
- State rank
- #475 of 513 in OK
Livability — Seminole
- Score
- 63/100
- State rank
- #222
- US rank
- #15706
Category grades
Schools grade is shown separately in the Schools card above.
Census & demographics
- Population (ZIP)
- 5,558
Population outlook (Seminole County) Hauer SSP2
- Today (2025)
- 25,628 people
- By 2030
- 25,617 · +-0.0%
- By 2040
- 25,619 · +-0.0%
- By 2050
- 25,726 · +0.4%
- By 2075
- 26,261 · +2.5%
- By 2100
- 25,844 · +0.8%
Race, ethnicity, and origin ACS 2023
- Neighborhood character
- Diverse neighborhood (Simpson 0.69)
- Race & ethnicity
- White 55% Native American 20% Two or more races 13% Black 8% Hispanic / Latino 5%
- Hispanic origin (detail)
- Mexican 5%
- Common ancestry
- Slovak 2% Italian 1%
- Foreign-born
- 1% · Canada
- Languages at home
- 96% English-only · Spanish 2%
Political lean MEDSL · Seminole
- 2024 margin
- Solid R (+49.7) · D 24.2% · R 74.0% · Other 1.8%
- 2008→2024 swing
- -19.1pp toward R · 2008: -30.6pp · 2024: -49.7pp
- All cycles
- 2024: R+49.7 2020: R+46.3 2016: R+44.1 2012: R+30.3 2008: R+30.6
Not yet ingested
- Civics
- —
Market trends
- HPI YoY
- ▲ 6.46%
- Current HPI
- 245.5435
- Rent YoY
- —
- Metro
- —
- State GDP YoY
- ▲ 1.55%
- F500 in state
- 6
Industry mix (Fortune 500 HQ in OK)
| Industry | F500 HQs | Revenue |
|---|---|---|
| Energy | 3 | $48B |
|
||
Price history
-5.1% since first listed5 events — show timeline
- 2025-09-08 Listed $75,000 MLSOK
- 2025-07-10 Listing Removed — MLSOK
- 2024-08-03 Relisted — MLSOK
- 2024-08-02 Listing Removed — MLSOK
- 2024-07-10 Listed $79,000 MLSOK
Cash-flow waterfall
monthlySold comps — $/sqft
last 12 mo · ≤1 miLoading sold comps…