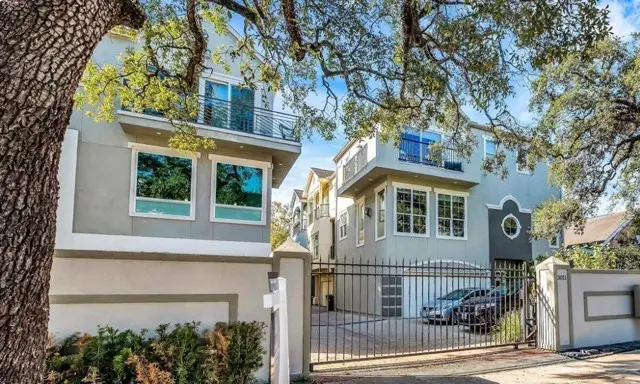
3011 Houston Ave Unit B · Houston, TX
Flood risk 1/10 · Minimal
- FEMA flood zone
- X (unshaded)
- Chance of flooding over 30 yrs
- 0.0%
- Est. flood insurance / yr
- $507 – $1,088
Fire risk 1/10 · Minimal
- Est. fire insurance / yr
- $1,222 – $2,270
Heat risk 9/10 · Severe
- Hot days now (above 109°F)
- 7 days/yr
- Hot days in 30 yrs
- 24 days/yr
Wind risk 9/10 · Severe
- Chance of severe wind over 30 yrs
- 99.0%
Air-quality risk 3/10 · Minor
- Unhealthy air days now
- 2 days/yr
- Unhealthy air days in 30 yrs
- 3 days/yr
Risk factors via First Street. Map © Google.
Why this score? — see what drove the D grade
The composite is a weighted blend of 9 inputs, each scored 0–100. Each bar is that input's sub-score; the figure is the points it added to the 100-point composite (weight × sub-score).
- Cash flow +14.1/30.0
- ARV discount +7.5/15.0
- DSCR +4.3/10.0
- 1% rule +3.9/10.0
- Livability +3.7/5.0
- Rent growth +2.7/5.0
- Schools +2.7/10.0
- Condition / age +2.5/5.0
- Appreciation +0.0/10.0
$405,000
🖨 Deal sheet 📄 Offer letter ✓ Due diligence
Listing remarks MLS
Location! Location! Location! This gorgeous home is in a small gated community within walking distance from several bars and restaurants the White Oak hiking trail and Uncle Bean's coffee just across the street. Quick bike ride to White Oak restaurants, bars, parks, and coffee shops. Zoned to one of the best elementary schools in Houston, Travis Elementary. Book your showing today! NO FLOODING EVER! Call Shireen Hadi for more information: 713-377-2133
Key facts
- Gated community
- Walking distance
- Travis elementary
Tags
Neighborhood map
What this means for you Summary
Snapshot
- This is a 3-bed/3.5-bath single-family listed at $405k.
Deal economics
- At list price, monthly cash flow is $63 ($752/yr) — positive.
- The deal already cash-flows at list — no discount required.
- To meet the 1% rule (rent ≥ 1% of price), the offer needs to be $362k (10.6% below list).
- Recommended offer: $356k (12.0% below list) — sets the bar for market timing.
- Cap rate 6.5% vs local median 3.2% in Houston — top-decile yield for the area; either an underpriced asset or a hidden risk that comps aren't pricing in. Stress-test before assuming the spread holds.
Location & tenants
- Location reads 74/100 on livability (#184 in TX, #4,771 nationally) — a middle-class / working-renter tenant base. Strengths: amenities A+, cost of living A+, housing A+; Watch: schools D, crime F.
- Houston ISD (urban): math 27% / reading 35% proficiency, ranked #593 of 826 in TX (top 72%) — families likely to look elsewhere, expect single-tenant / working-renter base with shorter leases; 71% free/reduced lunch — lower-income household profile, screen leases tightly.
- Market conditions: Rents flat; 595 active listings in the ZIP; 16 comparable units currently listed for rent nearby; rentals lingering (median 44d on market — plan ~5-8 weeks vacancy on turnover, expect pricing pressure); 69% of comp listings sitting > 30 days — soft ceiling on asking rent; solid renter incomes; 29,883 units permitted in Harris County in 2024 (8,621 in 5+ unit buildings).
- At $3,622/mo this rent would consume 52% of the median local household income ($83k/yr) (locally 994% of renters already pay >50% of income on rent) — very limited rent-growth headroom before tenants either downsize or default.
Forward outlook
- Local home prices are declining (-3.0%/yr); year-one equity from $3k of loan paydown is wiped out by about $12k of value loss. Plan a longer hold.
- Harris County population projected at +47% by 2050 — long-run rental-demand tailwind backs the buy-and-hold thesis.
Negotiation context
- It's been on market 127 days — a 12% lower offer ($356k) is reasonable based on typical stale-listing flexibility.
- 19 sale attempts since 23y ago; this cycle's ask has dropped $95k (19%) from the opening price — seller is motivated, your offer sets the floor, not the list.
Risks & watch-outs
- Climate carrying-cost: severe wind risk, 99% chance of damaging wind over 30y; extreme-heat days projected 7→24/yr by 2055 (HVAC capex compounding) — expect insurance premiums to compound above CPI over the hold.
Questions for the listing agent
- It's been on market 127 days. Have you received any prior offers? Is the seller open to a 12% concession, seller financing, or rate buy-down credit?
- Why hasn't it sold? Are there any deal-killer items the seller is aware of (foundation, flood, title, zoning, code violations)?
- Is there a deadline driving the sale (1031 exchange, divorce, estate, relocation)? That informs how much negotiation room exists.
- Schools are D-rated, which usually means shorter tenancies and higher turnover. Who's the typical renter profile here, and what's been the actual vacancy rate?
- Crime grade is F in this area — have there been break-ins, vandalism, or insurance claims at this property in the last 3 years? What carrier currently insures it and at what premium?
- The area grade is low — what's the realistic commute time and amenity access for the typical tenant pool here? Any planned neighborhood developments (good or bad) we should know about?
- What's the average days-on-market for RENTAL listings here right now (not sales)? A rising rental-DOM trend means longer vacancies and softer asking-rent achievability than the comps imply.
- What's the recent tenant-quality profile in this submarket — average credit score on applications, eviction rate, late-payment / NSF rate, and stable-employment percentage? A property-management company in the area should have these aggregated.
- How much new for-sale + rental construction is in the pipeline within 1–3 miles? Heavy new supply typically softens prices + rents 12–24 months out; constrained supply supports both.
Investment metrics
- 1% rule
- 0.89% ✗
- Cap rate
- 6.48%
- Cash-on-cash
- 0.66%
- DSCR
- 1.03
- GRM
- 9.3
CMA / ARV
- ARV (median comp)
- $879,264
- List price
- $405,000
- Delta
- -53.94%
- Verdict
- UNDERPRICED
- Comps
- 20 within 1.0 mi
Show comp detail 12 sales within ~0.75 mi
| Address | Dist | Beds/Ba | Sqft | Sold | Price | $/sf | Match |
|---|---|---|---|---|---|---|---|
| 3012 Beauchamp St | 0.09mi | 3/4.0 | 2,704 (+9%) | 1mo | $1,195,000 | $442 | 77 |
| 414 Woodland St | 0.19mi | 3/2.0 | 2,365 (-4%) | 3mo | $1,100,000 | $465 | 76 |
| 711 Boundary St | 0.53mi | 3/3.5 | 2,447 (-1%) | 1mo | $439,000 | $179 | 73 |
| 518 Byrne St | 0.31mi | 4/2.5 (+1) | 2,344 (-5%) | 2mo | $1,220,000 | $520 | 66 |
| 814 Omar St | 0.56mi | 4/3.5 (+1) | 2,496 (+1%) | 2mo | $1,285,000 | $515 | 66 |
| 2916 Michaux St | 0.69mi | 3/3.5 | 2,500 (+1%) | 3mo | $900,000 | $360 | 64 |
| 1511 Alamo St | 0.66mi | 3/3.5 | 2,397 (-3%) | 1mo | $499,999 | $209 | 63 |
| 719 Woodland St | 0.47mi | 3/2.5 | 2,336 (-6%) | 4mo | $990,000 | $424 | 62 |
| 2405 Freeman St | 0.56mi | 3/2.5 | 2,336 (-6%) | 2mo | $425,000 | $182 | 59 |
| 950 Omar St | 0.72mi | 3/3.5 | 2,550 (+3%) | 3mo | $1,300,000 | $510 | 59 |
| 912 Teetshorn St | 0.64mi | 3/2.5 | 2,814 (+14%) | 2mo | $1,149,000 | $408 | 42 |
| 603 Vincent St | 0.73mi | 4/2.5 (+1) | 2,800 (+13%) | 4mo | $775,000 | $277 | 32 |
Match score weights: distance 35% · size 25% · config 20% · recency 20%. Top-matched comps best support the ARV.
Projected returns pro-forma
-3.0% appreciation · 0.84% rent growth · sell at horizon
- IRR
- -17.7%
- Equity multiple
- 0.39×
- Total profit
- $-69,290
- Equity at exit
- $60,387
- IRR
- -14.5%
- Equity multiple
- 0.25×
- Total profit
- $-85,259
- Equity at exit
- $35,017
Cash invested: $113,400 (down + closing). Projections, not guarantees.
Landlord ↔ Tenant lean methodology
- Overall (STATE)
- 87 Strongly Landlord-Friendly
- State Texas
- 87 Strongly Landlord-Friendly · R+5
- County
- — inherits STATE
- City
- — inherits STATE
ZIP-level market 77009
- Rents YoY
- 0.8%
- Active inventory
- 595
- Price-to-rent
- 9.3×
Monthly cashflow live
- Estimated rent
- $3,622 high interval (Pro) →
- Mortgage (P&I)
- −$2,124
- Tax est. 1.5%
- −$506 /mo · $6,075/yr
- Insurance
- −$169
- HOA
- −$0
- Vacancy / Maint / Mgmt
- −$761
- Net cashflow
- $63
Break-even live
UW: 25.0% down · 7.5% · 30yr · 1.5% tax · 5.0% vac · 8.0% maint · 8.0% mgmt
Financing live
Cash to close
- Down payment
- $101,250
- Closing costs
- $12,150
- Reserves months
- —
- Total cash needed
- —
Loan-product check · same deal, 3 products live
Conventional
25% down · 7.5% · 30yr
- Down + closing
- —
- Monthly P&I
- —
- Monthly cashflow
- —
- DSCR
- —
- Eligible?
- —
Personal DTI + credit; lowest rate.
DSCR
20% down · 8.5% · 30yr
- Down + closing
- —
- Monthly P&I
- —
- Monthly cashflow
- —
- DSCR
- —
- Eligible?
- —
No personal income docs; deal must DSCR.
Hard money
10% down · 12.0% · 12mo
- Down + closing
- —
- Monthly P&I
- —
- Monthly cashflow
- —
- DSCR
- —
- Eligible?
- —
Short-term bridge; refi at stabilization.
Rent comps 16 comps
| Address | Beds | Baths | Sqft | Rent | $/sqft | DOM | Units | Dist |
|---|---|---|---|---|---|---|---|---|
| 2403 Everett St Unit A Houston, TX | 3.0 | 3.5 | 2093 | $2,800 | $1.34 | 43d | 1 | 0.58mi |
| 401 Walton St Houston, TX | 3.0 | 2.0 | 2112 | $2,500 | $1.18 | 15d | 1 | 0.63mi |
| 2114 Sabine St Unit 1257735P Houston, TX | 3.0 | 3.5 | 2594 | $6,588 | $2.54 | 43d | 1 | 0.71mi |
| 2114 Sabine St Houston, TX | 3.0 | 4.0 | 2020 | $3,200 | $1.58 | 43d | 1 | 0.71mi |
| 1510 Crockett St Houston, TX | 2.0 | 3.0 | 1912 | $2,800 | $1.46 | 43d | 1 | 0.82mi |
| 1512 Crockett St Unit A Houston, TX | 2.0 | 2.5 | 1808 | $2,800 | $1.55 | 43d | 1 | 0.82mi |
| 410 James St Houston, TX | 3.0 | 2.0 | 1602 | $6,750 | $4.21 | 43d | 1 | 0.83mi |
| 410 James St Unit 1031793P Houston, TX | 3.0 | 2.0 | 1593 | $7,554 | $4.74 | 16d | 1 | 0.83mi |
| 1116 Woodland St Houston, TX | 3.0 | 2.0 | 2400 | $4,000 | $1.67 | 43d | 1 | 0.89mi |
| 2018 Crockett St Unit 1029793P Houston, TX | 3.0 | 3.5 | 2507 | $6,482 | $2.59 | 5d | 1 | 0.93mi |
| 2018 Crockett St Unit 2018 Houston, TX | 3.0 | 3.5 | 2514 | $8,000 | $3.18 | 43d | 1 | 0.93mi |
| 2706 Cochran St Houston, TX | 3.0 | 3.5 | 1791 | $2,700 | $1.51 | 19d | 1 | 0.96mi |
| 4605 Fisk St Houston, TX | 3.0 | 2.0 | 1628 | $3,000 | $1.84 | 43d | 1 | 1.09mi |
| 1039 Hillstar St Houston, TX | 3.0 | 2.5 | 1780 | $2,750 | $1.54 | 12d | 1 | 1.24mi |
| 4615 Indie Heights Ln Houston, TX | 2.0 | 2.0 | 1685 | $2,900 | $1.72 | 43d | 1 | 1.42mi |
| 1614 Northwood St Houston, TX | 3.0 | 3.5 | 2300 | $2,850 | $1.24 | 44d | 1 | 1.44mi |
Listing history 50 events
-
2026-06-18days on market $405,000 Active 127 DOM
-
2026-06-17days on market $405,000 Active 126 DOM
-
2026-06-16days on market $405,000 Active 125 DOM
-
2026-06-15days on market $405,000 Active 124 DOM
-
2026-06-13days on market $405,000 Active 122 DOM
-
2026-06-10days on market $405,000 Active 118 DOM
-
2026-06-08days on market $405,000 Active 117 DOM
-
2026-06-07pricedays on market $405,000 Active 116 DOM
-
2026-06-04days on market $425,000 Active 113 DOM
-
2026-06-01days on market $425,000 Active 110 DOM
-
2026-05-31days on market $425,000 Active 109 DOM
-
2026-05-13price $425,000 455-char remark
Show marketing remark (455 chars)
Location! Location! Location! This gorgeous home is in a small gated community within walking distance from several bars and restaurants the White Oak hiking trail and Uncle Bean's coffee just across the street. Quick bike ride to White Oak restaurants, bars, parks, and coffee shops. Zoned to one of the best elementary schools in Houston, Travis Elementary. Book your showing today! NO FLOODING EVER! Call Shireen Hadi for more information: 713-377-2133
-
2026-04-07price $435,000 455-char remark
Show marketing remark (455 chars)
Location! Location! Location! This gorgeous home is in a small gated community within walking distance from several bars and restaurants the White Oak hiking trail and Uncle Bean's coffee just across the street. Quick bike ride to White Oak restaurants, bars, parks, and coffee shops. Zoned to one of the best elementary schools in Houston, Travis Elementary. Book your showing today! NO FLOODING EVER! Call Shireen Hadi for more information: 713-377-2133
-
2026-03-04price $450,000 455-char remark
Show marketing remark (455 chars)
Location! Location! Location! This gorgeous home is in a small gated community within walking distance from several bars and restaurants the White Oak hiking trail and Uncle Bean's coffee just across the street. Quick bike ride to White Oak restaurants, bars, parks, and coffee shops. Zoned to one of the best elementary schools in Houston, Travis Elementary. Book your showing today! NO FLOODING EVER! Call Shireen Hadi for more information: 713-377-2133
-
2026-02-24price $480,000 455-char remark
Show marketing remark (455 chars)
Location! Location! Location! This gorgeous home is in a small gated community within walking distance from several bars and restaurants the White Oak hiking trail and Uncle Bean's coffee just across the street. Quick bike ride to White Oak restaurants, bars, parks, and coffee shops. Zoned to one of the best elementary schools in Houston, Travis Elementary. Book your showing today! NO FLOODING EVER! Call Shireen Hadi for more information: 713-377-2133
-
2026-02-11$500,000 Active 455-char remark
Show marketing remark (455 chars)
Location! Location! Location! This gorgeous home is in a small gated community within walking distance from several bars and restaurants the White Oak hiking trail and Uncle Bean's coffee just across the street. Quick bike ride to White Oak restaurants, bars, parks, and coffee shops. Zoned to one of the best elementary schools in Houston, Travis Elementary. Book your showing today! NO FLOODING EVER! Call Shireen Hadi for more information: 713-377-2133
-
2026-01-01historical $2,750
-
2025-10-09price $2,750
-
2025-09-05$2,900
-
2024-09-05historical
-
2024-09-03historical $3,000
-
2024-08-16price $3,000
-
2024-07-31$3,200
-
2024-07-31$430,000 Active
-
2024-07-31price $430,000
-
2024-04-01historical
-
2023-10-06historical $2,750
-
2023-08-12price $2,750
-
2023-08-02price $2,800
-
2023-07-11$3,000
-
2023-07-10$465,000 Active
-
2023-06-30historical
-
2023-03-06status Active
-
2023-03-06status Active
-
2023-03-06historical
-
2023-03-06historical
-
2023-03-06$465,000 Active
-
2022-11-19historical
-
2022-08-12price $465,000
-
2022-06-21price $515,000
-
2022-06-21$2,600 Active
-
2022-06-02historical
-
2022-02-05$535,000 Active
-
2019-04-25historical
-
2019-04-01$385,000 Active
-
2019-01-23$2,500 Active
-
2019-01-23historical
-
2018-08-21historical
-
2018-06-28price $429,000
-
2018-06-18$400,900 Active
ⓘ Source: listings_history table (triggers on properties + properties_extension) + one-shot
backfill from property_details.listing_events for pre-trigger history.
Climate risk First Street
- Flood 1/10 Low FEMA zone X (unshaded) · 0% chance over 30 yrs
- Wildfire 1/10 Low
- Heat 9/10 Extreme 7 d/yr ≥109°F today · 24 d/yr by 30 yrs out
- Wind 9/10 Extreme 99% chance of damaging wind over 30 yrs
- Air quality 3/10 Moderate 2 unhealthy d/yr today · 3 by 30 yrs out
Nearby sold comps map
Loading sold comps map…
Walkable amenities ~0.75 mi
Loading nearby amenities…
Taxation est. · year 1
- Rental income
- $43,466
- − Mortgage interest
- −$22,686
- − Property taxes
- −$6,075
- − Insurance
- −$2,025
- − Repairs & maintenance
- −$3,477
- − Management
- −$3,477
- − Depreciation
- −$11,782
- Taxable loss
- −$6,057
- Est. tax savings @ 24.0%
- +$1,454
- After-tax cash flow
- $2,205/yr
For passive investors: Depreciation is non-cash, so a rental often shows a tax loss while cash-flowing — sheltering income. Rental losses are passive: they offset passive income freely, and up to $25,000/yr can offset ordinary (W-2) income if you actively participate and your MAGI is under $100k (phasing out to $0 by $150k); unused losses carry forward. On sale, claimed depreciation is recaptured at up to 25%, and gains may owe capital-gains tax (a 1031 exchange can defer both). Figures are a year-1 estimate at your 24.0% rate — not tax advice; consult a CPA.
Schools (NCES district)
- District
- Houston ISD
- NCES district ID
- 4823640
- Math proficiency
- 27% ▼ -18.00%
- Reading proficiency
- 35% ▼ -6.00%
- Median HH income
- $46,054
- Composite
- 26.63/100
- National rank
- #7173
- State rank
- #593 of 826 in TX
Livability — Houston
- Score
- 74/100
- State rank
- #184
- US rank
- #4771
Category grades
Schools grade is shown separately in the Schools card above.
Census & demographics
- Census place
- Houston, TX
- County
- Harris County · 4,702,590 people
- City population
- 3,226,434
- Metro
- Houston-The Woodlands-Sugar Land, TX
- Population (ZIP)
- 35,769
- Household income
- $83,148
- Rent vs Own
- Severe rent burden
- 994.0
Population outlook (Harris County) Hauer SSP2
- Today (2025)
- 5,571,493 people
- By 2030
- 6,089,821 · +9.3%
- By 2040
- 7,142,806 · +28.2%
- By 2050
- 8,185,864 · +46.9%
- By 2075
- 10,574,329 · +89.8%
- By 2100
- 12,109,958 · +117.4%
Race, ethnicity, and origin ACS 2023
- Neighborhood character
- Diverse neighborhood (Simpson 0.60)
- Race & ethnicity
- Hispanic / Latino 53% White 33% Two or more races 22% Black 8% Asian 3%
- Hispanic origin (detail)
- Mexican 46%
- Common ancestry
- Italian 2% Lithuanian 2% Slovak 1%
- Foreign-born
- 20% · Canada
- Languages at home
- 55% English-only · Spanish 40% Other Indo-European 2% Other Asian/Pacific 1%
Political lean MEDSL · Harris
- 2024 margin
- Lean D (+5.5) · D 52.0% · R 46.4% · Other 1.6%
- 2008→2024 swing
- +3.9pp toward D · 2008: 1.6pp · 2024: 5.5pp
- All cycles
- 2024: D+5.5 2020: D+13.3 2016: D+12.4 2012: D+0.1 2008: D+1.6
Not yet ingested
- Civics
- —
Market trends
- HPI YoY
- ▼ -533.57%
- Current HPI
- 219.5037
- Rent YoY
- ▲ 0.84%
- Metro
- Houston-The Woodlands-Sugar Land, TX
- State GDP YoY
- ▲ 3.95%
- F500 in state
- 110
Industry mix (Fortune 500 HQ in TX)
| Industry | F500 HQs | Revenue |
|---|---|---|
| Energy | 16 | $1,198B |
|
||
| Technology | 5 | $198B |
|
||
| Engineering / Construction | 4 | $72B |
|
||
| Energy Services | 3 | $60B |
|
||
| Utilities | 3 | $41B |
|
||
| Healthcare | 2 | $330B |
|
||
Price history
+52.3% since first listed49 events — show timeline
- 2026-05-13 Price Changed $425,000 HARMLS
- 2026-04-07 Price Changed $435,000 HARMLS
- 2026-03-04 Price Changed $450,000 HARMLS
- 2026-02-24 Price Changed $480,000 HARMLS
- 2026-02-11 Listed $500,000 HARMLS
- 2026-01-01 Rental Removed $2,750 HARMLS
- 2025-10-09 Price Changed $2,750 HARMLS
- 2025-09-05 Listed for Rent $2,900 HARMLS
- 2024-09-05 Listing Removed — HARMLS
- 2024-09-03 Rental Removed $3,000 HARMLS
- 2024-08-16 Price Changed $3,000 HARMLS
- 2024-07-31 Listed for Rent $3,200 HARMLS
- 2024-07-31 Listed $430,000 HARMLS
- 2024-07-31 Price Changed $430,000 HARMLS
- 2024-04-01 Listing Removed — HARMLS
- 2023-10-06 Rental Removed $2,750 HARMLS
- 2023-08-12 Price Changed $2,750 HARMLS
- 2023-08-02 Price Changed $2,800 HARMLS
- 2023-07-11 Listed for Rent $3,000 HARMLS
- 2023-07-10 Listed $465,000 HARMLS
- 2023-06-30 Listing Removed — HARMLS
- 2023-03-06 Relisted — HARMLS
- 2023-03-06 Relisted — HARMLS
- 2023-03-06 Listed $465,000 HARMLS
- 2023-03-06 Listing Removed — HARMLS
- 2023-03-06 Listing Removed — HARMLS
- 2022-11-19 Listing Removed — HARMLS
- 2022-08-12 Price Changed $465,000 HARMLS
- 2022-06-21 Price Changed $515,000 HARMLS
- 2022-06-21 Listed $2,600 HARMLS
- 2022-06-02 Listing Removed — HARMLS
- 2022-02-05 Listed $535,000 HARMLS
- 2019-04-25 Listing Removed — HARMLS
- 2019-04-01 Listed $385,000 HARMLS
- 2019-01-23 Listing Removed — HARMLS
- 2019-01-23 Listed $2,500 HARMLS
- 2018-08-21 Listing Removed — HARMLS
- 2018-06-28 Price Changed $429,000 HARMLS
- 2018-06-18 Listed $400,900 HARMLS
- 2008-01-20 Listing Removed — HARMLS
- 2007-06-09 Listed $286,000 HARMLS
- 2006-10-29 Listing Removed — HARMLS
- 2006-07-20 Listed $280,000 HARMLS
- 2005-08-19 Listing Removed — HARMLS
- 2005-07-22 Listed $349,000 HARMLS
- 2004-10-07 Listing Removed — HARMLS
- 2004-03-10 Listed $299,900 HARMLS
- 2004-02-23 Listing Removed — HARMLS
- 2003-01-16 Listed $279,000 HARMLS
Cash-flow waterfall
monthlySold comps — $/sqft
last 12 mo · ≤1 miLoading sold comps…