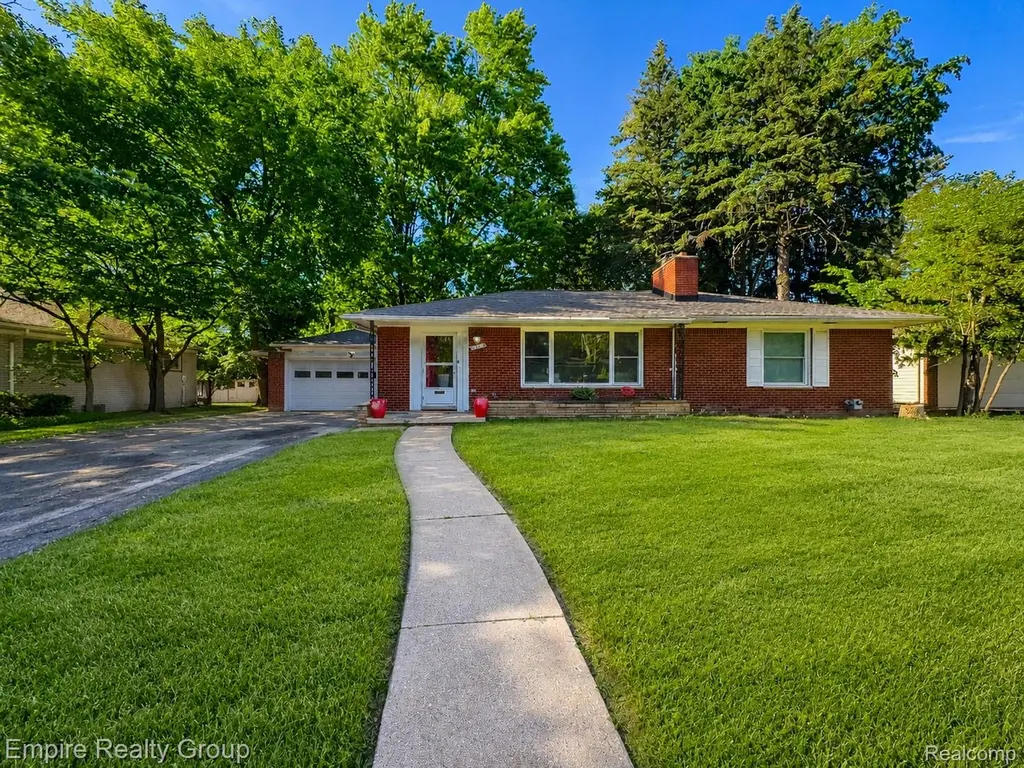
17300 Buckingham Ave · Beverly Hills, MI
Flood risk 1/10 · Minimal
- FEMA flood zone
- X (unshaded)
- Chance of flooding over 30 yrs
- 0.0%
- Est. flood insurance / yr
- $473 – $860
Fire risk 1/10 · Minimal
- Est. fire insurance / yr
- $784 – $1,456
Heat risk 2/10 · Minimal
- Hot days now (above 97°F)
- 7 days/yr
- Hot days in 30 yrs
- 15 days/yr
Wind risk 2/10 · Minimal
- Chance of severe wind over 30 yrs
- —
Air-quality risk 4/10 · Minor
- Unhealthy air days now
- 3 days/yr
- Unhealthy air days in 30 yrs
- 6 days/yr
Risk factors via First Street. Map © Google.
Why this score? — see what drove the C- grade
The composite is a weighted blend of 9 inputs, each scored 0–100. Each bar is that input's sub-score; the figure is the points it added to the 100-point composite (weight × sub-score).
- ARV discount +15.0/15.0
- Cash flow +12.9/30.0
- Schools +6.1/10.0
- Livability +4.2/5.0
- DSCR +3.8/10.0
- 1% rule +3.7/10.0
- Rent growth +2.5/5.0
- Condition / age +2.5/5.0
- Appreciation +0.0/10.0
$419,000
🖨 Deal sheet (PDF) 📄 Offer letter ✓ Due diligence
Listing remarks MLS
"Welcome to this beautifully maintained brick ranch, perfectly situated in the highly sought-after Beverly Hills Village and award-winning Birmingham school district. Offering a bright and seamless single-level floor plan, this home features 3 spacious bedrooms, a full bath, and a convenient lavatory. The inviting living room boasts a cozy fireplace and flows naturally into the formal dining room and kitchen - complete with classic ceramic tiling and stainless-steel appliances. Additional highlights include beautiful hardwood floors, an attached 2-car garage, and a full, unfinished basement providing a massive blank canvas for your storage or customization needs. Nestled on a generous 0.26-acre lot with mature landscaping, an enclosed deck, and a gazebo, it's the perfect setting for outdoor relaxing or entertaining. Excellent location just south of 14 Mile Road and west of Woodward Avenue with easy access to shopping, dining, and main thoroughfares. Schedule your tour today!", , Property is being sold as is.
Key facts
- Ceramic tiling
- Cozy fireplace
- 0.26 acre lot
Tags
Property features AI
Exterior
- Parking: Attached garage with 2 parking spaces
- Utilities: Public water; Public sewer
- Home design: Single-family residence; One level; Ground-level entry
- Construction: Brick construction
- Exterior features: Paved road access; Lot dimensions approximately 83.29 x 135 feet; Lot size about 0.26 acres
Interior
- Bathrooms: 1 full bathroom; 1 half bathroom
- Heating & cooling: Forced air heating (natural gas); No central cooling
- Interior features: Finished basement; Total of 7 rooms
Neighborhood map
What this means for you Summary
Snapshot
- This is a 3-bed/1.5-bath single-family listed at $419k.
Deal economics
- At list price, monthly cash flow is $-34 ($-403/yr) — negative.
- To cash-flow at today's rent, offer at most $413k (1.4% below list).
- To meet the 1% rule (rent ≥ 1% of price), the offer needs to be $365k (12.8% below list).
- Recommended offer: $365k (12.8% below list) — sets the bar for 1% rule.
- Cap rate 6.2% vs local median 2.9% in Beverly Hills — top-decile yield for the area; either an underpriced asset or a hidden risk that comps aren't pricing in. Stress-test before assuming the spread holds.
Location & tenants
- Location reads 84/100 on livability (#38 in MI, #791 nationally) — a professional / high-income tenant draw. Strengths: schools A+, crime A+, employment A+; Watch: amenities F, cost of living D-, health & safety F.
- Birmingham Public Schools (suburban): math 58% / reading 71% proficiency, ranked #18 of 540 in MI (top 3%) — acceptable for families but not a draw, mixed tenant base, ~2y average lease; only 6% free/reduced lunch — higher-income household profile.
- Market conditions: 93 active listings in the ZIP; 10 comparable units currently listed for rent nearby; rentals at typical pace (median 15d on market — plan ~3-4 weeks tenant-placement turnaround); 2,614 units permitted in Oakland County in 2024 (721 in 5+ unit buildings).
Forward outlook
- Local home prices are declining (-3.0%/yr); year-one equity from $3k of loan paydown is wiped out by about $13k of value loss. Plan a longer hold.
- Oakland County population projected at +10% by 2050 — modest demand growth; plan on rents tracking national, not racing it.
Negotiation context
- It's been on market 17 days — a 2% lower offer ($413k) is reasonable based on typical stale-listing flexibility.
- 4 sale attempts since 6y ago with the ask held roughly flat each time — persistent listings suggest the price (not the market) is what's stuck; bring a comps-based counter.
- Current owner paid $69k; list at $419k implies a 507% gain — meaningful room to come down on a strong offer.
Risks & watch-outs
- Watch-outs: built in 1953 — expect roof / HVAC / electrical / plumbing capex.
Questions for the listing agent
- What do current leases actually rent for vs. the listed asking? Can we see a recent rent roll and the last 12 months of T-12 income?
- Built in 1953 — when were the roof, HVAC, electrical panel, plumbing, and water heater last replaced?
- Is there a deadline driving the sale (1031 exchange, divorce, estate, relocation)? That informs how much negotiation room exists.
- Schools are A-rated — typically a magnet for longer-tenancy family renters. What's the average tenant stay here, and is there a school-zone premium baked into asking?
- What's the average days-on-market for RENTAL listings here right now (not sales)? A rising rental-DOM trend means longer vacancies and softer asking-rent achievability than the comps imply.
- What's the recent tenant-quality profile in this submarket — average credit score on applications, eviction rate, late-payment / NSF rate, and stable-employment percentage? A property-management company in the area should have these aggregated.
- How much new for-sale + rental construction is in the pipeline within 1–3 miles? Heavy new supply typically softens prices + rents 12–24 months out; constrained supply supports both.
Investment metrics
- 1% rule
- 0.87% ✗
- Cap rate
- 6.20%
- Cash-on-cash
- -0.34%
- DSCR
- 0.98
- GRM
- 9.6
CMA / ARV
- ARV (on-the-fly)
- $670,454
- Comps found
- 12
Show comp detail 12 sales within ~0.75 mi
| Address | Dist | Beds/Ba | Sqft | Sold | Price | $/sf | Match |
|---|---|---|---|---|---|---|---|
| 1961 Washington Blvd | 0.22mi | 3/2.0 | 2,387 (-4%) | 2mo | $650,000 | $272 | 81 |
| 17330 Beverly Rd | 0.31mi | 3/2.5 | 2,650 (+7%) | 2mo | $554,000 | $209 | 68 |
| 16083 Kirkshire Ave | 0.43mi | 4/2.5 (+1) | 2,500 (+1%) | 2mo | $400,000 | $160 | 68 |
| 16950 Locherbie Ave | 0.26mi | 3/2.5 | 2,235 (-10%) | 0mo | $510,000 | $228 | 67 |
| 1556 Stanley Blvd | 0.43mi | 3/2.0 | 2,213 (-10%) | 2mo | $560,000 | $253 | 59 |
| 972 Northlawn Blvd | 0.62mi | 3/2.5 | 2,624 (+6%) | 1mo | $610,000 | $232 | 56 |
| 18930 Hillcrest St | 0.69mi | 4/1.5 (+1) | 2,369 (-4%) | 2mo | $699,000 | $295 | 54 |
| 764 W Lincoln St | 0.71mi | 3/3.0 | 2,584 (+4%) | 1mo | $700,000 | $271 | 52 |
| 707 Wallace St | 0.73mi | 3/2.5 | 2,293 (-7%) | 3mo | $900,000 | $392 | 47 |
| 18851 Devonshire St | 0.72mi | 3/2.0 | 2,756 (+11%) | 1mo | $760,000 | $276 | 44 |
| 32240 Auburn Dr | 0.70mi | 3/1.5 | 2,112 (-15%) | 1mo | $585,000 | $277 | 42 |
| 16011 Amherst Ave | 0.74mi | 3/2.5 | 2,792 (+13%) | 0mo | $700,000 | $251 | 40 |
Match score weights: distance 35% · size 25% · config 20% · recency 20%. Top-matched comps best support the ARV.
Projected returns pro-forma
-3.0% appreciation · 3.0% rent growth · sell at horizon
- IRR
- -16.8%
- Equity multiple
- 0.40×
- Total profit
- $-69,967
- Equity at exit
- $62,474
- IRR
- -8.7%
- Equity multiple
- 0.46×
- Total profit
- $-63,396
- Equity at exit
- $36,227
Cash invested: $117,320 (down + closing). Projections, not guarantees.
Landlord ↔ Tenant lean methodology
- Overall (STATE)
- 62 Landlord-Friendly
- State Michigan
- 62 Landlord-Friendly · EVEN
- County
- — inherits STATE
- City
- — inherits STATE
ZIP-level market 48025
- Active inventory
- 93
- Price-to-rent
- 9.6×
Monthly cashflow live
- Estimated rent
- $3,655 high interval (Pro) →
- Mortgage (P&I)
- −$2,197
- Tax from tax record
- −$549 /mo · $6,586/yr
- Insurance
- −$175
- HOA
- −$0
- Vacancy / Maint / Mgmt
- −$767
- Net cashflow
- $-34
Break-even live
Sensitivity live
| Price | -10% $204 | -5% $85 | +0% $-34 | +5% $-152 | +10% $-271 |
|---|---|---|---|---|---|
| Rent | -10% $-322 | -5% $-178 | +0% $-34 | +5% $111 | +10% $255 |
| Rate | -1.0pp $177 | -0.5pp $73 | base $-34 | +0.5pp $-142 | +1.0pp $-253 |
UW: 25.0% down · 7.5% · 30yr · 1.5% tax · 5.0% vac · 8.0% maint · 8.0% mgmt
Financing live
Cash to close
- Down payment
- $104,750
- Closing costs
- $12,570
- Reserves months
- —
- Total cash needed
- —
Loan-product check · same deal, 3 products live
Conventional
25% down · 7.5% · 30yr
- Down + closing
- —
- Monthly P&I
- —
- Monthly cashflow
- —
- DSCR
- —
- Eligible?
- —
Personal DTI + credit; lowest rate.
DSCR
20% down · 8.5% · 30yr
- Down + closing
- —
- Monthly P&I
- —
- Monthly cashflow
- —
- DSCR
- —
- Eligible?
- —
No personal income docs; deal must DSCR.
Hard money
10% down · 12.0% · 12mo
- Down + closing
- —
- Monthly P&I
- —
- Monthly cashflow
- —
- DSCR
- —
- Eligible?
- —
Short-term bridge; refi at stabilization.
Rent comps 10 comps
| Address | Beds | Baths | Sqft | Rent | $/sqft | DOM | Units | Dist |
|---|---|---|---|---|---|---|---|---|
| 1859 Maryland Blvd Birmingham, MI | 3.0 | 2.0 | 2247 | $3,500 | $1.56 | 14d | 1 | 0.26mi |
| 15859 Buckingham Ave Beverly Hills, MI | 4.0 | 1.5 | 2192 | $2,850 | $1.30 | 0d | 1 | 0.51mi |
| 615 Davis Ave Birmingham, MI | 3.0 | 2.5 | 2168 | $3,700 | $1.71 | 7d | 1 | 0.62mi |
| 115 E Lincoln St Birmingham, MI | 3.0 | 3.0 | 1637 | $4,200 | $2.57 | 26d | 1 | 0.74mi |
| 1109 Bennaville Ave Birmingham, MI | 3.0 | 2.5 | 2786 | $7,000 | $2.51 | 12d | 1 | 0.86mi |
| 30300 Southfield Rd Southfield, MI | 1.0–3.0 | 1.0–2.5 | 1450 | $2,150 | $1.48 | 1d | 1 | 1.01mi |
| 707 S Worth St Birmingham, MI | 1.0–2.0 | 1.0–2.0 | 1290 | $6,900 | $5.35 | 0d | 21 | 1.11mi |
| 4307 Cooper Ave Royal Oak, MI | 3.0 | 2.0 | 1679 | $2,550 | $1.52 | 20d | 1 | 1.25mi |
| 111 Willits St #305 Birmingham, MI | 2.0 | 2.5 | 1698 | $6,750 | $3.98 | 26d | 1 | 1.27mi |
| 3902 Springer Ave Royal Oak, MI | 4.0 | 2.5 | 2225 | $2,800 | $1.26 | 17d | 1 | 1.31mi |
Listing history 10 events
-
2026-06-21days on market $419,000 Active 17 DOM
-
2026-06-18days on market $419,000 Active 14 DOM
-
2026-06-17days on market $419,000 Active 13 DOM
-
2026-06-16days on market $419,000 Active 12 DOM
-
2026-06-15days on market $419,000 Active 11 DOM
-
2026-06-13days on market $419,000 Active 9 DOM
-
2026-06-09days on market $419,000 Active 5 DOM
-
2026-06-08days on market $419,000 Active 4 DOM
-
2026-06-07remarks 688-char remark
-
2026-06-07$419,000 Active 3 DOM
ⓘ Source: listings_history table (triggers on properties + properties_extension) + one-shot
backfill from property_details.listing_events for pre-trigger history.
Tax reassessment forecast MI · Partial reset (capped growth)
- Current annual tax
- $6,586 · $549/mo
- Projected year-2 tax
- $6,586 · $549/mo
- Expected delta
- $0/yr ($0/mo · 0.0%)
ⓘ Screening estimate from a state-policy table — verify with the county assessor before closing.
Climate risk First Street
- Flood 1/10 Low FEMA zone X (unshaded) · 0% chance over 30 yrs
- Wildfire 1/10 Low
- Heat 2/10 Low 7 d/yr ≥97°F today · 15 d/yr by 30 yrs out
- Wind 2/10 Low
- Air quality 4/10 Moderate 3 unhealthy d/yr today · 6 by 30 yrs out
Nearby sold comps map
Loading sold comps map…
Walkable amenities ~0.75 mi
Loading nearby amenities…
Taxation est. · year 1
- Rental income
- $43,854
- − Mortgage interest
- −$23,471
- − Property taxes
- −$6,586
- − Insurance
- −$2,095
- − Repairs & maintenance
- −$3,508
- − Management
- −$3,508
- − Depreciation
- −$12,189
- Taxable loss
- −$7,503
- Est. tax savings @ 24.0%
- +$1,801
- After-tax cash flow
- $1,397/yr
For passive investors: Depreciation is non-cash, so a rental often shows a tax loss while cash-flowing — sheltering income. Rental losses are passive: they offset passive income freely, and up to $25,000/yr can offset ordinary (W-2) income if you actively participate and your MAGI is under $100k (phasing out to $0 by $150k); unused losses carry forward. On sale, claimed depreciation is recaptured at up to 25%, and gains may owe capital-gains tax (a 1031 exchange can defer both). Figures are a year-1 estimate at your 24.0% rate — not tax advice; consult a CPA.
Schools (NCES district)
- District
- Birmingham Public Schools
- NCES district ID
- 2605850
- Math proficiency
- 58% ▼ -8.00%
- Reading proficiency
- 71% ▼ -3.00%
- Median HH income
- $110,445
- Composite
- 60.54/100
- National rank
- #839
- State rank
- #18 of 540 in MI
Livability — Beverly Hills
- Score
- 84/100
- State rank
- #38
- US rank
- #791
Category grades
Schools grade is shown separately in the Schools card above.
Census & demographics
- Census place
- Beverly Hills, MI
- City population
- 14,755
- Population (ZIP)
- 14,755
Population outlook (Oakland County) Hauer SSP2
- Today (2025)
- 1,335,747 people
- By 2030
- 1,375,100 · +2.9%
- By 2040
- 1,435,385 · +7.5%
- By 2050
- 1,469,250 · +10.0%
- By 2075
- 1,531,946 · +14.7%
- By 2100
- 1,450,485 · +8.6%
Race, ethnicity, and origin ACS 2023
- Neighborhood character
- Predominantly White (79%)
- Race & ethnicity
- White 79% Black 8% Two or more races 7% Asian 4% Hispanic / Latino 4%
- Common ancestry
- Romanian 11% Lithuanian 4% Italian 4%
- Foreign-born
- 9% · Canada, China
- Languages at home
- 91% English-only · Other Indo-European 2% Chinese 2% French/Haitian/Cajun 1%
Political lean MEDSL · Oakland
- 2024 margin
- D (+10.6) · D 54.4% · R 43.8% · Other 1.9%
- 2008→2024 swing
- -3.9pp toward R · 2008: 14.5pp · 2024: 10.6pp
- All cycles
- 2024: D+10.6 2020: D+14.1 2016: D+8.1 2012: D+8.1 2008: D+14.5
Not yet ingested
- Civics
- —
Market trends
- HPI YoY
- ▼ -324.65%
- Current HPI
- 193.4455
- Rent YoY
- —
- Metro
- —
- State GDP YoY
- ▲ 1.37%
- F500 in state
- 28
Industry mix (Fortune 500 HQ in MI)
| Industry | F500 HQs | Revenue |
|---|---|---|
| Automotive Parts | 3 | $48B |
|
||
| Automotive | 2 | $372B |
|
||
| Chemicals | 1 | $45B |
|
||
| Automotive Retail | 1 | $29B |
|
||
| Healthcare / Medical Devices | 1 | $23B |
|
||
| Automotive Technology | 1 | $20B |
|
||
Price history
+507.2% since first listed11 events — show timeline
- 2026-06-01 Listed $419,000 MiRealSource-MiMLS
- 2026-06-01 Listed $419,000 REALCOMP
- 2020-05-05 Listing Removed — REALCOMP
- 2020-03-13 Pending — REALCOMP
- 2020-03-09 Listing Removed — REALCOMP
- 2020-01-27 Pending — MiRealSource-MiMLS
- 2020-01-27 Pending — REALCOMP
- 2020-01-27 Listing Removed — MiRealSource-MiMLS
- 2020-01-22 Listed $300,000 MiRealSource-MiMLS
- 2020-01-22 Listed $300,000 REALCOMP
- 1978-07-01 Sold (Public Records) $69,000 Public Records
Property tax history
+4.1%/yrLatest (2025): $6,586 · +2.3% YoY. Source: county tax records.
Cash-flow waterfall
monthlySold comps — $/sqft
last 12 mo · ≤1 miLoading sold comps…