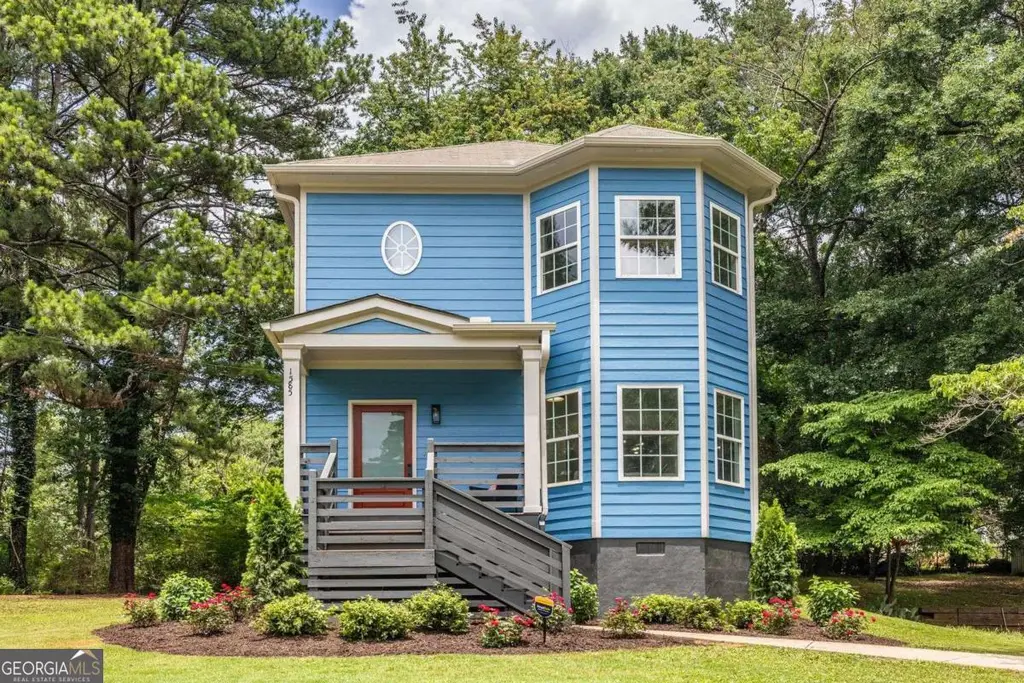
1585 Mary George Ave NW · Atlanta, GA
Flood risk 1/10 · Minimal
- FEMA flood zone
- X (unshaded)
- Chance of flooding over 30 yrs
- 0.0%
- Est. flood insurance / yr
- $507 – $1,088
Fire risk 3/10 · Minor
- Est. fire insurance / yr
- $963 – $1,789
Heat risk 5/10 · Moderate
- Hot days now (above 104°F)
- 6 days/yr
- Hot days in 30 yrs
- 15 days/yr
Wind risk 5/10 · Moderate
- Chance of severe wind over 30 yrs
- 25.0%
Air-quality risk 4/10 · Minor
- Unhealthy air days now
- 3 days/yr
- Unhealthy air days in 30 yrs
- 5 days/yr
Risk factors via First Street. Map © Google.
Why this score? — see what drove the D+ grade
The composite is a weighted blend of 9 inputs, each scored 0–100. Each bar is that input's sub-score; the figure is the points it added to the 100-point composite (weight × sub-score).
- ARV discount +15.0/15.0
- Cash flow +13.6/30.0
- Livability +4.2/5.0
- DSCR +4.1/10.0
- Rent growth +3.3/5.0
- 1% rule +3.1/10.0
- Schools +2.7/10.0
- Condition / age +2.5/5.0
- Appreciation +0.0/10.0
$359,900
🖨 Deal sheet (PDF) 📄 Offer letter ✓ Due diligence
Listing remarks MLS
Prime Location meets Total Transformation in West Midtown Corridor Investors and savvy homebuyers take note: this property boasts a proven track record as a long-term income producer and has been completely renovated for its next chapter. Situated in Atlanta's booming 30318 area, the location offers incredible logistical advantages. Enjoy immediate proximity to the Upper Westside's multi-use developments, West Midtown entertainment, and major transit loops (I-75/I-85/I-285). Natural amenities like Westside Park and the expanding Proctor Creek Greenway add massive long-term value. The home itself features an optimized 4-bedroom, 3-bathroom footprint. A welcoming covered porch and landscaped walkway lead into a bright, high-ceilinged main level fitted with new, flooring. The kitchen has been elevated with high-end finishes, including quartz countertops, two-tone cabinetry, gold gooseneck hardware, and a new premium appliance package. The floor plan easily accommodates roommates, guests, or remote work setups. The oversized primary suite features premium new carpeting and a distinct architectural bay window area for tons of natural light. With fresh paint and upgraded fixtures from top to bottom, this turnkey property is primed for immediate occupancy or immediate cash flow.
Key facts
- 9,239 sq ft lot
- 4 parking spots
- Built 2007
Property features AI
Finance
- HOA & community: Near public transport; Near schools; Near shopping; Near trails/greenway; Street lights
Exterior
- Parking: Parking pad; Four total parking spaces
- Utilities: Public water; Public sewer; 110V electric service; 220V in laundry; Cable available; Electricity available; Natural gas available; Phone available; Underground utilities; Water available; Sewer available
- Home design: Two levels; Resale property; Frame construction; Composition roof; Pillar/post/pier foundation
- Construction: Frame construction; Composition roof; Pillar/post/pier foundation
- Exterior features: Covered patio/porch; Deck; Front porch; Rear porch; City street frontage; Asphalt road
Interior
- Kitchen: White and other-style cabinets; Stone countertops; Open sight line to family room; Dishwasher; Electric range; Microwave
- Bedrooms: One main-level bedroom; Three upper-level bedrooms; Oversized master bedroom
- Flooring: Carpet; Luxury vinyl
- Bathrooms: Three full bathrooms; One main-level bathroom; Two full bathrooms on upper level; Master bath with tub/shower combo
- Heating & cooling: Central air conditioning; Forced air heating; Natural gas heating
- Interior features: 9-ft ceilings on main and upper levels; High speed internet available; Walk-in closets; Bay windows; No common walls; Attic; Crawl space basement
- Laundry & utility: Main-level laundry room; 220V outlet in laundry
Neighborhood map
What this means for you Summary
Snapshot
- This is a 4-bed/3.0-bath single-family listed at $360k.
Deal economics
- At list price, monthly cash flow is $18 ($210/yr) — positive.
- The deal already cash-flows at list — no discount required.
- To meet the 1% rule (rent ≥ 1% of price), the offer needs to be $290k (19.3% below list).
- Recommended offer: $290k (19.3% below list) — sets the bar for 1% rule.
- Cap rate 6.4% vs local median 3.1% in Atlanta — top-decile yield for the area; either an underpriced asset or a hidden risk that comps aren't pricing in. Stress-test before assuming the spread holds.
Location & tenants
- Location reads 83/100 on livability (#6 in GA, #919 nationally) — a professional / high-income tenant draw. Strengths: amenities A+, commute A+, housing A+; Watch: cost of living C-.
- Atlanta Public Schools (urban): math 28% / reading 35% proficiency, ranked #80 of 174 in GA (top 46%) — families likely to look elsewhere, expect single-tenant / working-renter base with shorter leases; 71% free/reduced lunch — lower-income household profile, screen leases tightly.
- Zoned schools: William J. Scott Elementary School (math 5% / reading 5%, grade F, #1,160 of 1,228 statewide, top 98%, 289 students, 100% FRL); John Lewis Invictus Academy (math 2% / reading 2%, grade F, #470 of 470 statewide, top 100%, 825 students, 100% FRL); Frederick Douglass High School (math 24%, 1,112 students, 100% FRL) — zoned schools average 100% FRL vs 71% district-wide (29 pts higher); higher-poverty schools than district average — tighter screening recommended.
- Zoned-school proficiency averages 4% at this address vs 32% district-wide (-28 pts) — the specific schools serving this property underperform the Atlanta Public Schools average; the district grade overstates school quality for this exact location.
- Market conditions: Rents rising (+3.3%/yr); 732 active listings in the ZIP; 40 comparable units currently listed for rent nearby; rentals leasing fast (median 10d on market — plan ~1-2 weeks tenant-placement turnaround); solid renter incomes; 11,565 units permitted in Fulton County in 2024 (8,159 in 5+ unit buildings).
- This rent runs 42% of the median local income ($83k/yr) — at the standard rent-burdened threshold; future hikes will face affordability resistance.
Forward outlook
- Local home prices are declining (-3.0%/yr); year-one equity from $2k of loan paydown is wiped out by about $11k of value loss. Plan a longer hold.
- Fulton County population projected at +38% by 2050 — long-run rental-demand tailwind backs the buy-and-hold thesis.
Negotiation context
- Only 13 days on market — expect competitive offers; lowballing is unlikely to land.
- 3 sale attempts since 3y ago with the ask held roughly flat each time — persistent listings suggest the price (not the market) is what's stuck; bring a comps-based counter.
- Current owner paid $280k; 29% above their basis — modest negotiation headroom, anchor on the comps not their cost.
Risks & watch-outs
- Climate carrying-cost: moderate wind risk, 25% chance of damaging wind over 30y; extreme-heat days projected 6→15/yr by 2055 (HVAC capex compounding) — expect insurance premiums to compound above CPI over the hold.
Questions for the listing agent
- Is there a deadline driving the sale (1031 exchange, divorce, estate, relocation)? That informs how much negotiation room exists.
- The area grade is low — what's the realistic commute time and amenity access for the typical tenant pool here? Any planned neighborhood developments (good or bad) we should know about?
- What's the average days-on-market for RENTAL listings here right now (not sales)? A rising rental-DOM trend means longer vacancies and softer asking-rent achievability than the comps imply.
- What's the recent tenant-quality profile in this submarket — average credit score on applications, eviction rate, late-payment / NSF rate, and stable-employment percentage? A property-management company in the area should have these aggregated.
- How much new for-sale + rental construction is in the pipeline within 1–3 miles? Heavy new supply typically softens prices + rents 12–24 months out; constrained supply supports both.
Investment metrics
- 1% rule
- 0.81% ✗
- Cap rate
- 6.35%
- Cash-on-cash
- 0.21%
- DSCR
- 1.01
- GRM
- 10.3
CMA / ARV
- ARV (on-the-fly)
- $531,804
- Comps found
- 12
Show comp detail 12 sales within ~0.75 mi
| Address | Dist | Beds/Ba | Sqft | Sold | Price | $/sf | Match |
|---|---|---|---|---|---|---|---|
| 2405 Abner Pl NW | 0.29mi | 4/3.5 | 1,699 (-13%) | 4mo | $370,000 | $218 | 59 |
| 1580 Mary George Ave NW | 0.04mi | 5/3.0 (+1) | 2,232 (+15%) | 13mo | $280,000 | $125 | 58 |
| 2588 Abner Pl NW | 0.38mi | 3/2.0 (-1) | 1,826 (-6%) | 12mo | $485,000 | $266 | 53 |
| 1922 Perry Blvd NW | 0.64mi | 3/2.5 (-1) | 1,980 (+2%) | 11mo | $535,000 | $270 | 51 |
| 2526 Abner Pl NW | 0.40mi | 3/2.0 (-1) | 1,826 (-6%) | 13mo | $499,000 | $273 | 51 |
| 1874 Lucy Compton Ln NW | 0.60mi | 3/2.5 (-1) | 1,930 (-1%) | 15mo | $570,000 | $295 | 51 |
| 1968 Perry Blvd NW | 0.53mi | 3/2.5 (-1) | 2,034 (+4%) | 14mo | $535,000 | $263 | 49 |
| 1977 Granite Hills Rd | 0.65mi | 3/2.5 (-1) | 2,052 (+5%) | 14mo | $575,000 | $280 | 42 |
| 2006 Stanfield Ave NW | 0.60mi | 3/2.5 (-1) | 2,028 (+4%) | 19mo | $535,000 | $264 | 42 |
| 1890 Lucy Compton Ln NW | 0.62mi | 3/2.5 (-1) | 2,064 (+6%) | 20mo | $565,000 | $274 | 38 |
| 1926 Granite Peak Dr NW | 0.75mi | 3/2.5 (-1) | 1,855 (-5%) | 17mo | $574,900 | $310 | 36 |
| 1924 Granite Peak Dr | 0.73mi | 3/2.5 (-1) | 1,854 (-5%) | 19mo | $601,241 | $324 | 35 |
Match score weights: distance 35% · size 25% · config 20% · recency 20%. Top-matched comps best support the ARV.
Projected returns pro-forma
-3.0% appreciation · 3.26% rent growth · sell at horizon
- IRR
- -15.7%
- Equity multiple
- 0.44×
- Total profit
- $-56,527
- Equity at exit
- $53,662
- IRR
- -6.9%
- Equity multiple
- 0.55×
- Total profit
- $-44,991
- Equity at exit
- $31,118
Cash invested: $100,772 (down + closing). Projections, not guarantees.
Landlord ↔ Tenant lean methodology
- Overall (STATE)
- 90 Strongly Landlord-Friendly
- State Georgia
- 90 Strongly Landlord-Friendly · R+3
- County
- — inherits STATE
- City
- — inherits STATE
ZIP-level market 30318
- Rents YoY
- 3.3%
- Active inventory
- 732
- Price-to-rent
- 10.3×
Monthly cashflow live
- Estimated rent
- $2,903 high interval (Pro) →
- Mortgage (P&I)
- −$1,887
- Tax from tax record
- −$239 /mo · $2,866/yr
- Insurance
- −$150
- HOA
- −$0
- Vacancy / Maint / Mgmt
- −$610
- Net cashflow
- $18
Break-even live
Sensitivity live
| Price | -10% $221 | -5% $119 | +0% $18 | +5% $-84 | +10% $-186 |
|---|---|---|---|---|---|
| Rent | -10% $-212 | -5% $-97 | +0% $18 | +5% $132 | +10% $247 |
| Rate | -1.0pp $199 | -0.5pp $109 | base $18 | +0.5pp $-76 | +1.0pp $-171 |
UW: 25.0% down · 7.5% · 30yr · 1.5% tax · 5.0% vac · 8.0% maint · 8.0% mgmt
Financing live
Cash to close
- Down payment
- $89,975
- Closing costs
- $10,797
- Reserves months
- —
- Total cash needed
- —
Loan-product check · same deal, 3 products live
Conventional
25% down · 7.5% · 30yr
- Down + closing
- —
- Monthly P&I
- —
- Monthly cashflow
- —
- DSCR
- —
- Eligible?
- —
Personal DTI + credit; lowest rate.
DSCR
20% down · 8.5% · 30yr
- Down + closing
- —
- Monthly P&I
- —
- Monthly cashflow
- —
- DSCR
- —
- Eligible?
- —
No personal income docs; deal must DSCR.
Hard money
10% down · 12.0% · 12mo
- Down + closing
- —
- Monthly P&I
- —
- Monthly cashflow
- —
- DSCR
- —
- Eligible?
- —
Short-term bridge; refi at stabilization.
Rent comps 40 comps
| Address | Beds | Baths | Sqft | Rent | $/sqft | DOM | Units | Dist |
|---|---|---|---|---|---|---|---|---|
| 1725 Church St NW Atlanta, GA | 4.0 | 2.0 | 1274 | $2,013 | $1.58 | 0d | 1 | 0.43mi |
| 2011 Springfield Rd Atlanta, GA | 3.0 | 2.5 | 1528 | $3,000 | $1.96 | 7d | 1 | 0.62mi |
| 1763 Stone Hedge Dr NW Atlanta, GA | 3.0 | 2.5 | 2108 | $2,978 | $1.41 | 0d | 1 | 0.83mi |
| 1769 Sanford Dr NW Atlanta, GA | 3.0 | 2.5 | 2200 | $3,200 | $1.45 | 26d | 1 | 0.84mi |
| 2011 Oak Ln NW Atlanta, GA | 3.0 | 3.5 | 1848 | $3,200 | $1.73 | 19d | 1 | 0.86mi |
| 2493 Sycamore Rd NW #4 Atlanta, GA | 3.0 | 3.5 | 1848 | $3,400 | $1.84 | 9d | 1 | 0.88mi |
| 1673 Jackson Sq NW Atlanta, GA | 3.0 | 3.0 | 2088 | $2,300 | $1.10 | 0d | 1 | 0.90mi |
| 1673 Jackson Sq NW Atlanta, GA | 3.0 | 3.0 | 2088 | $2,300 | $1.10 | 9d | 1 | 0.90mi |
| 1647 Bridgeport Dr NW Atlanta, GA | 4.0 | 2.0 | 1250 | $2,100 | $1.68 | 5d | 1 | 0.91mi |
| 1445 Creekside Cir NW Atlanta, GA | 4.0 | 3.5 | 2425 | $6,500 | $2.68 | 7d | 1 | 1.02mi |
| 1445 Creekside Cir NW Atlanta, GA | 4.0 | 3.5 | 2425 | $6,500 | $2.68 | 6d | 1 | 1.02mi |
| 2711 Stream Valley Ln NW Atlanta, GA | 4.0 | 3.5 | 2445 | $3,200 | $1.31 | 9d | 1 | 1.02mi |
| 1359 Creek View Ln NW Atlanta, GA | 3.0 | 2.5 | 2129 | $3,000 | $1.41 | 26d | 1 | 1.05mi |
| 903 Proctor Ranch Dr Unit 903 Atlanta, GA | 4.0 | 3.5 | 2470 | $2,800 | $1.13 | 14d | 1 | 1.06mi |
| 2456 Spring St NW Apt A Atlanta, GA | 4.0 | 2.5 | 1650 | $1,450 | $0.88 | 26d | 1 | 1.10mi |
| 1910 La Dawn Ln NW Atlanta, GA | 3.0 | 1.0 | 1247 | $2,200 | $1.76 | 26d | 1 | 1.11mi |
| 1910 La Dawn Ln NW Atlanta, GA | 3.0 | 1.0 | 1247 | $2,200 | $1.76 | 0d | 1 | 1.11mi |
| 2676 Creek View Ter NW Atlanta, GA | 3.0 | 2.5 | 2383 | $3,100 | $1.30 | 6d | 1 | 1.11mi |
| 2713 Creek View Ter NW Atlanta, GA | 4.0 | 3.5 | 2129 | $2,999 | $1.41 | 9d | 1 | 1.12mi |
| 1127 2nd NW Atlanta, GA | 4.0 | 2.5 | 2000 | $3,240 | $1.62 | 16d | 1 | 1.19mi |
| 1127 2nd NW Atlanta, GA | 4.0 | 2.5 | 2000 | $3,240 | $1.62 | 26d | 1 | 1.19mi |
| 1955 East Ave NW Unit A Atlanta, GA | 4.0 | 3.0 | 1800 | $1,990 | $1.11 | 16d | 1 | 1.20mi |
| 1080 Gun Club Rd NW Atlanta, GA | 5.0 | 3.0 | 2418 | $2,378 | $0.98 | 0d | 1 | 1.22mi |
| 2045 Lois Pl NW Unit A Atlanta, GA | 5.0 | 3.0 | 1344 | $3,450 | $2.57 | 20d | 1 | 1.22mi |
| 1315 Northwest Dr NW Atlanta, GA | 3.0 | 1.0–2.0 | 908 | $2,415 | $2.66 | 0d | 34 | 1.25mi |
| 2367 Summit Ave NW Atlanta, GA | 4.0 | 2.5 | 1887 | $2,800 | $1.48 | 3d | 1 | 1.27mi |
| 38 Hollywood Dr NW Atlanta, GA | 4.0 | 2.0 | 1400 | $2,200 | $1.57 | 26d | 1 | 1.32mi |
| 2265 Marietta Blvd NW Atlanta, GA | 3.0 | 1.0–2.0 | 1018 | $2,585 | $2.54 | 0d | 28 | 1.36mi |
| 2048 Holtz Ln Atlanta, GA | 3.0 | 3.5 | 2068 | $3,650 | $1.76 | 0d | 1 | 1.38mi |
| 2048 Holtz Ln Atlanta, GA | 3.0 | 3.5 | 2068 | $3,850 | $1.86 | 26d | 1 | 1.38mi |
| 2200 Marietta Blvd NW Atlanta, GA | 3.0 | 1.0–3.0 | 1112 | $3,396 | $3.05 | 3d | 243 | 1.38mi |
| 1740 Bolton Rd NW Atlanta, GA | 3.0 | 3.0 | 2208 | $2,900 | $1.31 | 26d | 1 | 1.39mi |
| 1409 Northwest Dr NW Unit 1 Atlanta, GA | 4.0 | 2.5 | 2500 | $2,599 | $1.04 | 4d | 1 | 1.41mi |
| 1409 Northwest Dr NW Atlanta, GA | 4.0 | 2.5 | 2000 | $2,998 | $1.50 | 26d | 1 | 1.41mi |
| 1120 Wedgewood Dr NW Atlanta, GA | 4.0 | 2.5 | 1904 | $3,100 | $1.63 | 9d | 1 | 1.42mi |
| 991 Ada Ave NW Atlanta, GA | 4.0 | 2.0 | 1458 | $2,450 | $1.68 | 26d | 1 | 1.42mi |
| 1026 Sims Ave NW Unit B Atlanta, GA | 4.0 | 3.0 | 1492 | $2,842 | $1.90 | 26d | 1 | 1.42mi |
| 960 N Grand Ave NW Atlanta, GA | 3.0 | 2.5 | 1510 | $1,950 | $1.29 | 26d | 1 | 1.43mi |
| 1400 Northwest Dr NW Unit A Atlanta, GA | 3.0 | 2.0 | 1228 | $2,600 | $2.12 | 26d | 1 | 1.44mi |
| 1632 Gunnin Trce NW Atlanta, GA | 3.0 | 2.5 | 1408 | $2,800 | $1.99 | 21d | 1 | 1.45mi |
Listing history 10 events
-
2026-06-18status $359,900 Pending 13 DOM
-
2026-06-17days on market $359,900 Active Under Contract 13 DOM
-
2026-06-16days on market $359,900 Active Under Contract 12 DOM
-
2026-06-15days on market $359,900 Active Under Contract 11 DOM
-
2026-06-13days on market $359,900 Active Under Contract 9 DOM
-
2026-06-13statusdays on market $359,900 Active Under Contract 8 DOM
-
2026-06-09days on market $359,900 Active 5 DOM
-
2026-06-08days on market $359,900 Active 4 DOM
-
2026-06-07remarks 699-char remark
-
2026-06-07$359,900 Active 3 DOM
ⓘ Source: listings_history table (triggers on properties + properties_extension) + one-shot
backfill from property_details.listing_events for pre-trigger history.
Tax reassessment forecast GA · Resets to sale price
- Current annual tax
- $2,866 · $239/mo
- Projected year-2 tax
- $3,311 · $276/mo
- Expected delta
- +$445/yr (+$37/mo · 15.5%)
ⓘ Screening estimate from a state-policy table — verify with the county assessor before closing.
Climate risk First Street
- Flood 1/10 Low FEMA zone X (unshaded) · 0% chance over 30 yrs
- Wildfire 3/10 Moderate
- Heat 5/10 Major 6 d/yr ≥104°F today · 15 d/yr by 30 yrs out
- Wind 5/10 Major 25% chance of damaging wind over 30 yrs
- Air quality 4/10 Moderate 3 unhealthy d/yr today · 5 by 30 yrs out
Nearby sold comps map
Loading sold comps map…
Walkable amenities ~0.75 mi
Loading nearby amenities…
Taxation est. · year 1
- Rental income
- $34,841
- − Mortgage interest
- −$20,160
- − Property taxes
- −$2,866
- − Insurance
- −$1,800
- − Repairs & maintenance
- −$2,787
- − Management
- −$2,787
- − Depreciation
- −$10,470
- Taxable loss
- −$6,029
- Est. tax savings @ 24.0%
- +$1,447
- After-tax cash flow
- $1,657/yr
For passive investors: Depreciation is non-cash, so a rental often shows a tax loss while cash-flowing — sheltering income. Rental losses are passive: they offset passive income freely, and up to $25,000/yr can offset ordinary (W-2) income if you actively participate and your MAGI is under $100k (phasing out to $0 by $150k); unused losses carry forward. On sale, claimed depreciation is recaptured at up to 25%, and gains may owe capital-gains tax (a 1031 exchange can defer both). Figures are a year-1 estimate at your 24.0% rate — not tax advice; consult a CPA.
Schools (NCES district)
- District
- Atlanta Public Schools
- NCES district ID
- 1300120
- Math proficiency
- 28% ▼ -6.00%
- Reading proficiency
- 35% ▼ -2.00%
- Median HH income
- $48,306
- Composite
- 27.27/100
- National rank
- #7006
- State rank
- #80 of 174 in GA
Livability — Atlanta
- Score
- 83/100
- State rank
- #6
- US rank
- #919
Category grades
Schools grade is shown separately in the Schools card above.
Census & demographics
- Census place
- Atlanta, GA
- County
- Fulton County · 1,094,430 people
- City population
- 629,525
- Metro
- Atlanta-Sandy Springs-Alpharetta, GA
- Population (ZIP)
- 59,609
- Household income
- $83,116
- Rent vs Own
- Severe rent burden
- 4182.0
Population outlook (Fulton County) Hauer SSP2
- Today (2025)
- 1,203,707 people
- By 2030
- 1,299,706 · +8.0%
- By 2040
- 1,488,256 · +23.6%
- By 2050
- 1,664,580 · +38.3%
- By 2075
- 2,036,072 · +69.2%
- By 2100
- 2,222,402 · +84.6%
Race, ethnicity, and origin ACS 2023
- Neighborhood character
- Diverse neighborhood (Simpson 0.63)
- Race & ethnicity
- Black 49% White 35% Hispanic / Latino 7% Two or more races 6% Asian 5%
- Hispanic origin (detail)
- Mexican 2% Puerto Rican 1%
- Common ancestry
- Lithuanian 2% Slovak 2% Romanian 1%
- Foreign-born
- 8% · Canada, China, South Korea
- Languages at home
- 88% English-only · Spanish 4% Other Indo-European 2% Other Asian/Pacific 1%
Political lean MEDSL · Fulton
- 2024 margin
- Solid D (+44.9) · D 71.9% · R 27.0% · Other 1.1%
- 2008→2024 swing
- +9.8pp toward D · 2008: 35.0pp · 2024: 44.9pp
- All cycles
- 2024: D+44.9 2020: D+46.4 2016: D+42.1 2012: D+29.6 2008: D+35.0
Not yet ingested
- Civics
- —
Market trends
- HPI YoY
- ▼ -470.82%
- Current HPI
- 224.1493
- Rent YoY
- ▲ 3.26%
- Metro
- Atlanta-Sandy Springs-Alpharetta, GA
- State GDP YoY
- ▲ 2.66%
- F500 in state
- 28
Industry mix (Fortune 500 HQ in GA)
| Industry | F500 HQs | Revenue |
|---|---|---|
| Paper / Packaging | 2 | $29B |
|
||
| Retail | 1 | $160B |
|
||
| Transportation / Logistics | 1 | $91B |
|
||
| Airlines | 1 | $62B |
|
||
| Consumer Goods | 1 | $47B |
|
||
| Utilities | 1 | $25B |
|
||
Price history
+28.5% since first listed5 events — show timeline
- 2026-06-04 Listed $359,900 FMLS
- 2026-06-04 Listed $359,900 GAMLS
- 2023-12-15 Listing Removed — GAMLS
- 2023-09-13 Listed $349,000 GAMLS
- 2007-09-06 Sold (Public Records) $280,000 Public Records
Property tax history
+0.5%/yrLatest (2024): $2,866 · -0.0% YoY. Source: county tax records.
Cash-flow waterfall
monthlySold comps — $/sqft
last 12 mo · ≤1 miLoading sold comps…