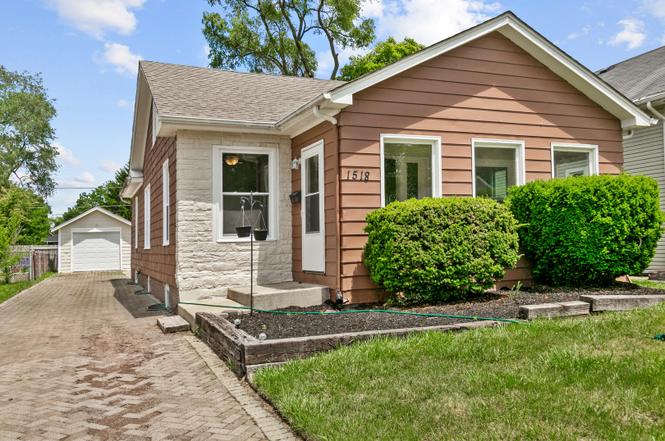
1518 Melrose Ave · Waukegan, IL
Flood risk 1/10 · Minimal
- FEMA flood zone
- X (unshaded)
- Chance of flooding over 30 yrs
- 0.0%
- Est. flood insurance / yr
- $473 – $860
Fire risk 1/10 · Minimal
- Est. fire insurance / yr
- $804 – $1,492
Heat risk 2/10 · Minimal
- Hot days now (above 97°F)
- 7 days/yr
- Hot days in 30 yrs
- 14 days/yr
Wind risk 2/10 · Minimal
- Chance of severe wind over 30 yrs
- —
Air-quality risk 3/10 · Minor
- Unhealthy air days now
- 2 days/yr
- Unhealthy air days in 30 yrs
- 3 days/yr
Risk factors via First Street. Map © Google.
Why this score? — see what drove the D- grade
The composite is a weighted blend of 9 inputs, each scored 0–100. Each bar is that input's sub-score; the figure is the points it added to the 100-point composite (weight × sub-score).
- Cash flow +15.7/30.0
- DSCR +4.8/10.0
- 1% rule +4.3/10.0
- Livability +3.8/5.0
- Rent growth +3.3/5.0
- Condition / age +2.5/5.0
- Schools +0.8/10.0
- ARV discount +0.0/15.0
- Appreciation +0.0/10.0
$299,900
🖨 Deal sheet 📄 Offer letter ✓ Due diligence
Listing remarks
* * * Multiple offers received. Seller is asking for Highest & Best offers by 6pm on Sunday, June 14. Appraisal Gap Coverage would be helpful * * * Recently rehabbed 4 bedroom & 2 bathroom with 1-car detached garage. 3 bedrooms & 1 bathroom on main floor. Living room, dining room, & all 3 bedrooms with hardwood floors. Full finished basement with a family room, rec room, 4th bedroom, & 2nd full bathroom. Enclosed front porch. Large fenced back yard. Come visit your new home today!!
Key facts
- Hardwood floors
- Enclosed front porch
- Garage
Tags
Property features AI
Finance
- Other: Ownership is fee simple; Not currently leased
- HOA & community: No master association fee required
Exterior
- Parking: Detached garage (garage owned) with brick driveway; Total of 1 parking space
- Utilities: Public water; Public sewer
- Home design: Detached single-family home; One-story layout; Rehab projects completed in 2026; Property over 100 years old
- Construction: Aluminum and vinyl siding; Asphalt roof; Finished below-grade living area
- Exterior features: Curbs, sidewalks, street lights and paved streets; Lot less than 0.25 acre
Interior
- Kitchen: Range; Microwave; Dishwasher; Refrigerator
- Bedrooms: Three bedrooms on the main level; One additional bedroom in the basement (can be used as a 4th bedroom)
- Flooring: Hardwood flooring throughout main living areas and bedrooms; Vinyl flooring in basement recreation and family rooms and basement bedroom
- Bathrooms: Two full bathrooms; Basement contains a bathroom; Separate shower
- Heating & cooling: Natural gas forced air heating; Central air conditioning
- Interior features: First-floor bedroom and first-floor full bath; Finished full basement; Nine total rooms
- Laundry & utility: In-unit laundry with gas dryer hookup and utility sink
Neighborhood map
What this means for you Summary
Snapshot
- This is a 5-bed/2.0-bath single-family listed at $300k.
Deal economics
- At list price, monthly cash flow is $131 ($2k/yr) — positive.
- The deal already cash-flows at list — no discount required.
- To meet the 1% rule (rent ≥ 1% of price), the offer needs to be $279k (7.0% below list).
- Recommended offer: $279k (7.0% below list) — sets the bar for 1% rule.
- Cap rate 6.8% vs local median 4.6% in Waukegan — top-decile yield for the area; either an underpriced asset or a hidden risk that comps aren't pricing in. Stress-test before assuming the spread holds.
Location & tenants
- Location reads 75/100 on livability (#216 in IL, #4,074 nationally) — a middle-class / working-renter tenant base. Strengths: commute A+, cost of living A+, housing A+; Watch: employment C-, crime D, schools F.
- Waukegan CUSD 60 (suburban): math 7% / reading 10% proficiency, ranked #587 of 620 in IL (top 95%) — low school quality limits family demand, transient renter base, plan for 1-2y turnover; 66% free/reduced lunch — lower-income household profile, screen leases tightly.
- Market conditions: Rents rising (+3.2%/yr); 86 active listings in the ZIP; 1 comparable units currently listed for rent nearby; 948 units permitted in Lake County in 2024 (424 in 5+ unit buildings).
- At $2,790/mo this rent would consume 50% of the median local household income ($67k/yr) (locally 2742% of renters already pay >50% of income on rent) — very limited rent-growth headroom before tenants either downsize or default.
Forward outlook
- Local home prices are declining (-3.0%/yr); year-one equity from $2k of loan paydown is wiped out by about $9k of value loss. Plan a longer hold.
- Lake County population projected to shrink 8% by 2050 — rents likely to lag national; underwrite the cash flow, not the appreciation.
Negotiation context
- Only 8 days on market — expect competitive offers; lowballing is unlikely to land.
- 2 sale attempts since 11y ago with the ask held roughly flat each time — persistent listings suggest the price (not the market) is what's stuck; bring a comps-based counter.
- Current owner paid $117k; list at $300k implies a 156% gain — meaningful room to come down on a strong offer.
Risks & watch-outs
- Watch-outs: built in 1910 — expect roof / HVAC / electrical / plumbing capex.
Questions for the listing agent
- Built in 1910 — when were the roof, HVAC, electrical panel, plumbing, and water heater last replaced?
- Is there a deadline driving the sale (1031 exchange, divorce, estate, relocation)? That informs how much negotiation room exists.
- Schools are F-rated, which usually means shorter tenancies and higher turnover. Who's the typical renter profile here, and what's been the actual vacancy rate?
- Crime grade is D in this area — have there been break-ins, vandalism, or insurance claims at this property in the last 3 years? What carrier currently insures it and at what premium?
- The area grade is low — what's the realistic commute time and amenity access for the typical tenant pool here? Any planned neighborhood developments (good or bad) we should know about?
- What's the average days-on-market for RENTAL listings here right now (not sales)? A rising rental-DOM trend means longer vacancies and softer asking-rent achievability than the comps imply.
- What's the recent tenant-quality profile in this submarket — average credit score on applications, eviction rate, late-payment / NSF rate, and stable-employment percentage? A property-management company in the area should have these aggregated.
- How much new for-sale + rental construction is in the pipeline within 1–3 miles? Heavy new supply typically softens prices + rents 12–24 months out; constrained supply supports both.
Investment metrics
- 1% rule
- 0.93% ✗
- Cap rate
- 6.82%
- Cash-on-cash
- 1.88%
- DSCR
- 1.08
- GRM
- 9.0
CMA / ARV
- ARV (on-the-fly)
- $232,794
- Comps found
- 7
Show comp detail 7 sales within ~0.75 mi
| Address | Dist | Beds/Ba | Sqft | Sold | Price | $/sf | Match |
|---|---|---|---|---|---|---|---|
| 108 S Fulton Ave | 0.16mi | 4/2.5 (-1) | 1,365 (-5%) | 15mo | $269,000 | $197 | 64 |
| 201 Dorchester Ct | 0.45mi | 4/2.0 (-1) | 1,419 (-1%) | 22mo | $222,000 | $156 | 54 |
| 1508 W Monroe St | 0.51mi | 4/2.0 (-1) | 1,444 (+0%) | 24mo | $210,000 | $145 | 51 |
| 419 S Lewis Ave | 0.32mi | 4/1.0 (-1) | 1,287 (-10%) | 16mo | $208,000 | $162 | 46 |
| 2209 Melrose Ave | 0.53mi | 4/2.0 (-1) | 1,632 (+14%) | 3mo | $265,000 | $162 | 45 |
| 616 Bluff St | 0.56mi | 4/2.0 (-1) | 1,628 (+13%) | 20mo | $265,900 | $163 | 30 |
| 524 Archer Ave | 0.59mi | 4/2.0 (-1) | 1,628 (+13%) | 21mo | $155,000 | $95 | 28 |
Match score weights: distance 35% · size 25% · config 20% · recency 20%. Top-matched comps best support the ARV.
Projected returns pro-forma
-3.0% appreciation · 3.24% rent growth · sell at horizon
- IRR
- -13.0%
- Equity multiple
- 0.53×
- Total profit
- $-39,519
- Equity at exit
- $44,716
- IRR
- -3.7%
- Equity multiple
- 0.75×
- Total profit
- $-20,692
- Equity at exit
- $25,930
Cash invested: $83,972 (down + closing). Projections, not guarantees.
Landlord ↔ Tenant lean methodology
- Overall (STATE)
- 43 Moderately Tenant-Leaning
- State Illinois
- 43 Moderately Tenant-Leaning · D+7
- County
- — inherits STATE
- City
- — inherits STATE
ZIP-level market 60085
- Rents YoY
- 3.2%
- Active inventory
- 86
- Price-to-rent
- 9.0×
Monthly cashflow live
- Estimated rent
- $2,790 medium interval (Pro) →
- Mortgage (P&I)
- −$1,573
- Tax est. 1.5%
- −$375 /mo · $4,498/yr
- Insurance
- −$125
- HOA
- −$0
- Vacancy / Maint / Mgmt
- −$586
- Net cashflow
- $131
Break-even live
UW: 25.0% down · 7.5% · 30yr · 1.5% tax · 5.0% vac · 8.0% maint · 8.0% mgmt
Financing live
Cash to close
- Down payment
- $74,975
- Closing costs
- $8,997
- Reserves months
- —
- Total cash needed
- —
Loan-product check · same deal, 3 products live
Conventional
25% down · 7.5% · 30yr
- Down + closing
- —
- Monthly P&I
- —
- Monthly cashflow
- —
- DSCR
- —
- Eligible?
- —
Personal DTI + credit; lowest rate.
DSCR
20% down · 8.5% · 30yr
- Down + closing
- —
- Monthly P&I
- —
- Monthly cashflow
- —
- DSCR
- —
- Eligible?
- —
No personal income docs; deal must DSCR.
Hard money
10% down · 12.0% · 12mo
- Down + closing
- —
- Monthly P&I
- —
- Monthly cashflow
- —
- DSCR
- —
- Eligible?
- —
Short-term bridge; refi at stabilization.
Rent comps 1 comps
| Address | Beds | Baths | Sqft | Rent | $/sqft | DOM | Units | Dist |
|---|---|---|---|---|---|---|---|---|
| 708 Keller Ave Waukegan, IL | 4.0 | 2.0 | 1800 | $4,500 | $2.50 | 1d | 1 | 1.03mi |
Listing history 6 events
-
2026-06-18days on market $299,900 Active 8 DOM
-
2026-06-17days on market $299,900 Active 7 DOM
-
2026-06-16days on market $299,900 Active 6 DOM
-
2026-06-15days on market $299,900 Active 5 DOM
-
2026-06-13remarks 503-char remark
-
2026-06-13$299,900 Active 3 DOM
ⓘ Source: listings_history table (triggers on properties + properties_extension) + one-shot
backfill from property_details.listing_events for pre-trigger history.
Climate risk First Street
- Flood 1/10 Low FEMA zone X (unshaded) · 0% chance over 30 yrs
- Wildfire 1/10 Low
- Heat 2/10 Low 7 d/yr ≥97°F today · 14 d/yr by 30 yrs out
- Wind 2/10 Low
- Air quality 3/10 Moderate 2 unhealthy d/yr today · 3 by 30 yrs out
Nearby sold comps map
Loading sold comps map…
Walkable amenities ~0.75 mi
Loading nearby amenities…
Taxation est. · year 1
- Rental income
- $33,476
- − Mortgage interest
- −$16,799
- − Property taxes
- −$4,498
- − Insurance
- −$1,500
- − Repairs & maintenance
- −$2,678
- − Management
- −$2,678
- − Depreciation
- −$8,724
- Taxable loss
- −$3,402
- Est. tax savings @ 24.0%
- +$816
- After-tax cash flow
- $2,392/yr
For passive investors: Depreciation is non-cash, so a rental often shows a tax loss while cash-flowing — sheltering income. Rental losses are passive: they offset passive income freely, and up to $25,000/yr can offset ordinary (W-2) income if you actively participate and your MAGI is under $100k (phasing out to $0 by $150k); unused losses carry forward. On sale, claimed depreciation is recaptured at up to 25%, and gains may owe capital-gains tax (a 1031 exchange can defer both). Figures are a year-1 estimate at your 24.0% rate — not tax advice; consult a CPA.
Schools (NCES district)
- District
- Waukegan CUSD 60
- NCES district ID
- 1741250
- Math proficiency
- 7% ▼ -8.00%
- Reading proficiency
- 10% ▼ -8.00%
- Median HH income
- $43,248
- Composite
- 7.73/100
- National rank
- #9939
- State rank
- #587 of 620 in IL
Livability — Waukegan
- Score
- 75/100
- State rank
- #216
- US rank
- #4074
Category grades
Schools grade is shown separately in the Schools card above.
Census & demographics
- Census place
- Waukegan, IL
- County
- Lake County · 591,991 people
- City population
- 99,634
- Metro
- Chicago-Naperville-Elgin, IL-IN-WI
- Population (ZIP)
- 72,341
- Household income
- $66,793
- Rent vs Own
- Severe rent burden
- 2742.0
Population outlook (Lake County) Hauer SSP2
- Today (2025)
- 700,217 people
- By 2030
- 693,290 · -1.0%
- By 2040
- 673,588 · -3.8%
- By 2050
- 643,556 · -8.1%
- By 2075
- 562,792 · -19.6%
- By 2100
- 457,715 · -34.6%
Race, ethnicity, and origin ACS 2023
- Neighborhood character
- Diverse neighborhood (Simpson 0.57)
- Race & ethnicity
- Hispanic / Latino 62% Two or more races 24% Black 14% White 14% Asian 6% Native American 2%
- Hispanic origin (detail)
- Mexican 51% Puerto Rican 3%
- Common ancestry
- Romanian 1% British 1% Portuguese 1%
- Foreign-born
- 34% · Canada, Jamaica
- Languages at home
- 39% English-only · Spanish 54% Tagalog/Filipino 2% Other Asian/Pacific 1%
Political lean MEDSL · Lake
- 2024 margin
- Strong D (+20.8) · D 59.7% · R 38.9% · Other 1.4%
- 2008→2024 swing
- +1.1pp toward D · 2008: 19.6pp · 2024: 20.8pp
- All cycles
- 2024: D+20.8 2020: D+24.1 2016: D+20.3 2012: D+8.1 2008: D+19.6
Not yet ingested
- Civics
- —
Market trends
- HPI YoY
- ▼ -114.04%
- Current HPI
- 203.6304
- Rent YoY
- ▲ 3.24%
- Metro
- Chicago-Naperville-Elgin, IL-IN-WI
- State GDP YoY
- ▲ 1.59%
- F500 in state
- 60
Industry mix (Fortune 500 HQ in IL)
| Industry | F500 HQs | Revenue |
|---|---|---|
| Insurance | 4 | $201B |
|
||
| Consumer Goods | 4 | $87B |
|
||
| Industrial Machinery | 3 | $64B |
|
||
| Healthcare | 2 | $55B |
|
||
| Retail / Pharmacy | 1 | $148B |
|
||
| Agriculture / Food | 1 | $86B |
|
||
Price history
+566.4% since first listed7 events — show timeline
- 2026-06-09 Listed $299,900 MRED as Distributed by MLS Grid
- 2015-07-20 Listing Removed — MRED as Distributed by MLS Grid
- 2015-06-04 Price Changed — MRED as Distributed by MLS Grid
- 2015-03-31 Listed — MRED as Distributed by MLS Grid
- 2001-07-06 Sold (Public Records) $117,000 Public Records
- 1990-05-01 Sold (Public Records) $63,900 Public Records
- 1985-07-01 Sold (Public Records) $45,000 Public Records
Property tax history
-17.5%/yrLatest (2024): $161 · -97.1% YoY. Source: county tax records.
Cash-flow waterfall
monthlySold comps — $/sqft
last 12 mo · ≤1 miLoading sold comps…