 Multi-family
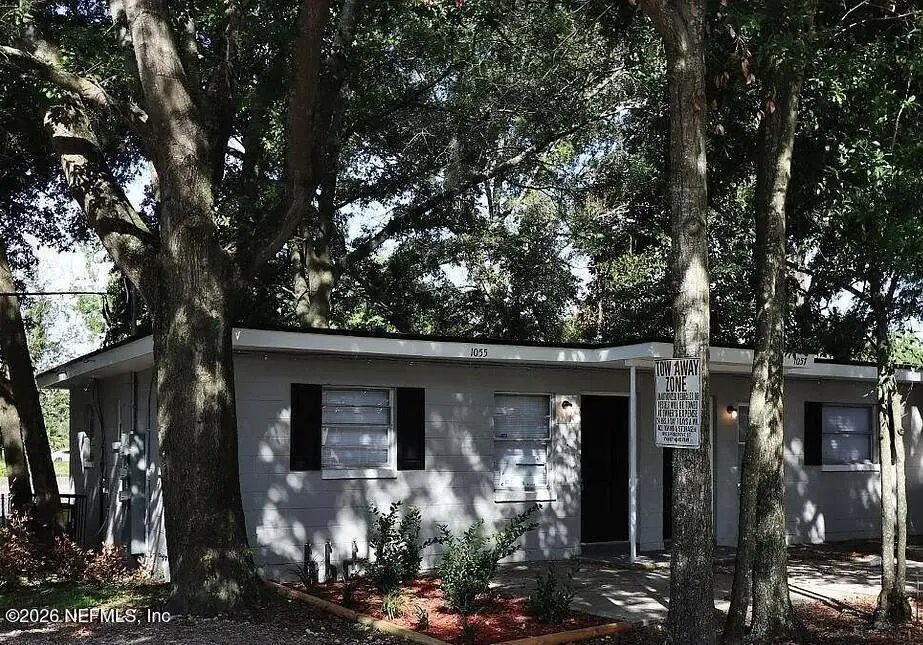
1055 Glencarin St · Jacksonville, FL
Flood risk 2/10 · Minimal
- FEMA flood zone
- X (unshaded)
- Chance of flooding over 30 yrs
- 0.05%
- Est. flood insurance / yr
- $507 – $1,088
Fire risk 1/10 · Minimal
- Est. fire insurance / yr
- $947 – $1,759
Heat risk 9/10 · Severe
- Hot days now (above 107°F)
- 7 days/yr
- Hot days in 30 yrs
- 18 days/yr
Wind risk 9/10 · Severe
- Chance of severe wind over 30 yrs
- 99.0%
Air-quality risk 4/10 · Minor
- Unhealthy air days now
- 6 days/yr
- Unhealthy air days in 30 yrs
- 6 days/yr
Risk factors via First Street. Map © Google.
Why this score? — see what drove the B grade
The composite is a weighted blend of 9 inputs, each scored 0–100. Each bar is that input's sub-score; the figure is the points it added to the 100-point composite (weight × sub-score).
- Cash flow +30.0/30.0
- 1% rule +10.0/10.0
- DSCR +10.0/10.0
- ARV discount +7.5/15.0
- Livability +4.2/5.0
- Schools +3.9/10.0
- Condition / age +2.5/5.0
- Rent growth +2.2/5.0
- Appreciation +0.0/10.0
$320,020
🖨 Deal sheet (PDF) 📄 Offer letter ✓ Due diligence
Multi-family units
County records classify this as Multi-Family (5+ Unit). Listing-text estimate: 1 unit. estimate disagrees with records
5+ unit building — per-unit beds/baths from public records are typically unavailable; the breakdown below (if shown) is an estimate from the listing text.
Listing remarks MLS
This newly renovated triplex home is move in ready! It has 6 bedrooms and 3 bathrooms with 1934 sq feet of living space and updates throughout. Call for your showing today!
Key facts
- 7,405 sq ft lot
- Built 1960
Neighborhood map
What this means for you Summary
Snapshot
- This is a 6-bed/3.0-bath multifamily listed at $320k.
Deal economics
- At list price, monthly cash flow is $4k ($43k/yr) — positive.
- The deal already cash-flows at list — no discount required.
- Meets the 1% rule at list price ($7k rent vs $320k).
- Cap rate 19.8% vs local median 3.9% in Jacksonville — top-decile yield for the area; either an underpriced asset or a hidden risk that comps aren't pricing in. Stress-test before assuming the spread holds.
Location & tenants
- Location reads 83/100 on livability (#50 in FL, #911 nationally) — a professional / high-income tenant draw. Strengths: amenities A+, commute A+, housing A+.
- Duval (urban): math 46% / reading 45% proficiency, ranked #48 of 73 in FL (top 66%) — families likely to look elsewhere, expect single-tenant / working-renter base with shorter leases.
- Zoned schools: North Shore Elementary (math 49% / reading 36%, grade F, #1,383 of 2,144 statewide, top 65%, 701 students, 86% FRL); Joseph Stilwell Middle School (math 31% / reading 33%, grade F, #448 of 571 statewide, top 79%, 612 students, 68% FRL); Andrew Jackson High School (math 30% / reading 26%, grade F, #464 of 667 statewide, top 70%, 870 students, 54% FRL) — zoned schools average 69% FRL vs 49% district-wide (20 pts higher); higher-poverty schools than district average — tighter screening recommended.
- Market conditions: Rents soft (-1.4%/yr); 294 active listings in the ZIP; 3 comparable units currently listed for rent nearby; rentals at typical pace (median 25d on market — plan ~3-4 weeks tenant-placement turnaround); lower-income renter base — watch delinquency; 6,503 units permitted in Duval County in 2024 (1,131 in 5+ unit buildings).
- At $7,229/mo this rent would consume 210% of the median local household income ($41k/yr) (locally 1765% of renters already pay >50% of income on rent) — very limited rent-growth headroom before tenants either downsize or default.
Forward outlook
- Local home prices are declining (-3.0%/yr); year-one equity from $2k of loan paydown is wiped out by about $10k of value loss. Plan a longer hold.
- Duval County population projected at +19% by 2050 — long-run rental-demand tailwind backs the buy-and-hold thesis.
- At projected returns (-3.0% appreciation + 0.0% rent growth), your $90k cash investment doubles in ~3 years — after that, you're playing with house money.
Negotiation context
- Only 1 days on market — expect competitive offers; lowballing is unlikely to land.
- 6 sale attempts since 21y ago with the ask held roughly flat each time — persistent listings suggest the price (not the market) is what's stuck; bring a comps-based counter.
Risks & watch-outs
- Climate carrying-cost: severe wind risk, 99% chance of damaging wind over 30y; extreme-heat days projected 7→18/yr by 2055 (HVAC capex compounding) — expect insurance premiums to compound above CPI over the hold.
Questions for the listing agent
- Built in 1960 — when were the roof, HVAC, electrical panel, plumbing, and water heater last replaced?
- Is there a deadline driving the sale (1031 exchange, divorce, estate, relocation)? That informs how much negotiation room exists.
- Schools are B-rated — typically a magnet for longer-tenancy family renters. What's the average tenant stay here, and is there a school-zone premium baked into asking?
- What's the average days-on-market for RENTAL listings here right now (not sales)? A rising rental-DOM trend means longer vacancies and softer asking-rent achievability than the comps imply.
- What's the recent tenant-quality profile in this submarket — average credit score on applications, eviction rate, late-payment / NSF rate, and stable-employment percentage? A property-management company in the area should have these aggregated.
- How much new apartment / multifamily construction is in the pipeline within 1–3 miles? Heavy new supply (>2% of stock underway) typically softens rents 12–24 months out; light construction supports rent growth.
Investment metrics
- 1% rule
- 2.26% ✓
- Cap rate
- 19.75%
- Cash-on-cash
- 48.06%
- DSCR
- 3.14
- GRM
- 3.7
CMA / ARV
No comps found within radius.
Projected returns pro-forma
-3.0% appreciation · 0.0% rent growth · sell at horizon
- IRR
- 42.1%
- Equity multiple
- 2.74×
- Total profit
- $155,598
- Equity at exit
- $47,716
- IRR
- 46.9%
- Equity multiple
- 4.89×
- Total profit
- $348,180
- Equity at exit
- $27,669
Cash invested: $89,606 (down + closing). Projections, not guarantees.
Landlord ↔ Tenant lean methodology
- Overall (STATE)
- 87 Strongly Landlord-Friendly
- State Florida
- 87 Strongly Landlord-Friendly · R+3
- County
- — inherits STATE
- City
- — inherits STATE
ZIP-level market 32208
- Home prices YoY
- -33.6%
- Rents YoY
- -1.4%
- Active inventory
- 294
- Price-to-rent
- 18.4×
Monthly cashflow live
- Estimated rent
- $7,229 medium interval (Pro) →
- Mortgage (P&I)
- −$1,678
- Tax from tax record
- −$310 /mo · $3,724/yr
- Insurance
- −$133
- HOA
- −$0
- Vacancy / Maint / Mgmt
- −$1,518
- Net cashflow
- $3,589
Break-even live
Sensitivity live
| Price | -10% $3,770 | -5% $3,680 | +0% $3,589 | +5% $3,498 | +10% $3,408 |
|---|---|---|---|---|---|
| Rent | -10% $3,018 | -5% $3,303 | +0% $3,589 | +5% $3,875 | +10% $4,160 |
| Rate | -1.0pp $3,750 | -0.5pp $3,670 | base $3,589 | +0.5pp $3,506 | +1.0pp $3,422 |
5-unit breakdown (identical units grouped — click to expand)
| Units | Beds | Baths | Est. rent |
|---|---|---|---|
| 5× units | 6 | 3 | $7,230 |
| #1 | 6 | 3 | $1,446 |
| #2 | 6 | 3 | $1,446 |
| #3 | 6 | 3 | $1,446 |
| #4 | 6 | 3 | $1,446 |
| #5 | 6 | 3 | $1,446 |
| Total (5 units) | $7,229 | ||
UW: 25.0% down · 7.5% · 30yr · 1.5% tax · 5.0% vac · 8.0% maint · 8.0% mgmt
Financing live
Cash to close
- Down payment
- $80,005
- Closing costs
- $9,601
- Reserves months
- —
- Total cash needed
- —
Loan-product check · same deal, 3 products live
Conventional
25% down · 7.5% · 30yr
- Down + closing
- —
- Monthly P&I
- —
- Monthly cashflow
- —
- DSCR
- —
- Eligible?
- —
Personal DTI + credit; lowest rate.
DSCR
20% down · 8.5% · 30yr
- Down + closing
- —
- Monthly P&I
- —
- Monthly cashflow
- —
- DSCR
- —
- Eligible?
- —
No personal income docs; deal must DSCR.
Hard money
10% down · 12.0% · 12mo
- Down + closing
- —
- Monthly P&I
- —
- Monthly cashflow
- —
- DSCR
- —
- Eligible?
- —
Short-term bridge; refi at stabilization.
Rent comps 3 comps
| Address | Beds | Baths | Sqft | Rent | $/sqft | DOM | Units | Dist |
|---|---|---|---|---|---|---|---|---|
| 7345 Linda Dr Jacksonville, FL | 5.0 | 2.0 | 1380 | $1,650 | $1.20 | 25d | 1 | 0.76mi |
| 1025 W 25th St Unit 1 Jacksonville, FL | 5.0 | 2.0 | 1500 | $2,000 | $1.33 | 25d | 1 | 1.19mi |
| 1029 W 25th St Unit 1 Jacksonville, FL | 5.0 | 2.0 | 1410 | $2,200 | $1.56 | 25d | 1 | 1.19mi |
Listing history 22 events
-
2026-05-01soldstatus $320,020
-
2026-04-01status Pending
-
2026-04-01$320,020 Active
-
2019-08-29soldstatus $418,800
-
2018-08-08status Pending 174-char remark
Show marketing remark (174 chars)
This newly renovated triplex home is move in ready! It has 6 bedrooms and 3 bathrooms with 1934 sq feet of living space and updates throughout. Call for your showing today!
-
2018-08-08historical 174-char remark
Show marketing remark (174 chars)
This newly renovated triplex home is move in ready! It has 6 bedrooms and 3 bathrooms with 1934 sq feet of living space and updates throughout. Call for your showing today!
-
2018-08-08$220,000 Active 174-char remark
Show marketing remark (174 chars)
This newly renovated triplex home is move in ready! It has 6 bedrooms and 3 bathrooms with 1934 sq feet of living space and updates throughout. Call for your showing today!
-
2018-04-10soldstatus $22,000 Sold 80-char remark
Show marketing remark (80 chars)
Home is being sold AS IS ...This is a short sale and must be approved by lender.
-
2018-04-02soldstatus $22,000
-
2018-02-16status Pending 80-char remark
Show marketing remark (80 chars)
Home is being sold AS IS ...This is a short sale and must be approved by lender.
-
2017-09-14historical 80-char remark
Show marketing remark (80 chars)
Home is being sold AS IS ...This is a short sale and must be approved by lender.
-
2017-09-14$15,000 80-char remark
Show marketing remark (80 chars)
Home is being sold AS IS ...This is a short sale and must be approved by lender.
-
2017-09-14historical 80-char remark
Show marketing remark (80 chars)
Home is being sold AS IS ...This is a short sale and must be approved by lender.
-
2009-10-19historical
-
2009-09-14$45,000
-
2009-04-30historical
-
2007-10-19$65,000
-
2005-05-18soldstatus $100,000
-
2005-05-02historical
-
2005-04-29soldstatus $100,000
-
2005-02-15$109,900
-
2001-02-08soldstatus $37,000
ⓘ Source: listings_history table (triggers on properties + properties_extension) + one-shot
backfill from property_details.listing_events for pre-trigger history.
Tax reassessment forecast FL · Resets to sale price
- Current annual tax
- $3,724 · $310/mo
- Projected year-2 tax
- $3,724 · $310/mo
- Expected delta
- $0/yr ($0/mo · 0.0%)
ⓘ Screening estimate from a state-policy table — verify with the county assessor before closing.
Climate risk First Street
- Flood 2/10 Low FEMA zone X (unshaded) · 5% chance over 30 yrs
- Wildfire 1/10 Low
- Heat 9/10 Extreme 7 d/yr ≥107°F today · 18 d/yr by 30 yrs out
- Wind 9/10 Extreme 99% chance of damaging wind over 30 yrs
- Air quality 4/10 Moderate 6 unhealthy d/yr today · 6 by 30 yrs out
Nearby sold comps map
Loading sold comps map…
Walkable amenities ~0.75 mi
Loading nearby amenities…
Taxation est. · year 1
- Rental income
- $86,748
- − Mortgage interest
- −$17,926
- − Property taxes
- −$3,724
- − Insurance
- −$1,600
- − Repairs & maintenance
- −$6,940
- − Management
- −$6,940
- − Depreciation
- −$9,310
- Taxable income
- $40,308
- Est. tax owed @ 24.0%
- −$9,674
- After-tax cash flow
- $33,394/yr
For passive investors: Depreciation is non-cash, so a rental often shows a tax loss while cash-flowing — sheltering income. Rental losses are passive: they offset passive income freely, and up to $25,000/yr can offset ordinary (W-2) income if you actively participate and your MAGI is under $100k (phasing out to $0 by $150k); unused losses carry forward. On sale, claimed depreciation is recaptured at up to 25%, and gains may owe capital-gains tax (a 1031 exchange can defer both). Figures are a year-1 estimate at your 24.0% rate — not tax advice; consult a CPA.
Schools (NCES district)
- District
- Duval
- NCES district ID
- 1200480
- Math proficiency
- 46% ▼ -11.00%
- Reading proficiency
- 45% ▼ -4.00%
- Median HH income
- $48,987
- Composite
- 38.97/100
- National rank
- #4076
- State rank
- #48 of 73 in FL
Livability — Jacksonville
- Score
- 83/100
- State rank
- #50
- US rank
- #911
Category grades
Schools grade is shown separately in the Schools card above.
Census & demographics
- Census place
- Jacksonville, FL
- County
- Duval County · 1,015,274 people
- City population
- 979,034
- Metro
- Jacksonville, FL
- Population (ZIP)
- 32,699
- Household income
- $41,324
- Rent vs Own
- Severe rent burden
- 1765.0
Population outlook (Duval County) Hauer SSP2
- Today (2025)
- 1,013,010 people
- By 2030
- 1,059,228 · +4.6%
- By 2040
- 1,141,439 · +12.7%
- By 2050
- 1,205,258 · +19.0%
- By 2075
- 1,324,282 · +30.7%
- By 2100
- 1,319,620 · +30.3%
Race, ethnicity, and origin ACS 2023
- Neighborhood character
- Predominantly Black (77%)
- Race & ethnicity
- Black 77% White 16% Two or more races 4% Hispanic / Latino 3%
- Common ancestry
- Italian 1%
- Foreign-born
- 2% · Canada
- Languages at home
- 97% English-only · Spanish 2%
Political lean MEDSL · Duval
- 2024 margin
- Toss-up / Even · D 48.7% · R 50.1% · Other 1.2%
- 2008→2024 swing
- +0.4pp no change · 2008: -1.9pp · 2024: -1.5pp
- All cycles
- 2024: R+1.5 2020: D+3.8 2016: R+1.5 2012: R+3.6 2008: R+1.9
Not yet ingested
- Civics
- —
Market trends
- HPI YoY
- ▼ -110.56%
- Current HPI
- 217.9706
- Rent YoY
- ▼ -1.36%
- Metro
- Jacksonville, FL
- State GDP YoY
- ▲ 3.28%
- F500 in state
- 36
Industry mix (Fortune 500 HQ in FL)
| Industry | F500 HQs | Revenue |
|---|---|---|
| Industrial Technology | 2 | $29B |
|
||
| Insurance | 2 | $17B |
|
||
| Retail | 1 | $60B |
|
||
| Technology Distribution | 1 | $58B |
|
||
| Homebuilding | 1 | $35B |
|
||
| Technology Manufacturing | 1 | $35B |
|
||
Price history
+764.9% since first listed22 events — show timeline
- 2026-05-01 Sold (Public Records) $320,020 Public Records
- 2026-04-01 Pending — realMLS
- 2026-04-01 Listed $320,020 realMLS
- 2019-08-29 Sold (Public Records) $418,800 Public Records
- 2018-08-08 Pending — realMLS
- 2018-08-08 Listed $220,000 realMLS
- 2018-08-08 Listing Removed — realMLS
- 2018-04-10 Sold (MLS) $22,000 realMLS
- 2018-04-02 Sold (Public Records) $22,000 Public Records
- 2018-02-16 Pending — realMLS
- 2017-09-14 Listing Removed — realMLS
- 2017-09-14 Listed $15,000 realMLS
- 2017-09-14 Listing Removed — realMLS
- 2009-10-19 Listing Removed — realMLS
- 2009-09-14 Listed $45,000 realMLS
- 2009-04-30 Listing Removed — realMLS
- 2007-10-19 Listed $65,000 realMLS
- 2005-05-18 Sold (Public Records) $100,000 Public Records
- 2005-05-02 Listing Removed — realMLS
- 2005-04-29 Sold (MLS) $100,000 realMLS
- 2005-02-15 Listed $109,900 realMLS
- 2001-02-08 Sold (Public Records) $37,000 Public Records
Property tax history
+8.7%/yrLatest (2025): $3,724 · +14.8% YoY. Source: county tax records.
Cash-flow waterfall
monthlySold comps — $/sqft
last 12 mo · ≤1 miLoading sold comps…