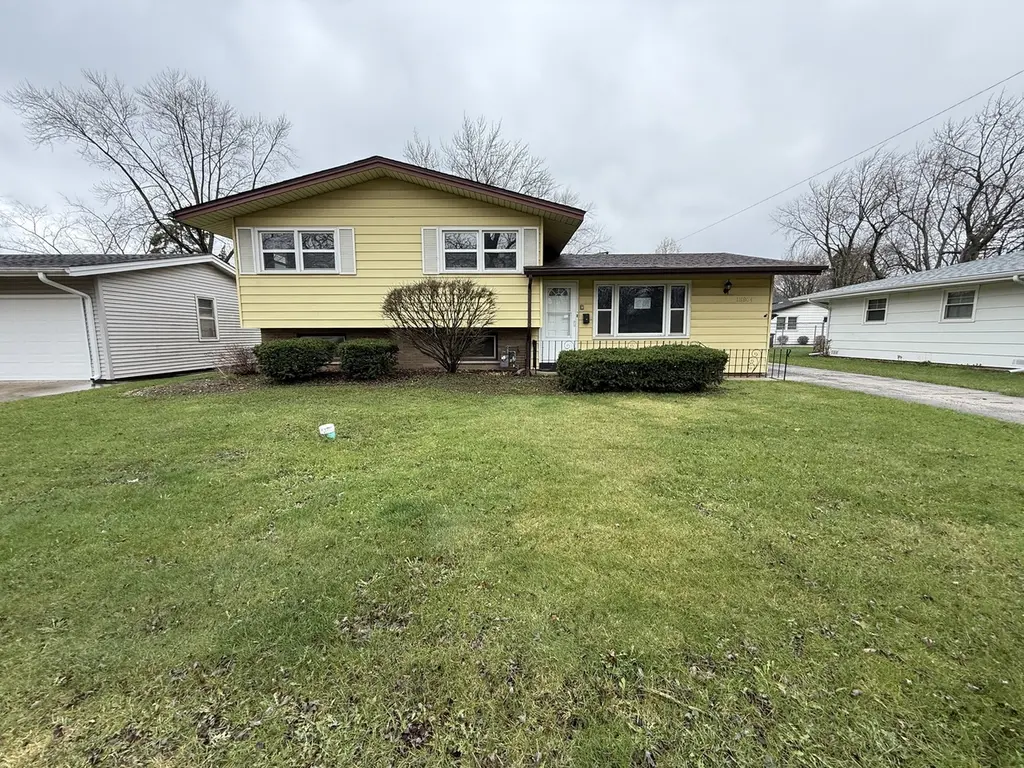
18864 Greenbay Ave · Lansing, IL
Flood risk 4/10 · Minor
- FEMA flood zone
- X (unshaded)
- Chance of flooding over 30 yrs
- 0.22%
- Est. flood insurance / yr
- $507 – $1,088
Fire risk 1/10 · Minimal
- Est. fire insurance / yr
- $804 – $1,492
Heat risk 3/10 · Minor
- Hot days now (above 102°F)
- 7 days/yr
- Hot days in 30 yrs
- 15 days/yr
Wind risk 2/10 · Minimal
- Chance of severe wind over 30 yrs
- 0.0%
Air-quality risk 4/10 · Minor
- Unhealthy air days now
- 5 days/yr
- Unhealthy air days in 30 yrs
- 6 days/yr
Risk factors via First Street. Map © Google.
Why this score? — see what drove the D+ grade
The composite is a weighted blend of 9 inputs, each scored 0–100. Each bar is that input's sub-score; the figure is the points it added to the 100-point composite (weight × sub-score).
- ARV discount +15.0/15.0
- Cash flow +12.8/30.0
- 1% rule +6.5/10.0
- DSCR +3.8/10.0
- Livability +3.7/5.0
- Rent growth +2.5/5.0
- Condition / age +2.5/5.0
- Schools +1.0/10.0
- Appreciation +0.0/10.0
$160,000
🖨 Deal sheet 📄 Offer letter ✓ Due diligence
Listing remarks
Well-maintained and move-in ready 3-bedroom, 2-bath split-level home in Lansing! This HUD-owned property offers a functional layout with spacious living areas and tasteful updates throughout. The main level features a bright living room with large front windows, flowing into an updated kitchen complete with white cabinetry, modern backsplash, and stainless steel appliances. Upstairs you'll find comfortable bedrooms with fresh carpeting and neutral finishes, along with a beautifully updated full bathroom. The lower level provides additional living space-perfect for a family room, recreation area, or home office-plus a second full bath for added convenience. Situated on a generous . 1865-acre
Key facts
- 2 garage spots
- Built 1960
- Listed 5 days
Property features AI
Finance
- Other: Parcel number on record
- HOA & community: No master association fee required
Exterior
- Parking: Detached garage (owned) with 2 garage spaces; 2 total parking spaces
- Utilities: Public water; Public sewer
- Home design: Detached single-family home; Split-level / tri-level design; Fee simple ownership
- Construction: Aluminum siding; Built approximately 61–70 years ago; Built before 1978
- Exterior features: Lot less than 0.25 acre; Lot dimensions recorded
Interior
- Kitchen: Kitchen with eating area/table space (approx. 12 x 22)
- Bedrooms: 3 bedrooms (master and two additional bedrooms on second level; two bedrooms approx. 12 x 12, master approx. 14 x 10)
- Bathrooms: 2 full bathrooms; Basement includes a bathroom
- Heating & cooling: Natural gas forced-air heating; Central air conditioning
- Interior features: Finished partial basement; 6 total rooms; School bus service and commuter bus access
- Laundry & utility: Basement laundry room (approx. 12 x 10)
Neighborhood map
What this means for you Summary
Snapshot
- This is a 3-bed/1.5-bath single-family listed at $160k.
Deal economics
- At list price, monthly cash flow is $-14 ($-171/yr) — negative.
- To cash-flow at today's rent, offer at most $157k (1.6% below list).
- Meets the 1% rule at list price ($2k rent vs $160k).
- Recommended offer: $157k (1.6% below list) — sets the bar for cash-flow.
Location & tenants
- Location reads 73/100 on livability (#296 in IL) — a middle-class / working-renter tenant base. Strengths: commute A+, cost of living A+, housing A+; Watch: schools D+, crime D+, health & safety D+.
- Thornton Fractional Twp Hsd 215 (suburban): math 9% / reading 13% proficiency, ranked #563 of 620 in IL (top 91%) — low school quality limits family demand, transient renter base, plan for 1-2y turnover.
- Market conditions: 132 active listings in the ZIP; 9 comparable units currently listed for rent nearby; rentals leasing fast (median 12d on market — plan ~1-2 weeks tenant-placement turnaround); solid renter incomes; 6,272 units permitted in Cook County in 2024 (4,658 in 5+ unit buildings).
Forward outlook
- Local home prices are declining (-3.0%/yr); year-one equity from $1k of loan paydown is wiped out by about $5k of value loss. Plan a longer hold.
Negotiation context
- Only 5 days on market — expect competitive offers; lowballing is unlikely to land.
- 19 sale attempts since 10y ago with the ask held roughly flat each time — persistent listings suggest the price (not the market) is what's stuck; bring a comps-based counter.
Risks & watch-outs
- Watch-outs: property tax is 4.2% of price.
Questions for the listing agent
- What do current leases actually rent for vs. the listed asking? Can we see a recent rent roll and the last 12 months of T-12 income?
- Built in 1960 — when were the roof, HVAC, electrical panel, plumbing, and water heater last replaced?
- Property tax is high relative to price — has the assessment been appealed recently, and will the sale trigger a re-assessment?
- Is there a deadline driving the sale (1031 exchange, divorce, estate, relocation)? That informs how much negotiation room exists.
- Schools are D-rated, which usually means shorter tenancies and higher turnover. Who's the typical renter profile here, and what's been the actual vacancy rate?
- Crime grade is D in this area — have there been break-ins, vandalism, or insurance claims at this property in the last 3 years? What carrier currently insures it and at what premium?
- The area grade is low — what's the realistic commute time and amenity access for the typical tenant pool here? Any planned neighborhood developments (good or bad) we should know about?
- What's the average days-on-market for RENTAL listings here right now (not sales)? A rising rental-DOM trend means longer vacancies and softer asking-rent achievability than the comps imply.
- What's the recent tenant-quality profile in this submarket — average credit score on applications, eviction rate, late-payment / NSF rate, and stable-employment percentage? A property-management company in the area should have these aggregated.
- How much new for-sale + rental construction is in the pipeline within 1–3 miles? Heavy new supply typically softens prices + rents 12–24 months out; constrained supply supports both.
Investment metrics
- 1% rule
- 1.15% ✓
- Cap rate
- 6.19%
- Cash-on-cash
- -0.38%
- DSCR
- 0.98
- GRM
- 7.3
CMA / ARV
- ARV (on-the-fly)
- $205,820
- Comps found
- 12
Show comp detail 12 sales within ~0.75 mi
| Address | Dist | Beds/Ba | Sqft | Sold | Price | $/sf | Match |
|---|---|---|---|---|---|---|---|
| 18847 Greenbay Ave | 0.04mi | 3/1.0 | 960 (-4%) | 0mo | $225,000 | $234 | 88 |
| 3040 190th St | 0.15mi | 3/1.5 | 992 (-1%) | 10mo | $142,000 | $143 | 83 |
| 19048 Sherman St | 0.39mi | 3/2.0 | 1,066 (+6%) | 7mo | $235,000 | $220 | 64 |
| 2916 189th St | 0.31mi | 3/2.0 | 1,092 (+9%) | 7mo | $220,000 | $201 | 63 |
| 3252 191st St | 0.27mi | 3/2.0 | 1,104 (+10%) | 9mo | $230,000 | $208 | 61 |
| 18747 Sherman St | 0.42mi | 3/1.0 | 1,102 (+10%) | 2mo | $149,000 | $135 | 60 |
| 3320 191st St | 0.31mi | 3/2.0 | 1,150 (+14%) | 2mo | $207,000 | $180 | 58 |
| 18540 Miller Dr | 0.64mi | 3/1.0 | 1,040 (+4%) | 6mo | $243,000 | $234 | 57 |
| 18429 Ridgewood Ave | 0.62mi | 3/2.0 | 1,080 (+8%) | 6mo | $185,000 | $171 | 52 |
| 19404 Wildwood Ave | 0.71mi | 3/2.0 | 1,074 (+7%) | 4mo | $255,000 | $237 | 50 |
| 18444 School St | 0.70mi | 2/2.0 (-1) | 977 (-3%) | 11mo | $200,000 | $205 | 47 |
| 18269 Burnham Ave | 0.74mi | 2/1.0 (-1) | 925 (-8%) | 11mo | $128,200 | $139 | 36 |
Match score weights: distance 35% · size 25% · config 20% · recency 20%. Top-matched comps best support the ARV.
Projected returns pro-forma
-3.0% appreciation · 3.0% rent growth · sell at horizon
- IRR
- -16.7%
- Equity multiple
- 0.41×
- Total profit
- $-26,585
- Equity at exit
- $23,857
- IRR
- -8.2%
- Equity multiple
- 0.48×
- Total profit
- $-23,310
- Equity at exit
- $13,834
Cash invested: $44,800 (down + closing). Projections, not guarantees.
Landlord ↔ Tenant lean methodology
- Overall (STATE)
- 43 Moderately Tenant-Leaning
- State Illinois
- 43 Moderately Tenant-Leaning · D+7
- County
- — inherits STATE
- City
- — inherits STATE
ZIP-level market 60438
- Active inventory
- 132
- Price-to-rent
- 7.3×
Monthly cashflow live
- Estimated rent
- $1,834 high interval (Pro) →
- Mortgage (P&I)
- −$839
- Tax from tax record
- −$558 /mo · $6,691/yr
- Insurance
- −$67
- HOA
- −$0
- Vacancy / Maint / Mgmt
- −$385
- Net cashflow
- $-14
Break-even live
UW: 25.0% down · 7.5% · 30yr · 1.5% tax · 5.0% vac · 8.0% maint · 8.0% mgmt
Financing live
Cash to close
- Down payment
- $40,000
- Closing costs
- $4,800
- Reserves months
- —
- Total cash needed
- —
Loan-product check · same deal, 3 products live
Conventional
25% down · 7.5% · 30yr
- Down + closing
- —
- Monthly P&I
- —
- Monthly cashflow
- —
- DSCR
- —
- Eligible?
- —
Personal DTI + credit; lowest rate.
DSCR
20% down · 8.5% · 30yr
- Down + closing
- —
- Monthly P&I
- —
- Monthly cashflow
- —
- DSCR
- —
- Eligible?
- —
No personal income docs; deal must DSCR.
Hard money
10% down · 12.0% · 12mo
- Down + closing
- —
- Monthly P&I
- —
- Monthly cashflow
- —
- DSCR
- —
- Eligible?
- —
Short-term bridge; refi at stabilization.
Rent comps 9 comps
| Address | Beds | Baths | Sqft | Rent | $/sqft | DOM | Units | Dist |
|---|---|---|---|---|---|---|---|---|
| 3341 S Schultz Dr Lansing, IL | 4.0 | 2.0 | 1452 | $2,250 | $1.55 | 10d | 1 | 0.51mi |
| 2824 186th St Lansing, IL | 3.0 | 2.0 | 1400 | $2,900 | $2.07 | 10d | 1 | 0.55mi |
| 18335 Sherman St Unit 3 Lansing, IL | 3.0 | 1.0 | 1000 | $1,700 | $1.70 | 1d | 1 | 0.74mi |
| 18550 Torrence Ave #25 Lansing, IL | 2.0 | 1.0 | 1000 | $1,300 | $1.30 | 12d | 1 | 1.08mi |
| 18361 Glen Oak Ave Unit 1E Lansing, IL | 2.0 | 1.0 | 900 | $1,400 | $1.56 | 25d | 1 | 1.11mi |
| 18440 Torrence Ave Lansing, IL | 2.0 | 1.0 | 800 | $1,200 | $1.50 | 25d | 1 | 1.12mi |
| 18381 Torrence Ave Lansing, IL | 2.0 | 1.0 | 900 | $1,300 | $1.44 | 25d | 1 | 1.15mi |
| 3020 178th St Unit C1 Lansing, IL | 2.0 | 1.0 | 900 | $1,550 | $1.72 | 1d | 1 | 1.42mi |
| 3020 178th St Apt C7 Lansing, IL | 2.0 | 1.0 | 900 | $1,550 | $1.72 | 25d | 1 | 1.42mi |
Listing history 50 events
-
2026-06-08statusdays on market $160,000 Pending 5 DOM
-
2026-06-07days on market $160,000 Active 4 DOM
-
2026-06-04statusdays on market $160,000 Active 1 DOM
-
2026-05-04status Pending
-
2026-04-28$160,000 Active
-
2026-04-23status Pending
-
2026-04-22historical
-
2025-11-12Active
-
2025-10-12historical
-
2025-05-14price
-
2025-03-31status Active
-
2025-03-31price
-
2025-01-29historical Contingent - Continue to Show
-
2025-01-16price
-
2024-11-06status Active
-
2024-07-30historical Contingent - Continue to Show
-
2024-07-30status Active
-
2024-07-09historical
-
2024-06-12status Active
-
2024-02-14historical Contingent - Continue to Show
-
2024-01-31Active
-
2024-01-31historical
-
2024-01-12price
-
2023-12-14price
-
2023-12-08price
-
2023-11-30price
-
2023-10-26Active
-
2023-10-26historical
-
2023-10-11status Active
-
2023-10-11price
-
2023-09-18historical Contingent - Continue to Show
-
2023-08-24price
-
2023-06-26status Active
-
2023-05-22historical Contingent - Continue to Show
-
2023-05-11price
-
2023-05-10price
-
2023-05-02price
-
2023-04-13Active
-
2022-07-07historical
-
2022-06-08price
-
2022-05-25status Active
-
2022-05-24historical Contingent - Continue to Show
-
2022-05-18price
-
2022-05-12price
-
2022-05-05price
-
2022-04-16Active
-
2022-04-16historical
-
2022-02-24status Pending
-
2022-02-23status Active
-
2022-02-15historical Contingent - No Showings
ⓘ Source: listings_history table (triggers on properties + properties_extension) + one-shot
backfill from property_details.listing_events for pre-trigger history.
Tax reassessment forecast IL · Partial reset (capped growth)
- Current annual tax
- $6,691 · $558/mo
- Projected year-2 tax
- $6,691 · $558/mo
- Expected delta
- $0/yr ($0/mo · -0.0%)
ⓘ Screening estimate from a state-policy table — verify with the county assessor before closing.
Climate risk First Street
- Flood 4/10 Moderate FEMA zone X (unshaded) · 22% chance over 30 yrs
- Wildfire 1/10 Low
- Heat 3/10 Moderate 7 d/yr ≥102°F today · 15 d/yr by 30 yrs out
- Wind 2/10 Low 0% chance of damaging wind over 30 yrs
- Air quality 4/10 Moderate 5 unhealthy d/yr today · 6 by 30 yrs out
Nearby sold comps map
Loading sold comps map…
Walkable amenities ~0.75 mi
Loading nearby amenities…
Taxation est. · year 1
- Rental income
- $22,011
- − Mortgage interest
- −$8,962
- − Property taxes
- −$6,691
- − Insurance
- −$800
- − Repairs & maintenance
- −$1,761
- − Management
- −$1,761
- − Depreciation
- −$4,655
- Taxable loss
- −$2,618
- Est. tax savings @ 24.0%
- +$628
- After-tax cash flow
- $458/yr
For passive investors: Depreciation is non-cash, so a rental often shows a tax loss while cash-flowing — sheltering income. Rental losses are passive: they offset passive income freely, and up to $25,000/yr can offset ordinary (W-2) income if you actively participate and your MAGI is under $100k (phasing out to $0 by $150k); unused losses carry forward. On sale, claimed depreciation is recaptured at up to 25%, and gains may owe capital-gains tax (a 1031 exchange can defer both). Figures are a year-1 estimate at your 24.0% rate — not tax advice; consult a CPA.
Schools (NCES district)
- District
- Thornton Fractional Twp Hsd 215
- NCES district ID
- 1738940
- Math proficiency
- 9% ▼ -3.00%
- Reading proficiency
- 13% ▼ -3.00%
- Median HH income
- $48,207
- Composite
- 10.27/100
- National rank
- #9793
- State rank
- #563 of 620 in IL
Livability — Lansing
- Score
- 73/100
- State rank
- #296
- US rank
- #5698
Category grades
Schools grade is shown separately in the Schools card above.
Census & demographics
- Census place
- Lansing, IL
- County
- Cook County · 4,486,803 people
- City population
- 28,806
- Metro
- Chicago-Naperville-Elgin, IL-IN-WI
- Population (ZIP)
- 28,806
- Household income
- $75,681
- Rent vs Own
- Severe rent burden
- 830.0
Population outlook (Cook County) Hauer SSP2
- Today (2025)
- 5,347,519 people
- By 2030
- 5,357,703 · +0.2%
- By 2040
- 5,324,924 · -0.4%
- By 2050
- 5,230,762 · -2.2%
- By 2075
- 4,785,735 · -10.5%
- By 2100
- 4,188,836 · -21.7%
Race, ethnicity, and origin ACS 2023
- Neighborhood character
- Diverse neighborhood (Simpson 0.65)
- Race & ethnicity
- Black 51% White 25% Hispanic / Latino 18% Two or more races 7% Asian 2%
- Hispanic origin (detail)
- Mexican 15%
- Common ancestry
- Romanian 5% Iranian 3% Lithuanian 1%
- Foreign-born
- 10% · Canada
- Languages at home
- 83% English-only · Spanish 12% Vietnamese 1% French/Haitian/Cajun 1%
Political lean MEDSL · Cook
- 2024 margin
- Solid D (+42.0) · D 70.4% · R 28.4% · Other 1.2%
- 2008→2024 swing
- -11.4pp toward R · 2008: 53.4pp · 2024: 42.0pp
- All cycles
- 2024: D+42.0 2020: D+50.3 2016: D+53.0 2012: D+49.4 2008: D+53.4
Not yet ingested
- Civics
- —
Market trends
- HPI YoY
- ▼ -151.65%
- Current HPI
- 210.3398
- Rent YoY
- —
- Metro
- Chicago-Naperville-Elgin, IL-IN-WI
- State GDP YoY
- ▲ 1.59%
- F500 in state
- 60
Industry mix (Fortune 500 HQ in IL)
| Industry | F500 HQs | Revenue |
|---|---|---|
| Insurance | 4 | $201B |
|
||
| Consumer Goods | 4 | $87B |
|
||
| Industrial Machinery | 3 | $64B |
|
||
| Healthcare | 2 | $55B |
|
||
| Retail / Pharmacy | 1 | $148B |
|
||
| Agriculture / Food | 1 | $86B |
|
||
Price history
+4.9% since first listed68 events — show timeline
- 2026-05-04 Pending — MRED as Distributed by MLS Grid
- 2026-04-28 Listed $160,000 MRED as Distributed by MLS Grid
- 2026-04-23 Pending — MRED as Distributed by MLS Grid
- 2026-04-22 Listing Removed — MRED as Distributed by MLS Grid
- 2025-11-12 Listed — MRED as Distributed by MLS Grid
- 2025-10-12 Listing Removed — MRED as Distributed by MLS Grid
- 2025-05-14 Price Changed — MRED as Distributed by MLS Grid
- 2025-03-31 Relisted — MRED as Distributed by MLS Grid
- 2025-03-31 Price Changed — MRED as Distributed by MLS Grid
- 2025-01-29 Contingent — MRED as Distributed by MLS Grid
- 2025-01-16 Price Changed — MRED as Distributed by MLS Grid
- 2024-11-06 Relisted — MRED as Distributed by MLS Grid
- 2024-07-30 Contingent — MRED as Distributed by MLS Grid
- 2024-07-30 Relisted — MRED as Distributed by MLS Grid
- 2024-07-09 Listing Removed — MRED as Distributed by MLS Grid
- 2024-06-12 Relisted — MRED as Distributed by MLS Grid
- 2024-02-14 Contingent — MRED as Distributed by MLS Grid
- 2024-01-31 Listing Removed — MRED as Distributed by MLS Grid
- 2024-01-31 Listed — MRED as Distributed by MLS Grid
- 2024-01-12 Price Changed — MRED as Distributed by MLS Grid
- 2023-12-14 Price Changed — MRED as Distributed by MLS Grid
- 2023-12-08 Price Changed — MRED as Distributed by MLS Grid
- 2023-11-30 Price Changed — MRED as Distributed by MLS Grid
- 2023-10-26 Listing Removed — MRED as Distributed by MLS Grid
- 2023-10-26 Listed — MRED as Distributed by MLS Grid
- 2023-10-11 Relisted — MRED as Distributed by MLS Grid
- 2023-10-11 Price Changed — MRED as Distributed by MLS Grid
- 2023-09-18 Contingent — MRED as Distributed by MLS Grid
- 2023-08-24 Price Changed — MRED as Distributed by MLS Grid
- 2023-06-26 Relisted — MRED as Distributed by MLS Grid
- 2023-05-22 Contingent — MRED as Distributed by MLS Grid
- 2023-05-11 Price Changed — MRED as Distributed by MLS Grid
- 2023-05-10 Price Changed — MRED as Distributed by MLS Grid
- 2023-05-02 Price Changed — MRED as Distributed by MLS Grid
- 2023-04-13 Listed — MRED as Distributed by MLS Grid
- 2022-07-07 Listing Removed — MRED as Distributed by MLS Grid
- 2022-06-08 Price Changed — MRED as Distributed by MLS Grid
- 2022-05-25 Relisted — MRED as Distributed by MLS Grid
- 2022-05-24 Contingent — MRED as Distributed by MLS Grid
- 2022-05-18 Price Changed — MRED as Distributed by MLS Grid
- 2022-05-12 Price Changed — MRED as Distributed by MLS Grid
- 2022-05-05 Price Changed — MRED as Distributed by MLS Grid
- 2022-04-16 Listing Removed — MRED as Distributed by MLS Grid
- 2022-04-16 Listed — MRED as Distributed by MLS Grid
- 2022-02-24 Pending — MRED as Distributed by MLS Grid
- 2022-02-23 Relisted — MRED as Distributed by MLS Grid
- 2022-02-15 Contingent — MRED as Distributed by MLS Grid
- 2022-02-13 Pending — MRED as Distributed by MLS Grid
- 2022-02-12 Listing Removed — MRED as Distributed by MLS Grid
- 2022-01-26 Price Changed — MRED as Distributed by MLS Grid
- 2022-01-08 Price Changed — MRED as Distributed by MLS Grid
- 2021-11-26 Price Changed — MRED as Distributed by MLS Grid
- 2021-11-20 Price Changed — MRED as Distributed by MLS Grid
- 2021-11-08 Listed — MRED as Distributed by MLS Grid
- 2017-08-03 Sold (Public Records) $168,000 Public Records
- 2017-07-07 Sold (MLS) $168,000 MRED as Distributed by MLS Grid
- 2017-07-03 Pending — MRED as Distributed by MLS Grid
- 2017-07-03 Relisted — MRED as Distributed by MLS Grid
- 2017-05-12 Pending — MRED as Distributed by MLS Grid
- 2017-05-09 Listing Removed — MRED as Distributed by MLS Grid
- 2017-05-03 Listed $170,000 MRED as Distributed by MLS Grid
- 2017-05-03 Listing Removed — MRED as Distributed by MLS Grid
- 2017-04-25 Price Changed — MRED as Distributed by MLS Grid
- 2017-04-01 Listed — MRED as Distributed by MLS Grid
- 2016-07-07 Pending — MRED as Distributed by MLS Grid
- 2016-06-22 Price Changed — MRED as Distributed by MLS Grid
- 2016-05-02 Listed — MRED as Distributed by MLS Grid
- 2005-07-25 Sold (Public Records) $152,500 Public Records
Property tax history
+4.6%/yrLatest (2023): $6,691 · +27.0% YoY. Source: county tax records.
Cash-flow waterfall
monthlySold comps — $/sqft
last 12 mo · ≤1 miLoading sold comps…