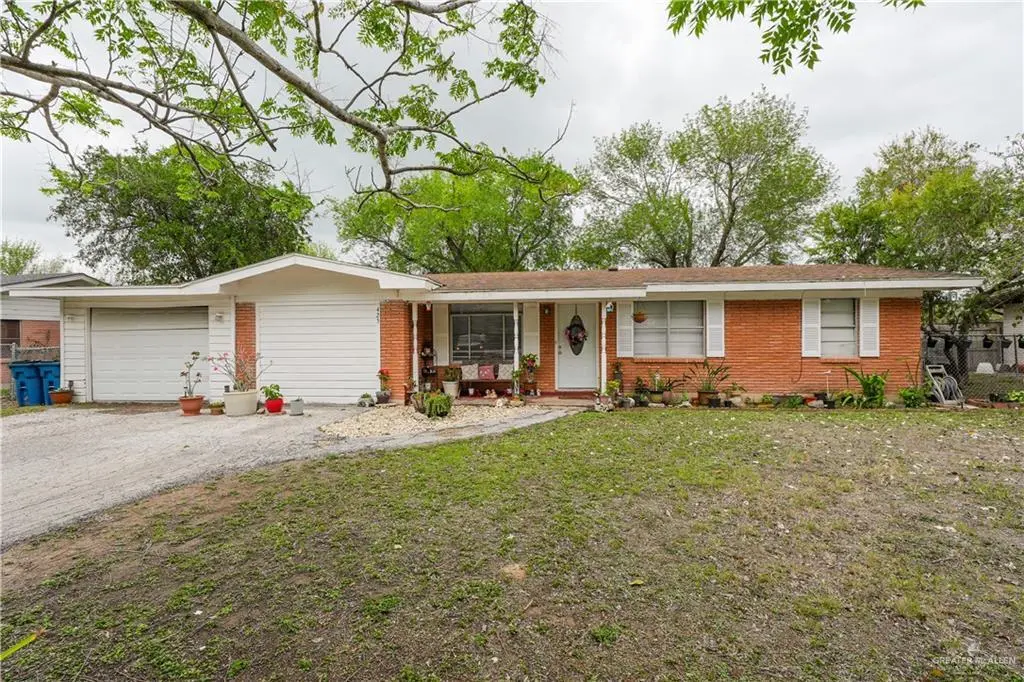
425 S Reynolds St · Rio Hondo, TX
Flood risk 1/10 · Minimal
- FEMA flood zone
- X (unshaded)
- Chance of flooding over 30 yrs
- 0.0%
- Est. flood insurance / yr
- $507 – $1,088
Fire risk 1/10 · Minimal
- Est. fire insurance / yr
- $1,222 – $2,270
Heat risk 10/10 · Severe
- Hot days now (above 110°F)
- 7 days/yr
- Hot days in 30 yrs
- 26 days/yr
Wind risk 9/10 · Severe
- Chance of severe wind over 30 yrs
- 99.0%
Air-quality risk 1/10 · Minimal
- Unhealthy air days now
- 0 days/yr
- Unhealthy air days in 30 yrs
- 0 days/yr
Risk factors via First Street. Map © Google.
Why this score? — see what drove the D- grade
The composite is a weighted blend of 9 inputs, each scored 0–100. Each bar is that input's sub-score; the figure is the points it added to the 100-point composite (weight × sub-score).
- ARV discount +14.5/15.0
- Appreciation +8.3/10.0
- Cash flow +5.0/30.0
- Livability +3.6/5.0
- Rent growth +2.5/5.0
- Condition / age +2.5/5.0
- Schools +1.8/10.0
- 1% rule +1.5/10.0
- DSCR +0.0/10.0
$195,000
🖨 Deal sheet (PDF) 📄 Offer letter ✓ Due diligence
Listing remarks MLS
This beautifully updated 4-bedroom, 1-bath home offers approximately 1,615 living sqft and a 1-car garage. The property has undergone recent remodeling, featuring new flooring, a fully renovated bathroom, and a modern kitchen with quartz countertops and a stylish backsplash. Situated on a spacious 0.38-acre lot, the backyard is fully fenced and includes a storage shed for extra space. The chain-link fence and appliances will convey with the home. This one won’t last long, schedule your tour today!
Key facts
- 0.38 acre lot
- Garage
- Built 1979
Neighborhood map
What this means for you Summary
Snapshot
- This is a 3-bed/1.0-bath single-family listed at $195k.
Deal economics
- At list price, monthly cash flow is $-458 ($-5k/yr) — negative.
- To cash-flow at today's rent, offer at most $114k (41.5% below list).
- To meet the 1% rule (rent ≥ 1% of price), the offer needs to be $126k (35.4% below list).
- Recommended offer: $114k (41.5% below list) — sets the bar for cash-flow.
Location & tenants
- Location reads 71/100 on livability (#305 in TX) — a middle-class / working-renter tenant base. Strengths: cost of living A+, housing A+, health & safety A+; Watch: crime C-, amenities F, commute F.
- Rio Hondo ISD (town): math 15% / reading 28% proficiency, ranked #769 of 826 in TX (top 93%) — low school quality limits family demand, transient renter base, plan for 1-2y turnover.
- Zoned schools: Rio Hondo El (math 12% / reading 17%, grade F, #4,048 of 4,322 statewide, top 95%, 624 students, 86% FRL); Rio Hondo Middle (math 14% / reading 29%, grade F, #1,378 of 1,662 statewide, top 83%, 488 students, 91% FRL); Rio Hondo H S (math 22% / reading 42%, grade F, #1,044 of 1,632 statewide, top 66%, 507 students, 83% FRL) — zoned schools average 87% FRL vs 23% district-wide (64 pts higher); higher-poverty schools than district average — tighter screening recommended.
- Market conditions: 98 active listings in the ZIP; 2,326 units permitted in Cameron County in 2024 (503 in 5+ unit buildings).
Forward outlook
- In year one you build about $14k of equity ($1k loan paydown + $13k appreciation (6.6% local appreciation)).
- Cameron County population projected at +3% by 2050 — modest demand growth; plan on rents tracking national, not racing it.
- By year 3, paydown + projected appreciation supports a ~$35k cash-out refi (75% LTV) — recoverable capital for the next deal without selling this one.
Negotiation context
- It's been on market 67 days — a 6% lower offer ($183k) is reasonable based on typical stale-listing flexibility.
Risks & watch-outs
- Climate carrying-cost: severe wind risk, 99% chance of damaging wind over 30y; extreme-heat days projected 7→26/yr by 2055 (HVAC capex compounding) — expect insurance premiums to compound above CPI over the hold.
Questions for the listing agent
- What do current leases actually rent for vs. the listed asking? Can we see a recent rent roll and the last 12 months of T-12 income?
- It's been on market 67 days. Have you received any prior offers? Is the seller open to a 41% concession, seller financing, or rate buy-down credit?
- Built in 1979 — when were the roof, HVAC, electrical panel, plumbing, and water heater last replaced?
- Why hasn't it sold? Are there any deal-killer items the seller is aware of (foundation, flood, title, zoning, code violations)?
- Is there a deadline driving the sale (1031 exchange, divorce, estate, relocation)? That informs how much negotiation room exists.
- Schools are D-rated, which usually means shorter tenancies and higher turnover. Who's the typical renter profile here, and what's been the actual vacancy rate?
- The area grade is low — what's the realistic commute time and amenity access for the typical tenant pool here? Any planned neighborhood developments (good or bad) we should know about?
- What's the average days-on-market for RENTAL listings here right now (not sales)? A rising rental-DOM trend means longer vacancies and softer asking-rent achievability than the comps imply.
- What's the recent tenant-quality profile in this submarket — average credit score on applications, eviction rate, late-payment / NSF rate, and stable-employment percentage? A property-management company in the area should have these aggregated.
- How much new for-sale + rental construction is in the pipeline within 1–3 miles? Heavy new supply typically softens prices + rents 12–24 months out; constrained supply supports both.
Investment metrics
- 1% rule
- 0.65% ✗
- Cap rate
- 3.48%
- Cash-on-cash
- -10.06%
- DSCR
- 0.55
- GRM
- 12.9
CMA / ARV
- ARV (median comp)
- $231,149
- List price
- $195,000
- Delta
- -15.64%
- Verdict
- UNDERPRICED
- Comps
- 9 within 1.0 mi
Show comp detail 2 sales within ~0.75 mi
| Address | Dist | Beds/Ba | Sqft | Sold | Price | $/sf | Match |
|---|---|---|---|---|---|---|---|
| 910 S Reynolds St | 0.27mi | 3/2.0 | 1,206 (-6%) | 6mo | $189,000 | $157 | 68 |
| 322 Daisy Ln | 0.64mi | 3/2.5 | 1,329 (+3%) | 12mo | $245,000 | $184 | 49 |
Match score weights: distance 35% · size 25% · config 20% · recency 20%. Top-matched comps best support the ARV.
Projected returns pro-forma
6.58% appreciation · 3.0% rent growth · sell at horizon
- IRR
- 8.9%
- Equity multiple
- 1.62×
- Total profit
- $33,977
- Equity at exit
- $129,761
- IRR
- 10.3%
- Equity multiple
- 3.22×
- Total profit
- $121,390
- Equity at exit
- $241,773
Cash invested: $54,600 (down + closing). Projections, not guarantees.
Landlord ↔ Tenant lean methodology
- Overall (STATE)
- 87 Strongly Landlord-Friendly
- State Texas
- 87 Strongly Landlord-Friendly · R+5
- County
- — inherits STATE
- City
- — inherits STATE
ZIP-level market 78583
- Home prices YoY
- 3.4%
- Active inventory
- 98
- Price-to-rent
- 12.9×
Monthly cashflow live
- Estimated rent
- $1,259 medium interval (Pro) →
- Mortgage (P&I)
- −$1,023
- Tax from tax record
- −$349 /mo · $4,184/yr
- Insurance
- −$81
- HOA
- −$0
- Vacancy / Maint / Mgmt
- −$264
- Net cashflow
- $-458
Break-even live
Sensitivity live
| Price | -10% $-347 | -5% $-403 | +0% $-458 | +5% $-513 | +10% $-568 |
|---|---|---|---|---|---|
| Rent | -10% $-557 | -5% $-507 | +0% $-458 | +5% $-408 | +10% $-358 |
| Rate | -1.0pp $-360 | -0.5pp $-408 | base $-458 | +0.5pp $-508 | +1.0pp $-560 |
UW: 25.0% down · 7.5% · 30yr · 1.5% tax · 5.0% vac · 8.0% maint · 8.0% mgmt
Financing live
Cash to close
- Down payment
- $48,750
- Closing costs
- $5,850
- Reserves months
- —
- Total cash needed
- —
Loan-product check · same deal, 3 products live
Conventional
25% down · 7.5% · 30yr
- Down + closing
- —
- Monthly P&I
- —
- Monthly cashflow
- —
- DSCR
- —
- Eligible?
- —
Personal DTI + credit; lowest rate.
DSCR
20% down · 8.5% · 30yr
- Down + closing
- —
- Monthly P&I
- —
- Monthly cashflow
- —
- DSCR
- —
- Eligible?
- —
No personal income docs; deal must DSCR.
Hard money
10% down · 12.0% · 12mo
- Down + closing
- —
- Monthly P&I
- —
- Monthly cashflow
- —
- DSCR
- —
- Eligible?
- —
Short-term bridge; refi at stabilization.
Listing history 21 events
-
2026-06-22days on market $195,000 Active 67 DOM
-
2026-06-18days on market $195,000 Active 64 DOM
-
2026-06-17days on market $195,000 Active 63 DOM
-
2026-06-16days on market $195,000 Active 62 DOM
-
2026-06-15days on market $195,000 Active 61 DOM
-
2026-06-14days on market $195,000 Active 59 DOM
-
2026-06-13days on market $195,000 Active 58 DOM
-
2026-06-10days on market $195,000 Active 56 DOM
-
2026-06-09days on market $195,000 Active 55 DOM
-
2026-06-09days on market $195,000 Active 54 DOM
-
2026-06-07days on market $195,000 Active 53 DOM
-
2026-06-05days on market $195,000 Active 50 DOM
-
2026-06-03days on market $195,000 Active 49 DOM
-
2026-06-02days on market $195,000 Active 48 DOM
-
2026-06-01days on market $195,000 Active 47 DOM
-
2026-05-31days on market $195,000 Active 46 DOM
-
2026-05-30days on market $195,000 Active 45 DOM
-
2026-05-15price $195,000 508-char remark
Show marketing remark (508 chars)
This beautifully updated 4-bedroom, 1-bath home offers approximately 1,615 living sqft and a 1-car garage. The property has undergone recent remodeling, featuring new flooring, a fully renovated bathroom, and a modern kitchen with quartz countertops and a stylish backsplash. Situated on a spacious 0.38-acre lot, the backyard is fully fenced and includes a storage shed for extra space. The chain-link fence and appliances will convey with the home. This one won’t last long, schedule your tour today!
-
2026-04-15$209,900 Active 508-char remark
Show marketing remark (508 chars)
This beautifully updated 4-bedroom, 1-bath home offers approximately 1,615 living sqft and a 1-car garage. The property has undergone recent remodeling, featuring new flooring, a fully renovated bathroom, and a modern kitchen with quartz countertops and a stylish backsplash. Situated on a spacious 0.38-acre lot, the backyard is fully fenced and includes a storage shed for extra space. The chain-link fence and appliances will convey with the home. This one won’t last long, schedule your tour today!
-
2002-05-03soldstatus
-
1999-07-01soldstatus
ⓘ Source: listings_history table (triggers on properties + properties_extension) + one-shot
backfill from property_details.listing_events for pre-trigger history.
Tax reassessment forecast TX · Resets to sale price
- Current annual tax
- $4,184 · $349/mo
- Projected year-2 tax
- $4,184 · $349/mo
- Expected delta
- $0/yr ($0/mo · 0.0%)
ⓘ Screening estimate from a state-policy table — verify with the county assessor before closing.
Climate risk First Street
- Flood 1/10 Low FEMA zone X (unshaded) · 0% chance over 30 yrs
- Wildfire 1/10 Low
- Heat 10/10 Extreme 7 d/yr ≥110°F today · 26 d/yr by 30 yrs out
- Wind 9/10 Extreme 99% chance of damaging wind over 30 yrs
- Air quality 1/10 Low 0 unhealthy d/yr today · 0 by 30 yrs out
Nearby sold comps map
Loading sold comps map…
Walkable amenities ~0.75 mi
Loading nearby amenities…
Taxation est. · year 1
- Rental income
- $15,110
- − Mortgage interest
- −$10,923
- − Property taxes
- −$4,184
- − Insurance
- −$975
- − Repairs & maintenance
- −$1,209
- − Management
- −$1,209
- − Depreciation
- −$5,673
- Taxable loss
- −$9,062
- Est. tax savings @ 24.0%
- +$2,175
- After-tax cash flow
- $-3,318/yr
For passive investors: Depreciation is non-cash, so a rental often shows a tax loss while cash-flowing — sheltering income. Rental losses are passive: they offset passive income freely, and up to $25,000/yr can offset ordinary (W-2) income if you actively participate and your MAGI is under $100k (phasing out to $0 by $150k); unused losses carry forward. On sale, claimed depreciation is recaptured at up to 25%, and gains may owe capital-gains tax (a 1031 exchange can defer both). Figures are a year-1 estimate at your 24.0% rate — not tax advice; consult a CPA.
Schools (NCES district)
- District
- Rio Hondo ISD
- NCES district ID
- 4837170
- Math proficiency
- 15% ▼ -24.00%
- Reading proficiency
- 28% ▼ -10.00%
- Median HH income
- $36,099
- Composite
- 17.78/100
- National rank
- #9014
- State rank
- #769 of 826 in TX
Livability — Rio Hondo
- Score
- 71/100
- State rank
- #305
- US rank
- #6894
Category grades
Schools grade is shown separately in the Schools card above.
Census & demographics
- Census place
- Rio Hondo, TX
- Population (ZIP)
- 5,472
Population outlook (Cameron County) Hauer SSP2
- Today (2025)
- 441,603 people
- By 2030
- 448,113 · +1.5%
- By 2040
- 456,385 · +3.3%
- By 2050
- 456,294 · +3.3%
- By 2075
- 423,851 · -4.0%
- By 2100
- 342,787 · -22.4%
Race, ethnicity, and origin ACS 2023
- Neighborhood character
- Predominantly Hispanic (84%)
- Race & ethnicity
- Hispanic / Latino 84% Two or more races 48% White 15%
- Hispanic origin (detail)
- Mexican 81%
- Common ancestry
- Slovak 1% Portuguese 1% Iranian 1%
- Foreign-born
- 17% · Canada
- Languages at home
- 37% English-only · Spanish 63%
Political lean MEDSL · Cameron
- 2024 margin
- Lean R (+5.8) · D 46.7% · R 52.5%
- 2008→2024 swing
- -34.6pp toward R · 2008: 28.8pp · 2024: -5.8pp
- All cycles
- 2024: R+5.8 2020: D+13.2 2016: D+32.5 2012: D+32.4 2008: D+28.8
Not yet ingested
- Civics
- —
Market trends
- HPI YoY
- ▲ 6.58%
- Current HPI
- 199.084
- Rent YoY
- —
- Metro
- —
- State GDP YoY
- ▲ 3.95%
- F500 in state
- 110
Industry mix (Fortune 500 HQ in TX)
| Industry | F500 HQs | Revenue |
|---|---|---|
| Energy | 16 | $1,198B |
|
||
| Technology | 5 | $198B |
|
||
| Engineering / Construction | 4 | $72B |
|
||
| Energy Services | 3 | $60B |
|
||
| Utilities | 3 | $41B |
|
||
| Healthcare | 2 | $330B |
|
||
Price history
-7.1% since first listed4 events — show timeline
- 2026-05-15 Price Changed $195,000 MCALLENMLS
- 2026-04-15 Listed $209,900 MCALLENMLS
- 2002-05-03 Sold (Public Records) — Public Records
- 1999-07-01 Sold (Public Records) — Public Records
Property tax history
+7.7%/yrLatest (2025): $4,184 · +19.6% YoY. Source: county tax records.
Cash-flow waterfall
monthlySold comps — $/sqft
last 12 mo · ≤1 miLoading sold comps…