6108 Abrams Rd #330 · Dallas, TX
Flood risk 1/10 · Minimal
- FEMA flood zone
- X (unshaded)
- Chance of flooding over 30 yrs
- 0.0%
- Est. flood insurance / yr
- $507 – $1,088
Fire risk 2/10 · Minimal
- Est. fire insurance / yr
- $1,222 – $2,270
Heat risk 7/10 · Major
- Hot days now (above 109°F)
- 7 days/yr
- Hot days in 30 yrs
- 23 days/yr
Wind risk 6/10 · Moderate
- Chance of severe wind over 30 yrs
- 27.0%
Air-quality risk 3/10 · Minor
- Unhealthy air days now
- 3 days/yr
- Unhealthy air days in 30 yrs
- 3 days/yr
Risk factors via First Street. Map © Google.
Why this score? — see what drove the D grade
The composite is a weighted blend of 9 inputs, each scored 0–100. Each bar is that input's sub-score; the figure is the points it added to the 100-point composite (weight × sub-score).
- 1% rule +10.0/10.0
- Cash flow +9.9/30.0
- ARV discount +7.5/15.0
- Livability +4.0/5.0
- Rent growth +3.0/5.0
- DSCR +2.8/10.0
- Schools +2.8/10.0
- Condition / age +2.5/5.0
- Appreciation +0.0/10.0
$94,900
🖨 Deal sheet (PDF) 📄 Offer letter ✓ Due diligence
Listing remarks
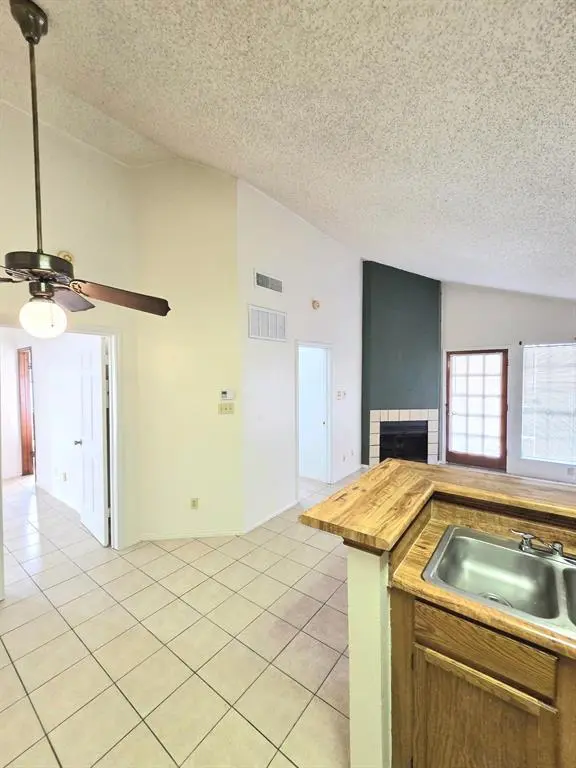
Great investment opportunity 2 bedroom, 2 bath condo in Northeast Dallas; features vaulted ceiling, spacious living room with a wood burning fire place. Also, enjoy close proximity to Northwest Highway and 75, as well as a short commute to SMU, White Rock Lake, North park Mall, and plenty shopping stores and restaurants.
Key facts
- Short commute to smu
- Vaulted ceiling
- $475 HOA
Tags
Property features AI
Finance
- Other: Property treated as residential condominium; No municipal utility district
- Financial info: Listing terms: Cash or Conventional
- HOA & community: Mandatory association; Monthly association fee ($475) covers front and back yard maintenance, full use of facilities, and management fees; HOA management: Sable Ridge Owners Assoc.
Exterior
- Parking: Assigned parking
- Security: No surveillance devices noted
- Utilities: City water; City sewer; Cable available; Electric service
- Home design: Condominium attached unit; Located on 3rd floor of a 3-story building; Entry level: 3rd floor; Built in 1984; Complex: Sable Ridge Condos
- Construction: Brick and wood construction; Shingle roof; Slab foundation
- Exterior features: Community mailboxes; All-weather road access; Tennis courts in community; Back and front yard maintenance included with association
Interior
- Kitchen: Dishwasher; Disposal; Electric range
- Bedrooms: Primary bedroom on level 1 (approx. 14 x 14); Second bedroom on level 1 (approx. 10 x 12)
- Flooring: Tile flooring
- Bathrooms: 2 full bathrooms
- Heating & cooling: Central air conditioning; Electric heating; Wood-burning fireplace (1)
- Interior features: Cable TV available; One living area; One dining area; Total of 3 rooms
- Laundry & utility: Stacked washer/dryer area; Electric dryer hookup
Neighborhood map
What this means for you Summary
Snapshot
- This is a 2-bed/2.0-bath condo listed at $95k.
Deal economics
- At list price, monthly cash flow is $-59 ($-713/yr) — negative.
- To cash-flow at today's rent, offer at most $84k (11.1% below list).
- Meets the 1% rule at list price ($1k rent vs $95k).
- Recommended offer: $84k (11.1% below list) — sets the bar for cash-flow.
- Cap rate 5.5% vs local median 2.3% in Dallas — top-decile yield for the area; either an underpriced asset or a hidden risk that comps aren't pricing in. Stress-test before assuming the spread holds.
Location & tenants
- Location reads 81/100 on livability (#24 in TX, #1,380 nationally) — a professional / high-income tenant draw. Strengths: amenities A+, commute A+, housing A+; Watch: crime F.
- Dallas ISD (urban): math 31% / reading 36% proficiency, ranked #559 of 826 in TX (top 68%) — families likely to look elsewhere, expect single-tenant / working-renter base with shorter leases; 83% free/reduced lunch — lower-income household profile, screen leases tightly.
- Zoned schools: Solar Preparatory School For Girls At Bonham (math 59% / reading 65%, grade B, #321 of 4,322 statewide, top 8%, 743 students, 49% FRL) — zoned schools average 49% FRL vs 83% district-wide (34 pts lower); this property's tenant base skews higher-income than the district average.
- Zoned-school proficiency averages 62% at this address vs 34% district-wide (+28 pts) — the actual schools serving this property are materially stronger than the Dallas ISD average implies; a family-tenant draw the district grade alone would hide.
- Market conditions: Rents rising (+2.0%/yr); 213 active listings in the ZIP; 40 comparable units currently listed for rent nearby; rentals leasing fast (median 13d on market — plan ~1-2 weeks tenant-placement turnaround); 12,577 units permitted in Dallas County in 2024 (6,829 in 5+ unit buildings).
- This rent runs 31% of the median local income ($59k/yr) — at the standard rent-burdened threshold; future hikes will face affordability resistance.
Forward outlook
- Local home prices are declining (-3.0%/yr); year-one equity from $656 of loan paydown is wiped out by about $3k of value loss. Plan a longer hold.
- Dallas County population projected at +35% by 2050 — long-run rental-demand tailwind backs the buy-and-hold thesis.
Negotiation context
- It's been on market 53 days — a 3% lower offer ($92k) is reasonable based on typical stale-listing flexibility.
- 5 sale attempts with the ask held roughly flat each time — persistent listings suggest the price (not the market) is what's stuck; bring a comps-based counter.
Risks & watch-outs
- Watch-outs: property tax is 2.9% of price; HOA is 32% of rent.
- Climate carrying-cost: major wind risk, 27% chance of damaging wind over 30y; extreme-heat days projected 7→23/yr by 2055 (HVAC capex compounding) — expect insurance premiums to compound above CPI over the hold.
Questions for the listing agent
- What do current leases actually rent for vs. the listed asking? Can we see a recent rent roll and the last 12 months of T-12 income?
- It's been on market 53 days. Have you received any prior offers? Is the seller open to a 11% concession, seller financing, or rate buy-down credit?
- Property tax is high relative to price — has the assessment been appealed recently, and will the sale trigger a re-assessment?
- What does the HOA fee cover, when was the last increase, and are there any pending special assessments or reserve-fund shortfalls?
- Any open or pending special assessments — roof, HVAC, plumbing, elevator, façade? What's the per-unit balance and payoff schedule, and is the seller paying it off at close or rolling it to the buyer?
- Is there a deadline driving the sale (1031 exchange, divorce, estate, relocation)? That informs how much negotiation room exists.
- Crime grade is F in this area — have there been break-ins, vandalism, or insurance claims at this property in the last 3 years? What carrier currently insures it and at what premium?
- The area grade is low — what's the realistic commute time and amenity access for the typical tenant pool here? Any planned neighborhood developments (good or bad) we should know about?
- What's the average days-on-market for RENTAL listings here right now (not sales)? A rising rental-DOM trend means longer vacancies and softer asking-rent achievability than the comps imply.
- What's the recent tenant-quality profile in this submarket — average credit score on applications, eviction rate, late-payment / NSF rate, and stable-employment percentage? A property-management company in the area should have these aggregated.
- How much new apartment / multifamily construction is in the pipeline within 1–3 miles? Heavy new supply (>2% of stock underway) typically softens rents 12–24 months out; light construction supports rent growth.
Investment metrics
- 1% rule
- 1.58% ✓
- Cap rate
- 5.54%
- Cash-on-cash
- -2.68%
- DSCR
- 0.88
- GRM
- 5.3
CMA / ARV
No comps found within radius.
Projected returns pro-forma
-3.0% appreciation · 1.96% rent growth · sell at horizon
- IRR
- -22.5%
- Equity multiple
- 0.23×
- Total profit
- $-20,330
- Equity at exit
- $14,150
- IRR
- -21.3%
- Equity multiple
- -0.03×
- Total profit
- $-27,255
- Equity at exit
- $8,205
Cash invested: $26,572 (down + closing). Projections, not guarantees.
Landlord ↔ Tenant lean methodology
- Overall (STATE)
- 87 Strongly Landlord-Friendly
- State Texas
- 87 Strongly Landlord-Friendly · R+5
- County
- — inherits STATE
- City
- — inherits STATE
ZIP-level market 75231
- Rents YoY
- 2.0%
- Active inventory
- 213
- Price-to-rent
- 5.3×
Monthly cashflow live
- Estimated rent
- $1,499 high interval (Pro) →
- Mortgage (P&I)
- −$498
- Tax from tax record
- −$232 /mo · $2,778/yr
- Insurance
- −$40
- HOA
- −$475
- Vacancy / Maint / Mgmt
- −$315
- Net cashflow
- $-59
Break-even live
Sensitivity live
| Price | -10% $-6 | -5% $-33 | +0% $-59 | +5% $-86 | +10% $-113 |
|---|---|---|---|---|---|
| Rent | -10% $-178 | -5% $-119 | +0% $-59 | +5% $0 | +10% $59 |
| Rate | -1.0pp $-12 | -0.5pp $-35 | base $-59 | +0.5pp $-84 | +1.0pp $-109 |
UW: 25.0% down · 7.5% · 30yr · 1.5% tax · 5.0% vac · 8.0% maint · 8.0% mgmt
Financing live
Cash to close
- Down payment
- $23,725
- Closing costs
- $2,847
- Reserves months
- —
- Total cash needed
- —
Loan-product check · same deal, 3 products live
Conventional
25% down · 7.5% · 30yr
- Down + closing
- —
- Monthly P&I
- —
- Monthly cashflow
- —
- DSCR
- —
- Eligible?
- —
Personal DTI + credit; lowest rate.
DSCR
20% down · 8.5% · 30yr
- Down + closing
- —
- Monthly P&I
- —
- Monthly cashflow
- —
- DSCR
- —
- Eligible?
- —
No personal income docs; deal must DSCR.
Hard money
10% down · 12.0% · 12mo
- Down + closing
- —
- Monthly P&I
- —
- Monthly cashflow
- —
- DSCR
- —
- Eligible?
- —
Short-term bridge; refi at stabilization.
Rent comps 40 comps
| Address | Beds | Baths | Sqft | Rent | $/sqft | DOM | Units | Dist |
|---|---|---|---|---|---|---|---|---|
| 6108 Abrams Rd Dallas, TX | 1.0–2.0 | 1.0–2.0 | 675 | $1,600 | $2.37 | 21d | 7 | 0.06mi |
| 6108 Abrams Rd Dallas, TX | 1.0–2.0 | 1.0–2.0 | 664 | $1,600 | $2.41 | 3d | 5 | 0.06mi |
| 6003 Abrams Rd Dallas, TX | 2.0 | 1.0–2.0 | 675 | $1,430 | $2.12 | 0d | 34 | 0.09mi |
| 6603 E Lovers Ln Dallas, TX | 2.0 | 1.0 | 620 | $1,299 | $2.09 | 2d | 5 | 0.31mi |
| 5680 Abrams Rd Dallas, TX | 1.0–2.0 | 1.0–1.5 | 862 | $1,671 | $1.94 | 0d | 2 | 0.43mi |
| 8910 Southwestern Blvd Dallas, TX | 1.0–3.0 | 1.0–2.0 | 974 | $1,992 | $2.04 | 0d | 29 | 0.51mi |
| 6466 Ridgecrest Rd Dallas, TX | 1.0 | 1.0 | 535 | $899 | $1.68 | 3d | 8 | 0.53mi |
| 6211 E Northwest Hwy Unit G224 Dallas, TX | 1.0 | 1.0 | 721 | $1,950 | $2.70 | 25d | 1 | 0.54mi |
| 6211 E Northwest Hwy Unit G417 Dallas, TX | 1.0 | 1.0 | 397 | $2,000 | $5.04 | 19d | 1 | 0.54mi |
| 8616 Southwestern Blvd Dallas, TX | 1.0 | 1.0 | 733 | $1,950 | $2.66 | 19d | 1 | 0.63mi |
| 8616 Southwestern Blvd Dallas, TX | 1.0 | 1.0 | 733 | $1,950 | $2.66 | 44d | 1 | 0.63mi |
| 8612 Southwestern Blvd Unit 8627 Dallas, TX | 1.0 | 1.0 | 561 | $1,437 | $2.56 | 0d | 1 | 0.63mi |
| 8612 Southwestern Blvd Unit 8633 Dallas, TX | 1.0 | 1.0 | 561 | $1,321 | $2.35 | 14d | 1 | 0.63mi |
| 8780 Park Ln Dallas, TX | 2.0 | 1.0–2.0 | 642 | $1,657 | $2.58 | 4d | 56 | 0.63mi |
| 8705 Southwestern Blvd Unit 412 Dallas, TX | 1.0 | 1.0 | 722 | $1,780 | $2.47 | 13d | 1 | 0.65mi |
| 8705 Southwestern Blvd Unit 8720 Dallas, TX | 1.0 | 1.0 | 722 | $1,826 | $2.53 | 0d | 1 | 0.65mi |
| 8705 Southwestern Blvd Unit 8720 Dallas, TX | 1.0 | 1.0 | 722 | $1,992 | $2.76 | 15d | 1 | 0.65mi |
| 6760 Eastridge Dr Unit 102 Dallas, TX | 1.0 | 1.0 | 725 | $1,350 | $1.86 | 19d | 1 | 0.66mi |
| 6311 Melody Ln Dallas, TX | 1.0 | 1.0 | 653 | $915 | $1.40 | 44d | 1 | 0.70mi |
| 8612 Southwestern Blvd Dallas, TX | 1.0 | 1.0 | 561 | $1,316 | $2.35 | 14d | 1 | 0.70mi |
| 6262 Melody Ln Dallas, TX | 2.0 | 1.0–2.0 | 750 | $1,400 | $1.87 | 0d | 4 | 0.73mi |
| 6262 Melody Ln Dallas, TX | 1.0–2.0 | 1.0–2.0 | 820 | $1,225 | $1.49 | 25d | 2 | 0.73mi |
| 6262 Melody Ln Dallas, TX | 1.0–2.0 | 1.0–2.0 | 865 | $1,485 | $1.72 | 12d | 3 | 0.73mi |
| 6262 Melody Ln Dallas, TX | 1.0–2.0 | 1.0–2.0 | 750 | $1,405 | $1.87 | 12d | 4 | 0.73mi |
| 8611 Southwestern Blvd Unit 412 Dallas, TX | 1.0 | 1.0 | 561 | $1,425 | $2.54 | 13d | 1 | 0.74mi |
| 8611 Southwestern Blvd Unit 8626 Dallas, TX | 1.0 | 1.0 | 636 | $1,595 | $2.51 | 15d | 1 | 0.74mi |
| 8611 Southwestern Blvd Unit 8626 Dallas, TX | 1.0 | 1.0 | 561 | $1,471 | $2.62 | 0d | 1 | 0.74mi |
| 6251 Melody Ln Dallas, TX | 1.0–2.0 | 1.0–2.0 | 819 | $1,395 | $1.70 | 0d | 39 | 0.76mi |
| 7545 E Northwest Hwy Dallas, TX | 2.0 | 1.0–2.0 | 938 | $2,243 | $2.39 | 0d | 28 | 0.85mi |
| 8601 Park Ln #416 Dallas, TX | 1.0 | 1.0 | 618 | $1,400 | $2.27 | 25d | 1 | 0.86mi |
| 6121 Melody Ln Dallas, TX | 1.0 | 1.0 | 653 | $960 | $1.47 | 25d | 1 | 0.87mi |
| 6050 Ridgecrest Rd Dallas, TX | 2.0 | 1.0–2.0 | 732 | $1,295 | $1.77 | 3d | 14 | 0.89mi |
| 8601 Park Ln Dallas, TX | 1.0 | 1.0 | 618 | $1,350 | $2.18 | 44d | 2 | 0.89mi |
| 6808 Skillman St Dallas, TX | 1.0–3.0 | 1.0–2.0 | 968 | $1,758 | $1.82 | 0d | 23 | 0.91mi |
| 6041 Ridgecrest Rd Dallas, TX | 1.0 | 1.0 | 587 | $1,165 | $1.98 | 18d | 4 | 0.97mi |
| 5605 Village Glen Dr Dallas, TX | 1.0–3.0 | 1.0–2.5 | 813 | $3,348 | $4.11 | 0d | 1 | 1.00mi |
| 6014 Ridgecrest Rd Dallas, TX | 1.0 | 1.0 | 734 | $975 | $1.33 | 44d | 1 | 1.02mi |
| 8510 Park Ln #203 Dallas, TX | 1.0 | 1.0 | 700 | $1,275 | $1.82 | 12d | 1 | 1.02mi |
| 8510 Park Ln #102 Dallas, TX | 1.0 | 1.0 | 700 | $1,195 | $1.71 | 11d | 1 | 1.02mi |
| 8510 Park Ln #201 Dallas, TX | 1.0 | 1.0 | 625 | $1,055 | $1.69 | 8d | 1 | 1.02mi |
HOA detail condo
- Monthly dues
- $475 · $5,700/yr
- Assessments
- None detected in remarks — confirm with the listing agent.
Listing history 27 events
-
2026-06-18days on market $94,900 Active 53 DOM
-
2026-06-17days on market $94,900 Active 52 DOM
-
2026-06-16days on market $94,900 Active 51 DOM
-
2026-06-15days on market $94,900 Active 50 DOM
-
2026-06-13pricedays on market $94,900 Active 48 DOM
-
2026-06-09days on market $99,000 Active 44 DOM
-
2026-06-08days on market $99,000 Active 43 DOM
-
2026-06-07days on market $99,000 Active 42 DOM
-
2026-06-04days on market $99,000 Active 39 DOM
-
2026-06-03days on market $99,000 Active 38 DOM
-
2026-06-02days on market $99,000 Active 37 DOM
-
2026-06-01days on market $99,000 Active 36 DOM
-
2026-05-31days on market $99,000 Active 35 DOM
-
2026-04-26$99,000 Active 322-char remark
-
2025-12-01$95,500 Active
-
2025-11-30historical
-
2025-09-30$100,000 Active
-
2025-09-25historical
-
2025-07-15price $105,000
-
2025-06-12price $111,000
-
2025-05-15status Active
-
2025-05-12historical
-
2025-05-07price $115,000
-
2025-03-17price $120,000
-
2025-02-12$125,000 Active
-
2001-12-04soldstatus
-
1995-11-13soldstatus
ⓘ Source: listings_history table (triggers on properties + properties_extension) + one-shot
backfill from property_details.listing_events for pre-trigger history.
Tax reassessment forecast TX · Resets to sale price
- Current annual tax
- $2,778 · $232/mo
- Projected year-2 tax
- $2,778 · $232/mo
- Expected delta
- $0/yr ($0/mo · 0.0%)
ⓘ Screening estimate from a state-policy table — verify with the county assessor before closing.
Climate risk First Street
- Flood 1/10 Low FEMA zone X (unshaded) · 0% chance over 30 yrs
- Wildfire 2/10 Low
- Heat 7/10 Severe 7 d/yr ≥109°F today · 23 d/yr by 30 yrs out
- Wind 6/10 Major 27% chance of damaging wind over 30 yrs
- Air quality 3/10 Moderate 3 unhealthy d/yr today · 3 by 30 yrs out
Nearby sold comps map
Loading sold comps map…
Walkable amenities ~0.75 mi
Loading nearby amenities…
Taxation est. · year 1
- Rental income
- $17,990
- − Mortgage interest
- −$5,316
- − Property taxes
- −$2,778
- − Insurance
- −$474
- − Repairs & maintenance
- −$1,439
- − Management
- −$1,439
- − HOA
- −$5,700
- − Depreciation
- −$2,761
- Taxable loss
- −$1,918
- Est. tax savings @ 24.0%
- +$460
- After-tax cash flow
- $-253/yr
For passive investors: Depreciation is non-cash, so a rental often shows a tax loss while cash-flowing — sheltering income. Rental losses are passive: they offset passive income freely, and up to $25,000/yr can offset ordinary (W-2) income if you actively participate and your MAGI is under $100k (phasing out to $0 by $150k); unused losses carry forward. On sale, claimed depreciation is recaptured at up to 25%, and gains may owe capital-gains tax (a 1031 exchange can defer both). Figures are a year-1 estimate at your 24.0% rate — not tax advice; consult a CPA.
Schools (NCES district)
- District
- Dallas ISD
- NCES district ID
- 4816230
- Math proficiency
- 31% ▼ -16.00%
- Reading proficiency
- 36% ▼ -4.00%
- Median HH income
- $42,881
- Composite
- 28.41/100
- National rank
- #6763
- State rank
- #559 of 826 in TX
Livability — Dallas
- Score
- 81/100
- State rank
- #24
- US rank
- #1380
Category grades
Schools grade is shown separately in the Schools card above.
Census & demographics
- Census place
- Dallas, TX
- County
- Dallas County · 2,612,404 people
- City population
- 1,168,437
- Metro
- Dallas-Fort Worth-Arlington, TX
- Population (ZIP)
- 38,370
- Household income
- $58,540
- Rent vs Own
- Severe rent burden
- 3482.0
Population outlook (Dallas County) Hauer SSP2
- Today (2025)
- 2,979,839 people
- By 2030
- 3,191,823 · +7.1%
- By 2040
- 3,619,611 · +21.5%
- By 2050
- 4,026,915 · +35.1%
- By 2075
- 4,957,073 · +66.4%
- By 2100
- 5,508,725 · +84.9%
Race, ethnicity, and origin ACS 2023
- Neighborhood character
- Highly diverse neighborhood (Simpson 0.74)
- Race & ethnicity
- Hispanic / Latino 33% White 29% Black 24% Two or more races 13% Asian 9%
- Hispanic origin (detail)
- Mexican 26%
- Common ancestry
- Slovak 1% Lithuanian 1% Romanian 1%
- Foreign-born
- 29% · Canada, Philippines, India
- Languages at home
- 57% English-only · Spanish 27% Other Asian/Pacific 4% Other Indo-European 3%
Political lean MEDSL · Dallas
- 2024 margin
- Strong D (+22.2) · D 60.2% · R 38.0% · Other 1.8%
- 2008→2024 swing
- +6.9pp toward D · 2008: 15.3pp · 2024: 22.2pp
- All cycles
- 2024: D+22.2 2020: D+31.6 2016: D+26.2 2012: D+15.4 2008: D+15.3
Not yet ingested
- Civics
- —
Market trends
- HPI YoY
- ▼ -359.41%
- Current HPI
- 249.5841
- Rent YoY
- ▲ 1.96%
- Metro
- Dallas-Fort Worth-Arlington, TX
- State GDP YoY
- ▲ 3.95%
- F500 in state
- 110
Industry mix (Fortune 500 HQ in TX)
| Industry | F500 HQs | Revenue |
|---|---|---|
| Energy | 16 | $1,198B |
|
||
| Technology | 5 | $198B |
|
||
| Engineering / Construction | 4 | $72B |
|
||
| Energy Services | 3 | $60B |
|
||
| Utilities | 3 | $41B |
|
||
| Healthcare | 2 | $330B |
|
||
Price history
-24.1% since first listed15 events — show timeline
- 2026-06-11 Price Changed $94,900 NTREIS
- 2026-04-26 Listed $99,000 NTREIS
- 2025-12-01 Listed $95,500 NTREIS
- 2025-11-30 Listing Removed — NTREIS
- 2025-09-30 Listed $100,000 NTREIS
- 2025-09-25 Listing Removed — NTREIS
- 2025-07-15 Price Changed $105,000 NTREIS
- 2025-06-12 Price Changed $111,000 NTREIS
- 2025-05-15 Relisted — NTREIS
- 2025-05-12 Listing Removed — NTREIS
- 2025-05-07 Price Changed $115,000 NTREIS
- 2025-03-17 Price Changed $120,000 NTREIS
- 2025-02-12 Listed $125,000 NTREIS
- 2001-12-04 Sold (Public Records) — Public Records
- 1995-11-13 Sold (Public Records) — Public Records
Property tax history
+7.8%/yrLatest (2025): $2,778 · -4.8% YoY. Source: county tax records.
Cash-flow waterfall
monthlySold comps — $/sqft
last 12 mo · ≤1 miLoading sold comps…