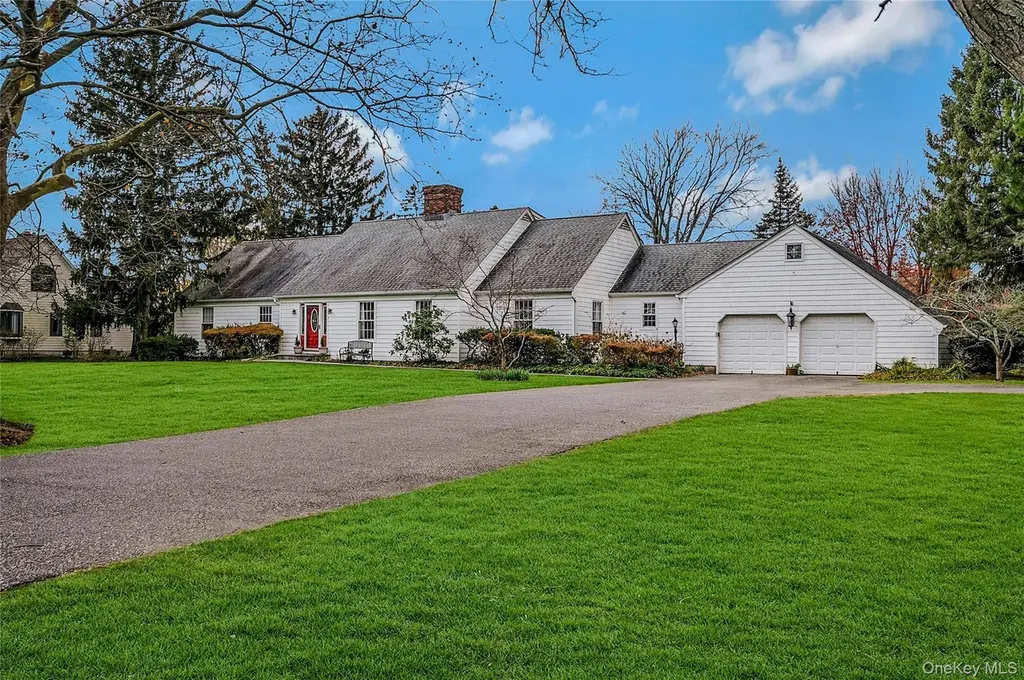
2340 Fairway Dr · Cutchogue, NY
Flood risk 1/10 · Minimal
- FEMA flood zone
- X (unshaded)
- Chance of flooding over 30 yrs
- 0.0%
- Est. flood insurance / yr
- $473 – $860
Fire risk 1/10 · Minimal
- Est. fire insurance / yr
- $691 – $1,283
Heat risk 5/10 · Moderate
- Hot days now (above 91°F)
- 7 days/yr
- Hot days in 30 yrs
- 19 days/yr
Wind risk 8/10 · Major
- Chance of severe wind over 30 yrs
- 80.0%
Air-quality risk 3/10 · Minor
- Unhealthy air days now
- 2 days/yr
- Unhealthy air days in 30 yrs
- 3 days/yr
Risk factors via First Street. Map © Google.
Why this score? — see what drove the A- grade
The composite is a weighted blend of 9 inputs, each scored 0–100. Each bar is that input's sub-score; the figure is the points it added to the 100-point composite (weight × sub-score).
- Cash flow +30.0/30.0
- DSCR +10.0/10.0
- Appreciation +10.0/10.0
- 1% rule +8.8/10.0
- ARV discount +7.1/15.0
- Schools +6.1/10.0
- Livability +3.1/5.0
- Rent growth +2.5/5.0
- Condition / age +2.5/5.0
$1,600,000
🖨 Deal sheet (PDF) 📄 Offer letter ✓ Due diligence
Listing remarks
Situated on the 17th hole of North Fork Country Club this home is located in the sought-after Fairway Farms Association. This 5-bedroom, 4-bath residence sits on a private . 93-acre lot less than 2 miles from New Suffolk Beach and just 0.5 miles to Cutchogue Village, offering close proximity to North Fork wineries, farm stands, waterfront dining, and beaches. The main level features a first-floor primary suite, two additional bedrooms, two full baths, and two fireplaces. Multiple living spaces include a spacious living room, formal dining area, separate den, and an oversized sunroom, ideal for entertaining or year-round relaxation. The second floor offers two additional bedrooms and a full
Key facts
- Salt water pool
- Built 1986
- Listed 14 days
Tags
Property features AI
Exterior
- Home design: Built in 1986
- Exterior features: Located in the North Fork subdivision
Neighborhood map
What this means for you Summary
Snapshot
- This is a 5-bed/4.0-bath single-family listed at $1.60M.
Deal economics
- At list price, monthly cash flow is $7k ($87k/yr) — positive.
- The deal already cash-flows at list — no discount required.
- Meets the 1% rule at list price ($22k rent vs $1.60M).
- Cap rate 11.7% vs local median 7.3% in Cutchogue — top-decile yield for the area; either an underpriced asset or a hidden risk that comps aren't pricing in. Stress-test before assuming the spread holds.
Location & tenants
- Location reads 62/100 on livability (#843 in NY) — a middle-class / working-renter tenant base. Strengths: crime A+, employment A+, housing B+; Watch: amenities F, commute F, cost of living F.
- Mattituck-Cutchogue Union Free School District (suburban): math 69% / reading 68% proficiency, ranked #127 of 590 in NY (top 22%) — acceptable for families but not a draw, mixed tenant base, ~2y average lease; only 16% free/reduced lunch — higher-income household profile.
- Market conditions: 51 active listings in the ZIP; 4 comparable units currently listed for rent nearby; rentals lingering (median 45d on market — plan ~5-8 weeks vacancy on turnover, expect pricing pressure); 100% of comp listings sitting > 30 days — soft ceiling on asking rent; 1,366 units permitted in Suffolk County in 2024 (216 in 5+ unit buildings).
Forward outlook
- In year one you build about $171k of equity ($11k loan paydown + $160k appreciation (10.0% local appreciation)).
- Suffolk County population projected to shrink 5% by 2050 — rents likely to lag national; underwrite the cash flow, not the appreciation.
- At projected returns (10.0% appreciation + 3.0% rent growth), your $448k cash investment doubles in ~2 years — after that, you're playing with house money.
- By year 2, paydown + projected appreciation supports a ~$275k cash-out refi (75% LTV) — recoverable capital for the next deal without selling this one.
Negotiation context
- Only 14 days on market — expect competitive offers; lowballing is unlikely to land.
- 2 sale attempts with the ask held roughly flat each time — persistent listings suggest the price (not the market) is what's stuck; bring a comps-based counter.
- Current owner paid $350k; list at $1.60M implies a 357% gain — meaningful room to come down on a strong offer.
Risks & watch-outs
- Climate carrying-cost: severe wind risk, 80% chance of damaging wind over 30y; extreme-heat days projected 7→19/yr by 2055 (HVAC capex compounding) — expect insurance premiums to compound above CPI over the hold.
Questions for the listing agent
- Is there a deadline driving the sale (1031 exchange, divorce, estate, relocation)? That informs how much negotiation room exists.
- Schools are B-rated — typically a magnet for longer-tenancy family renters. What's the average tenant stay here, and is there a school-zone premium baked into asking?
- What's the average days-on-market for RENTAL listings here right now (not sales)? A rising rental-DOM trend means longer vacancies and softer asking-rent achievability than the comps imply.
- What's the recent tenant-quality profile in this submarket — average credit score on applications, eviction rate, late-payment / NSF rate, and stable-employment percentage? A property-management company in the area should have these aggregated.
- How much new for-sale + rental construction is in the pipeline within 1–3 miles? Heavy new supply typically softens prices + rents 12–24 months out; constrained supply supports both.
Investment metrics
- 1% rule
- 1.38% ✓
- Cap rate
- 11.70%
- Cash-on-cash
- 19.32%
- DSCR
- 1.86
- GRM
- 6.0
CMA / ARV
- ARV (median comp)
- $1,587,634
- List price
- $1,600,000
- Delta
- -0.48%
- Verdict
- FAIR
- Comps
- 11 within 1.0 mi
Show comp detail 8 sales within ~0.75 mi
| Address | Dist | Beds/Ba | Sqft | Sold | Price | $/sf | Match |
|---|---|---|---|---|---|---|---|
| 315 Green Way | 0.10mi | 4/3.5 (-1) | 3,000 | 8mo | $1,625,000 | $542 | 69 |
| 2700 Fairway Dr | 0.03mi | 4/3.0 (-1) | 2,800 | 11mo | $1,675,000 | $598 | 68 |
| 26705 Main Rd | 0.38mi | 4/2.0 (-1) | 2,612 | 7mo | $700,000 | $268 | 51 |
| 600 Praity Ln | 0.28mi | 4/3.0 (-1) | — | 24mo | $1,400,000 | — | 46 |
| 555 Alvahs Ln | 0.44mi | 4/2.0 (-1) | 2,100 | 17mo | $1,020,000 | $486 | 40 |
| 860 Griffing St | 0.67mi | 5/3.0 | 3,326 | 15mo | $1,335,000 | $401 | 39 |
| 1760 Crown Land Ln | 0.66mi | 4/2.5 (-1) | 2,246 | 11mo | $1,515,000 | $675 | 37 |
| 12120 New Suffolk Ave | 0.73mi | 6/6.5 (+1) | 7,500 | 8mo | $11,200,000 | $1,493 | 32 |
Match score weights: distance 35% · size 25% · config 20% · recency 20%. Top-matched comps best support the ARV.
Projected returns pro-forma
10.0% appreciation · 3.0% rent growth · sell at horizon
- IRR
- 38.7%
- Equity multiple
- 3.97×
- Total profit
- $1,330,659
- Equity at exit
- $1,441,407
- IRR
- 33.3%
- Equity multiple
- 8.94×
- Total profit
- $3,557,026
- Equity at exit
- $3,108,448
Cash invested: $448,000 (down + closing). Projections, not guarantees.
Landlord ↔ Tenant lean methodology
- Overall (STATE)
- 15 Strongly Tenant-Friendly
- State New York
- 15 Strongly Tenant-Friendly · D+10
- County
- — inherits STATE
- City
- — inherits STATE
ZIP-level market 11935
- Home prices YoY
- 2.8%
- Active inventory
- 51
- Price-to-rent
- 6.0×
Monthly cashflow live
- Estimated rent
- $22,150 medium interval (Pro) →
- Mortgage (P&I)
- −$8,391
- Tax from tax record
- −$1,228 /mo · $14,736/yr
- Insurance
- −$667
- HOA
- −$0
- Vacancy / Maint / Mgmt
- −$4,651
- Net cashflow
- $7,213
Break-even live
Sensitivity live
| Price | -10% $8,119 | -5% $7,666 | +0% $7,213 | +5% $6,760 | +10% $6,307 |
|---|---|---|---|---|---|
| Rent | -10% $5,463 | -5% $6,338 | +0% $7,213 | +5% $8,088 | +10% $8,963 |
| Rate | -1.0pp $8,019 | -0.5pp $7,620 | base $7,213 | +0.5pp $6,798 | +1.0pp $6,377 |
UW: 25.0% down · 7.5% · 30yr · 1.5% tax · 5.0% vac · 8.0% maint · 8.0% mgmt
Financing live
Cash to close
- Down payment
- $400,000
- Closing costs
- $48,000
- Reserves months
- —
- Total cash needed
- —
Loan-product check · same deal, 3 products live
Conventional
25% down · 7.5% · 30yr
- Down + closing
- —
- Monthly P&I
- —
- Monthly cashflow
- —
- DSCR
- —
- Eligible?
- —
Personal DTI + credit; lowest rate.
DSCR
20% down · 8.5% · 30yr
- Down + closing
- —
- Monthly P&I
- —
- Monthly cashflow
- —
- DSCR
- —
- Eligible?
- —
No personal income docs; deal must DSCR.
Hard money
10% down · 12.0% · 12mo
- Down + closing
- —
- Monthly P&I
- —
- Monthly cashflow
- —
- DSCR
- —
- Eligible?
- —
Short-term bridge; refi at stabilization.
Rent comps 4 comps
| Address | Beds | Baths | Sqft | Rent | $/sqft | DOM | Units | Dist |
|---|---|---|---|---|---|---|---|---|
| 1100 Alvahs Ln Cutchogue, NY | 4.0 | 4.0 | 2400 | $24,200 | $10.08 | 44d | 1 | 0.57mi |
| 935 Southern Cross Rd Cutchogue, NY | 4.0 | 4.0 | — | $22,500 | — | 44d | 1 | 1.02mi |
| 19000 Main Rd Mattituck, NY | 4.0 | 2.5 | 2000 | $15,000 | $7.50 | 44d | 1 | 1.35mi |
| 600 Harbor Ln Cutchogue, NY | 4.0 | 3.0 | — | $24,000 | — | 44d | 1 | 1.39mi |
Listing history 16 events
-
2026-06-21days on market $1,600,000 Active 14 DOM
-
2026-06-18days on market $1,600,000 Active 12 DOM
-
2026-06-17days on market $1,600,000 Active 11 DOM
-
2026-06-16days on market $1,600,000 Active 10 DOM
-
2026-06-15days on market $1,600,000 Active 9 DOM
-
2026-06-13days on market $1,600,000 Active 7 DOM
-
2026-06-12days on market $1,600,000 Active 6 DOM
-
2026-06-09days on market $1,600,000 Active 3 DOM
-
2026-06-08days on market $1,600,000 Active 2 DOM
-
2026-06-07pricedays on market $1,600,000 Active 1 DOM
-
2026-06-04days on market $1,580,000 Active 196 DOM
-
2026-06-02days on market $1,580,000 Active 195 DOM
-
2026-06-01days on market $1,580,000 Active 194 DOM
-
2026-05-31days on market $1,580,000 Active 193 DOM
-
2025-11-19$1,580,000 Active 1467-char remark
-
1996-12-18soldstatus $350,000
ⓘ Source: listings_history table (triggers on properties + properties_extension) + one-shot
backfill from property_details.listing_events for pre-trigger history.
Tax reassessment forecast NY · Partial reset (capped growth)
- Current annual tax
- $14,736 · $1,228/mo
- Projected year-2 tax
- $20,888 · $1,741/mo
- Expected delta
- +$6,152/yr (+$513/mo · 41.8%)
ⓘ Screening estimate from a state-policy table — verify with the county assessor before closing.
Climate risk First Street
- Flood 1/10 Low FEMA zone X (unshaded) · 0% chance over 30 yrs
- Wildfire 1/10 Low
- Heat 5/10 Major 7 d/yr ≥91°F today · 19 d/yr by 30 yrs out
- Wind 8/10 Severe 80% chance of damaging wind over 30 yrs
- Air quality 3/10 Moderate 2 unhealthy d/yr today · 3 by 30 yrs out
Nearby sold comps map
Loading sold comps map…
Walkable amenities ~0.75 mi
Loading nearby amenities…
Taxation est. · year 1
- Rental income
- $265,795
- − Mortgage interest
- −$89,625
- − Property taxes
- −$14,736
- − Insurance
- −$8,000
- − Repairs & maintenance
- −$21,264
- − Management
- −$21,264
- − Depreciation
- −$46,545
- Taxable income
- $64,362
- Est. tax owed @ 24.0%
- −$15,447
- After-tax cash flow
- $71,109/yr
For passive investors: Depreciation is non-cash, so a rental often shows a tax loss while cash-flowing — sheltering income. Rental losses are passive: they offset passive income freely, and up to $25,000/yr can offset ordinary (W-2) income if you actively participate and your MAGI is under $100k (phasing out to $0 by $150k); unused losses carry forward. On sale, claimed depreciation is recaptured at up to 25%, and gains may owe capital-gains tax (a 1031 exchange can defer both). Figures are a year-1 estimate at your 24.0% rate — not tax advice; consult a CPA.
Schools (NCES district)
- District
- Mattituck-Cutchogue Union Free School District
- NCES district ID
- 3600021
- Math proficiency
- 69% ▼ -3.00%
- Reading proficiency
- 68% ▲ 4.00%
- Median HH income
- $84,164
- Composite
- 61.4/100
- National rank
- #765
- State rank
- #127 of 590 in NY
Livability — Cutchogue
- Score
- 62/100
- State rank
- #843
- US rank
- #16353
Category grades
Schools grade is shown separately in the Schools card above.
Census & demographics
- Census place
- Cutchogue, NY
- City population
- 2,946
- Population (ZIP)
- 2,946
Population outlook (Suffolk County) Hauer SSP2
- Today (2025)
- 1,505,262 people
- By 2030
- 1,498,318 · -0.5%
- By 2040
- 1,471,101 · -2.3%
- By 2050
- 1,424,848 · -5.3%
- By 2075
- 1,337,157 · -11.2%
- By 2100
- 1,217,720 · -19.1%
Race, ethnicity, and origin ACS 2023
- Neighborhood character
- Predominantly White (92%)
- Race & ethnicity
- White 92% Two or more races 6% Hispanic / Latino 6%
- Hispanic origin (detail)
- Puerto Rican 2% Cuban 1%
- Common ancestry
- Romanian 10% Scotch-Irish 1% Lithuanian 1%
- Foreign-born
- 9% · Canada, China
- Languages at home
- 87% English-only · Other Indo-European 5% German/W. Germanic 3% Spanish 3%
Political lean MEDSL · Suffolk
- 2024 margin
- Lean R (+10.0) · D 45.0% · R 55.0%
- 2008→2024 swing
- -16.0pp toward R · 2008: 6.0pp · 2024: -10.0pp
- All cycles
- 2024: R+10.0 2020: R+0.0 2016: R+8.2 2012: D+2.9 2008: D+6.0
Not yet ingested
- Civics
- —
Market trends
- HPI YoY
- ▲ 12.82%
- Current HPI
- 467.3019
- Rent YoY
- —
- Metro
- —
- State GDP YoY
- ▲ 2.60%
- F500 in state
- 92
Industry mix (Fortune 500 HQ in NY)
| Industry | F500 HQs | Revenue |
|---|---|---|
| Financial Services | 10 | $950B |
|
||
| Consumer Goods | 9 | $162B |
|
||
| Insurance | 4 | $225B |
|
||
| Telecommunications | 2 | $144B |
|
||
| Pharmaceuticals | 2 | $112B |
|
||
| Media / Entertainment | 2 | $69B |
|
||
Price history
+357.1% since first listed4 events — show timeline
- 2026-06-07 Listed $1,600,000 FSBO.com
- 2026-06-05 Listing Removed — OneKey® MLS as Distributed by MLS Grid
- 2025-11-19 Listed $1,580,000 OneKey® MLS as Distributed by MLS Grid
- 1996-12-18 Sold (Public Records) $350,000 Public Records
Property tax history
+0.8%/yrLatest (2025): $14,736 · +0.0% YoY. Source: county tax records.
Cash-flow waterfall
monthlySold comps — $/sqft
last 12 mo · ≤1 miLoading sold comps…