302 Parkwood Ave · Columbus, OH
Flood risk 1/10 · Minimal
- FEMA flood zone
- X (unshaded)
- Chance of flooding over 30 yrs
- 0.0%
- Est. flood insurance / yr
- $507 – $1,088
Fire risk 1/10 · Minimal
- Est. fire insurance / yr
- $713 – $1,323
Heat risk 4/10 · Minor
- Hot days now (above 100°F)
- 7 days/yr
- Hot days in 30 yrs
- 18 days/yr
Wind risk 2/10 · Minimal
- Chance of severe wind over 30 yrs
- 1.0%
Air-quality risk 3/10 · Minor
- Unhealthy air days now
- 2 days/yr
- Unhealthy air days in 30 yrs
- 4 days/yr
Risk factors via First Street. Map © Google.
Why this score? — see what drove the B+ grade
The composite is a weighted blend of 9 inputs, each scored 0–100. Each bar is that input's sub-score; the figure is the points it added to the 100-point composite (weight × sub-score).
- Cash flow +30.0/30.0
- ARV discount +15.0/15.0
- DSCR +10.0/10.0
- 1% rule +9.8/10.0
- Livability +4.0/5.0
- Rent growth +3.8/5.0
- Condition / age +2.5/5.0
- Schools +1.7/10.0
- Appreciation +0.0/10.0
$85,000
🖨 Deal sheet (PDF) 📄 Offer letter ✓ Due diligence
Listing remarks
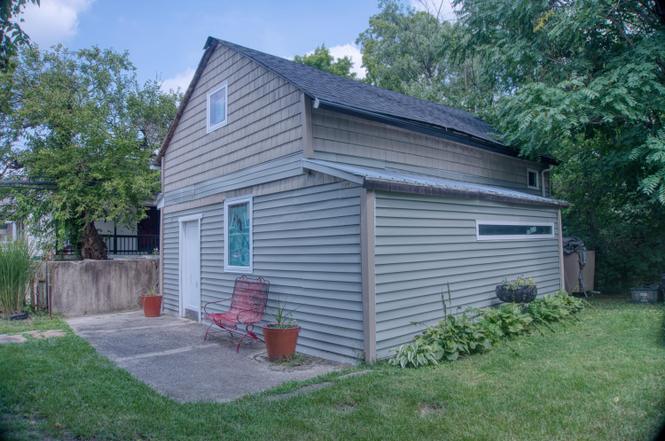
INVESTORS AND DEVELOPERS!!! Your chance to acquire this beautiful lot perfect for land development! Located in the coveted Woodland Park area this property is surrounded by victorian styled mansions and is a no brainer when considering building. The lot has a carriage house that has been fully renovated on the outside and boast a new roof, new siding and new windows etc and the inside is gutted and ready for your imagination.
Key facts
- Fully renovated
- New siding
- Woodland park area
Tags
Property features AI
Exterior
- Parking: On-street parking
- Utilities: Public water; Public sewer
- Home design: Single family residence; Two levels; Built in 1946; No shared/common walls
- Construction: Block foundation; Built in 1946
- Exterior features: Block foundation; Outbuilding on the property; Lot approximately 0.08 acres
Interior
- Bathrooms: 1 full bathroom
- Interior features: Insulated windows throughout; 908 building area (living space listed)
Neighborhood map
What this means for you Summary
Snapshot
- This is a 2-bed/1.0-bath single-family listed at $85k.
Deal economics
- At list price, monthly cash flow is $321 ($4k/yr) — positive.
- The deal already cash-flows at list — no discount required.
- Meets the 1% rule at list price ($1k rent vs $85k).
- Cap rate 10.8% vs local median 3.8% in Columbus — top-decile yield for the area; either an underpriced asset or a hidden risk that comps aren't pricing in. Stress-test before assuming the spread holds.
Location & tenants
- Location reads 81/100 on livability (#97 in OH, #1,491 nationally) — a professional / high-income tenant draw. Strengths: commute A+, cost of living A+, housing A+; Watch: employment C-, crime F.
- Columbus City School District (urban): math 15% / reading 26% proficiency, ranked #626 of 656 in OH (top 95%) — low school quality limits family demand, transient renter base, plan for 1-2y turnover; 72% free/reduced lunch — lower-income household profile, screen leases tightly.
- Market conditions: Rents rising fast (+5.0%/yr); 95 active listings in the ZIP; 40 comparable units currently listed for rent nearby; rentals at typical pace (median 25d on market — plan ~3-4 weeks tenant-placement turnaround); 8,139 units permitted in Franklin County in 2024 (5,940 in 5+ unit buildings).
- This rent runs 32% of the median local income ($48k/yr) — at the standard rent-burdened threshold; future hikes will face affordability resistance.
Forward outlook
- Local home prices are declining (-3.0%/yr); year-one equity from $588 of loan paydown is wiped out by about $3k of value loss. Plan a longer hold.
- Franklin County population projected at +34% by 2050 — long-run rental-demand tailwind backs the buy-and-hold thesis.
- At projected returns (-3.0% appreciation + 5.0% rent growth), your $24k cash investment doubles in ~7 years — after that, you're playing with house money.
Negotiation context
- Only 4 days on market — expect competitive offers; lowballing is unlikely to land.
- 4 sale attempts since 13y ago with the ask held roughly flat each time — persistent listings suggest the price (not the market) is what's stuck; bring a comps-based counter.
Risks & watch-outs
- Watch-outs: property tax is 2.7% of price; built in 1946 — expect roof / HVAC / electrical / plumbing capex.
Questions for the listing agent
- Built in 1946 — when were the roof, HVAC, electrical panel, plumbing, and water heater last replaced?
- Property tax is high relative to price — has the assessment been appealed recently, and will the sale trigger a re-assessment?
- Is there a deadline driving the sale (1031 exchange, divorce, estate, relocation)? That informs how much negotiation room exists.
- Crime grade is F in this area — have there been break-ins, vandalism, or insurance claims at this property in the last 3 years? What carrier currently insures it and at what premium?
- What's the average days-on-market for RENTAL listings here right now (not sales)? A rising rental-DOM trend means longer vacancies and softer asking-rent achievability than the comps imply.
- What's the recent tenant-quality profile in this submarket — average credit score on applications, eviction rate, late-payment / NSF rate, and stable-employment percentage? A property-management company in the area should have these aggregated.
- How much new for-sale + rental construction is in the pipeline within 1–3 miles? Heavy new supply typically softens prices + rents 12–24 months out; constrained supply supports both.
Investment metrics
- 1% rule
- 1.48% ✓
- Cap rate
- 10.83%
- Cash-on-cash
- 16.20%
- DSCR
- 1.72
- GRM
- 5.6
CMA / ARV
- ARV (on-the-fly)
- $108,052
- Comps found
- 7
Show comp detail 7 sales within ~0.75 mi
| Address | Dist | Beds/Ba | Sqft | Sold | Price | $/sf | Match |
|---|---|---|---|---|---|---|---|
| 455 Johnson St | 0.28mi | 3/1.5 (+1) | 847 (-7%) | 7mo | $92,000 | $109 | 63 |
| 1418 Phale D Hale Dr | 0.31mi | 3/1.0 (+1) | 968 (+7%) | 17mo | $115,000 | $119 | 56 |
| 799 Taylor Ave | 0.68mi | 2/1.0 | 890 (-2%) | 22mo | $139,000 | $156 | 47 |
| 1882 Stratford Way | 0.39mi | 3/1.5 (+1) | 999 (+10%) | 18mo | $213,500 | $214 | 43 |
| 452 N Ohio Ave | 0.57mi | 2/1.0 | 1,032 (+14%) | 16mo | $100,000 | $97 | 38 |
| 823 Bassett Ave | 0.73mi | 3/1.0 (+1) | 810 (-11%) | 9mo | $80,000 | $99 | 36 |
| 1853 Arborfield Pl | 0.36mi | 3/2.0 (+1) | 1,044 (+15%) | 23mo | $181,000 | $173 | 30 |
Match score weights: distance 35% · size 25% · config 20% · recency 20%. Top-matched comps best support the ARV.
Projected returns pro-forma
-3.0% appreciation · 5.03% rent growth · sell at horizon
- IRR
- 9.8%
- Equity multiple
- 1.39×
- Total profit
- $9,394
- Equity at exit
- $12,674
- IRR
- 20.7%
- Equity multiple
- 2.94×
- Total profit
- $46,069
- Equity at exit
- $7,349
Cash invested: $23,800 (down + closing). Projections, not guarantees.
Landlord ↔ Tenant lean methodology
- Overall (STATE)
- 73 Landlord-Friendly
- State Ohio
- 73 Landlord-Friendly · R+6
- County
- — inherits STATE
- City
- — inherits STATE
ZIP-level market 43203
- Home prices YoY
- -31.9%
- Rents YoY
- 5.0%
- Active inventory
- 95
- Price-to-rent
- 5.6×
Monthly cashflow live
- Estimated rent
- $1,261 high interval (Pro) →
- Mortgage (P&I)
- −$446
- Tax from tax record
- −$193 /mo · $2,321/yr
- Insurance
- −$35
- HOA
- −$0
- Vacancy / Maint / Mgmt
- −$265
- Net cashflow
- $321
Break-even live
Sensitivity live
| Price | -10% $369 | -5% $345 | +0% $321 | +5% $297 | +10% $273 |
|---|---|---|---|---|---|
| Rent | -10% $222 | -5% $272 | +0% $321 | +5% $371 | +10% $421 |
| Rate | -1.0pp $364 | -0.5pp $343 | base $321 | +0.5pp $299 | +1.0pp $277 |
UW: 25.0% down · 7.5% · 30yr · 1.5% tax · 5.0% vac · 8.0% maint · 8.0% mgmt
Financing live
Cash to close
- Down payment
- $21,250
- Closing costs
- $2,550
- Reserves months
- —
- Total cash needed
- —
Loan-product check · same deal, 3 products live
Conventional
25% down · 7.5% · 30yr
- Down + closing
- —
- Monthly P&I
- —
- Monthly cashflow
- —
- DSCR
- —
- Eligible?
- —
Personal DTI + credit; lowest rate.
DSCR
20% down · 8.5% · 30yr
- Down + closing
- —
- Monthly P&I
- —
- Monthly cashflow
- —
- DSCR
- —
- Eligible?
- —
No personal income docs; deal must DSCR.
Hard money
10% down · 12.0% · 12mo
- Down + closing
- —
- Monthly P&I
- —
- Monthly cashflow
- —
- DSCR
- —
- Eligible?
- —
Short-term bridge; refi at stabilization.
Rent comps 40 comps
| Address | Beds | Baths | Sqft | Rent | $/sqft | DOM | Units | Dist |
|---|---|---|---|---|---|---|---|---|
| 1608 Greenway Ave Columbus, OH | 2.0 | 2.0 | 900 | $1,299 | $1.44 | 17d | 1 | 0.03mi |
| 1608 Greenway Ave Columbus, OH | 2.0 | 2.0 | 900 | $1,899 | $2.11 | 18d | 1 | 0.03mi |
| 1608 Greenway Ave Columbus, OH | 1.0 | 1.0 | 750 | $1,199 | $1.60 | 13d | 1 | 0.03mi |
| 1608 Greenway Ave Columbus, OH | 1.0 | 1.0 | 750 | $1,199 | $1.60 | 4d | 1 | 0.03mi |
| 304 Woodland Ave Columbus, OH | 1.0 | 1.0 | 750 | $1,199 | $1.60 | 44d | 1 | 0.13mi |
| 439 Eldridge Ave Unit 439 Columbus, OH | 3.0 | 1.0 | 946 | $1,200 | $1.27 | 24d | 1 | 0.17mi |
| 1614 Clifton Ave Unit 1620 Columbus, OH | 2.0 | 1.0 | 875 | $1,349 | $1.54 | 24d | 1 | 0.18mi |
| 1731 Richmond Ave Columbus, OH | 2.0 | 1.0 | 610 | $910 | $1.49 | 44d | 1 | 0.23mi |
| 476 Taylor Ave Columbus, OH | 1.0–2.0 | 1.0–2.0 | 699 | $1,695 | $2.42 | 4d | 8 | 0.24mi |
| 1744 Richmond Ave Columbus, OH | 2.0 | 1.0 | 610 | $910 | $1.49 | 44d | 1 | 0.24mi |
| 1750 Clifton Ave Columbus, OH | 1.0–2.0 | 1.0 | 555 | $875 | $1.58 | 4d | 5 | 0.27mi |
| 195 Clifton Ct Columbus, OH | 2.0 | 1.0 | 610 | $875 | $1.43 | 4d | 1 | 0.27mi |
| 196 Clifton Ct Columbus, OH | 2.0 | 1.0 | 610 | $910 | $1.49 | 44d | 1 | 0.30mi |
| 1769 Clifton Ave Columbus, OH | 2.0 | 1.0 | 610 | $875 | $1.43 | 4d | 1 | 0.33mi |
| 1738 E Long St Columbus, OH | 2.0 | 1.0 | 665 | $1,018 | $1.53 | 2d | 4 | 0.34mi |
| 1732 E Long St Columbus, OH | 2.0 | 1.0 | 665 | $995 | $1.50 | 44d | 1 | 0.38mi |
| 40 Parkwood Ave Columbus, OH | 1.0 | 1.0 | 525 | $1,150 | $2.19 | 44d | 1 | 0.43mi |
| 1550 E Broad St Columbus, OH | 2.0 | 1.0 | 875 | $1,175 | $1.34 | 44d | 1 | 0.46mi |
| 1544 E Broad St Unit 1544-305 Columbus, OH | 1.0 | 1.0 | 615 | $1,015 | $1.65 | 44d | 1 | 0.46mi |
| 1544 E Broad St Unit 303 Columbus, OH | 2.0 | 1.0 | 875 | $1,122 | $1.28 | 44d | 1 | 0.46mi |
| 1544 E Broad St Unit 1544-303 Columbus, OH | 2.0 | 1.0 | 875 | $1,122 | $1.28 | 8d | 1 | 0.46mi |
| 1216 Atcheson St Columbus, OH | 3.0 | 2.0 | 1092 | $1,550 | $1.42 | 4d | 1 | 0.59mi |
| 1445 E Broad St Columbus, OH | 1.0–5.0 | 1.0–5.0 | 2164 | $1,504 | $0.70 | 2d | 4 | 0.60mi |
| 1444 Madison Ave Unit B Columbus, OH | 2.0 | 1.0 | 800 | $1,165 | $1.46 | 22d | 1 | 0.64mi |
| 45 Governors Pl Unit 3 Columbus, OH | 1.0 | 1.0 | 601 | $960 | $1.60 | 24d | 1 | 0.71mi |
| 45 Governors Pl Unit 14 Columbus, OH | 1.0 | 1.0 | 601 | $960 | $1.60 | 44d | 1 | 0.71mi |
| 62 N Ohio Ave Unit 3rd floor Columbus, OH | 1.0 | 1.0 | 600 | $1,295 | $2.16 | 44d | 1 | 0.73mi |
| 196 Miller Ave Columbus, OH | 2.0 | 2.0 | 1000 | $1,250 | $1.25 | 44d | 1 | 0.78mi |
| 1309 Fair Ave Columbus, OH | 1.0 | 1.0 | 750 | $899 | $1.20 | 24d | 1 | 0.80mi |
| 1309 Fair Ave Columbus, OH | 2.0 | 1.0 | 850 | $1,050 | $1.24 | 8d | 1 | 0.80mi |
| 1599 Oak St Columbus, OH | 2.0 | 1.0–2.0 | 793 | $1,802 | $2.27 | 24d | 14 | 0.83mi |
| 243 Miller Ave Unit 243 Columbus, OH | 2.0 | 1.0 | 980 | $1,375 | $1.40 | 44d | 1 | 0.87mi |
| 61 N 21st St Unit J Columbus, OH | 2.0 | 1.0 | 738 | $995 | $1.35 | 44d | 1 | 0.89mi |
| 143 Sherman Ave Columbus, OH | 2.0 | 1.0 | 919 | $1,588 | $1.73 | 24d | 2 | 0.89mi |
| 151 Sherman Ave Unit 101 Columbus, OH | 2.0 | 1.0 | 981 | $1,675 | $1.71 | 24d | 1 | 0.90mi |
| 151 Sherman Ave #102 Columbus, OH | 2.0 | 1.0 | 970 | $1,675 | $1.73 | 24d | 1 | 0.90mi |
| 151 Sherman Ave Unit 101 Columbus, OH | 2.0 | 1.0 | 981 | $1,675 | $1.71 | 22d | 1 | 0.90mi |
| 151 Sherman Ave #001 Columbus, OH | 1.0 | 1.0 | 835 | $1,199 | $1.44 | 44d | 1 | 0.90mi |
| 151 Sherman Ave #001 Columbus, OH | 1.0 | 1.0 | 835 | $1,199 | $1.44 | 24d | 1 | 0.90mi |
| 1001 Atcheson St Columbus, OH | 1.0–2.0 | 1.0 | 821 | $1,295 | $1.58 | 3d | 16 | 0.90mi |
Listing history 3 events
-
2026-06-21days on market $85,000 Active 4 DOM
-
2026-06-17remarks 429-char remark
-
2026-06-17$85,000 Active 1 DOM
ⓘ Source: listings_history table (triggers on properties + properties_extension) + one-shot
backfill from property_details.listing_events for pre-trigger history.
Tax reassessment forecast OH · Partial reset (capped growth)
- Current annual tax
- $2,321 · $193/mo
- Projected year-2 tax
- $2,321 · $193/mo
- Expected delta
- $0/yr ($0/mo · 0.0%)
ⓘ Screening estimate from a state-policy table — verify with the county assessor before closing.
Climate risk First Street
- Flood 1/10 Low FEMA zone X (unshaded) · 0% chance over 30 yrs
- Wildfire 1/10 Low
- Heat 4/10 Moderate 7 d/yr ≥100°F today · 18 d/yr by 30 yrs out
- Wind 2/10 Low 100% chance of damaging wind over 30 yrs
- Air quality 3/10 Moderate 2 unhealthy d/yr today · 4 by 30 yrs out
Nearby sold comps map
Loading sold comps map…
Walkable amenities ~0.75 mi
Loading nearby amenities…
Taxation est. · year 1
- Rental income
- $15,129
- − Mortgage interest
- −$4,761
- − Property taxes
- −$2,321
- − Insurance
- −$425
- − Repairs & maintenance
- −$1,210
- − Management
- −$1,210
- − Depreciation
- −$2,473
- Taxable income
- $2,728
- Est. tax owed @ 24.0%
- −$655
- After-tax cash flow
- $3,202/yr
For passive investors: Depreciation is non-cash, so a rental often shows a tax loss while cash-flowing — sheltering income. Rental losses are passive: they offset passive income freely, and up to $25,000/yr can offset ordinary (W-2) income if you actively participate and your MAGI is under $100k (phasing out to $0 by $150k); unused losses carry forward. On sale, claimed depreciation is recaptured at up to 25%, and gains may owe capital-gains tax (a 1031 exchange can defer both). Figures are a year-1 estimate at your 24.0% rate — not tax advice; consult a CPA.
Schools (NCES district)
- District
- Columbus City School District
- NCES district ID
- 3904380
- Math proficiency
- 15% ▼ -17.00%
- Reading proficiency
- 26% ▼ -12.00%
- Median HH income
- $38,483
- Composite
- 17.19/100
- National rank
- #9105
- State rank
- #626 of 656 in OH
Livability — Columbus
- Score
- 81/100
- State rank
- #97
- US rank
- #1491
Category grades
Schools grade is shown separately in the Schools card above.
Census & demographics
- Census place
- Columbus, OH
- County
- Franklin County · 1,351,780 people
- City population
- 612,189
- Metro
- Columbus, OH
- Population (ZIP)
- 8,618
- Household income
- $47,572
- Rent vs Own
- Severe rent burden
- 859.0
Population outlook (Franklin County) Hauer SSP2
- Today (2025)
- 1,456,139 people
- By 2030
- 1,556,890 · +6.9%
- By 2040
- 1,757,349 · +20.7%
- By 2050
- 1,950,539 · +34.0%
- By 2075
- 2,376,171 · +63.2%
- By 2100
- 2,636,796 · +81.1%
Race, ethnicity, and origin ACS 2023
- Neighborhood character
- Diverse neighborhood (Simpson 0.56)
- Race & ethnicity
- Black 59% White 29% Two or more races 8% Hispanic / Latino 2% Asian 2%
- Common ancestry
- Lithuanian 1% Romanian 1% Swiss 1%
- Foreign-born
- 12% · Canada
- Languages at home
- 86% English-only · Other Indo-European 1% Spanish 1% French/Haitian/Cajun 1%
Political lean MEDSL · Franklin
- 2024 margin
- Strong D (+28.4) · D 63.7% · R 35.3% · Other 1.0%
- 2008→2024 swing
- +7.7pp toward D · 2008: 20.7pp · 2024: 28.4pp
- All cycles
- 2024: D+28.4 2020: D+31.4 2016: D+25.9 2012: D+21.7 2008: D+20.7
Not yet ingested
- Civics
- —
Market trends
- HPI YoY
- ▼ -102.09%
- Current HPI
- 217.3929
- Rent YoY
- ▲ 5.03%
- Metro
- Columbus, OH
- State GDP YoY
- ▲ 1.98%
- F500 in state
- 48
Industry mix (Fortune 500 HQ in OH)
| Industry | F500 HQs | Revenue |
|---|---|---|
| Insurance | 3 | $145B |
|
||
| Industrial Machinery | 3 | $49B |
|
||
| Financial Services | 3 | $24B |
|
||
| Consumer Goods | 2 | $93B |
|
||
| Aerospace / Defense | 2 | $47B |
|
||
| Utilities | 2 | $33B |
|
||
Price history
+2030.3% since first listed8 events — show timeline
- 2026-06-17 Listed $85,000 CBRMLS
- 2024-05-26 Listing Removed — CBRMLS
- 2024-04-23 Relisted — CBRMLS
- 2024-02-22 Listing Removed — CBRMLS
- 2023-08-26 Listed $126,000 CBRMLS
- 2023-08-22 Coming Soon — CBRMLS
- 2013-11-21 Listing Removed — CBRMLS
- 2013-10-30 Listed $3,990 CBRMLS
Property tax history
+20.1%/yrLatest (2024): $2,321 · +1.3% YoY. Source: county tax records.
Cash-flow waterfall
monthlySold comps — $/sqft
last 12 mo · ≤1 miLoading sold comps…