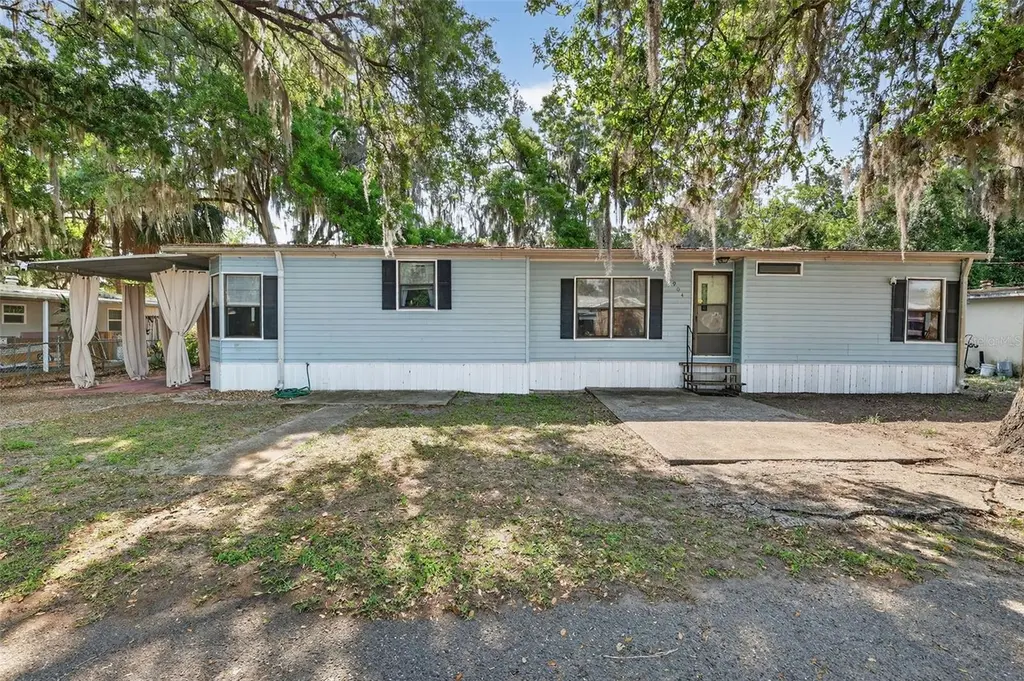
904 Maplewood St · Tavares, FL
Flood risk 4/10 · Minor
- FEMA flood zone
- X (unshaded)
- Chance of flooding over 30 yrs
- 0.22%
- Est. flood insurance / yr
- $507 – $1,088
Fire risk 3/10 · Minor
- Est. fire insurance / yr
- $947 – $1,759
Heat risk 8/10 · Major
- Hot days now (above 107°F)
- 7 days/yr
- Hot days in 30 yrs
- 21 days/yr
Wind risk 9/10 · Severe
- Chance of severe wind over 30 yrs
- 99.0%
Air-quality risk 2/10 · Minimal
- Unhealthy air days now
- 1 days/yr
- Unhealthy air days in 30 yrs
- 1 days/yr
Risk factors via First Street. Map © Google.
Why this score? — see what drove the C+ grade
The composite is a weighted blend of 9 inputs, each scored 0–100. Each bar is that input's sub-score; the figure is the points it added to the 100-point composite (weight × sub-score).
- Cash flow +26.1/30.0
- DSCR +8.8/10.0
- ARV discount +7.5/15.0
- 1% rule +6.3/10.0
- Schools +4.2/10.0
- Livability +3.8/5.0
- Rent growth +3.5/5.0
- Condition / age +2.5/5.0
- Appreciation +0.0/10.0
$170,900
🖨 Deal sheet 📄 Offer letter ✓ Due diligence
Listing remarks
This is no doubt the greatest value in this neighborhood! Fall in love with this beautifully maintained 3-bedroom, 2-bath double-wide home on an oversized lot in Tavares. Featuring a functional layout, generous living space, and ample outdoor room for expansion, recreation, gardening or storage. Perfect for buyers seeking affordability without sacrificing space. Don’t miss this opportunity!
Key facts
- 5,597 sq ft lot
- Built 1991
- Listed 85 days
Property features AI
Finance
- Other: Property type: Residential (manufactured home); Lot: approximately 0.13 acres (80 x 63); Living area: 1,496 sq ft (per public records); Zoning: RMH-S; Homestead status: Homestead exempt; Furnished: Unfurnished; Direction faces: West
- HOA & community: No HOA association listed
Exterior
- Utilities: Public water; No sewer (none listed); Cable available; Electricity available and connected; Public utilities
- Home design: Manufactured double-wide home; Single-story (one level); Faces west; Stilt/on piling foundation
- Construction: Metal frame construction; Metal siding; Vinyl siding; Metal roof; Built on stilt/piling foundation
- Exterior features: Private mailbox; Asphalt road access
Interior
- Kitchen: Cooktop; Microwave; Refrigerator
- Bedrooms: 3 bedrooms
- Flooring: Carpet; Vinyl
- Bathrooms: 2 full bathrooms
- Heating & cooling: Central heating; Central air conditioning
- Interior features: Ceiling fans; Split-bedroom layout; Total of 9 rooms
- Laundry & utility: Laundry closet
Neighborhood map
What this means for you Summary
Snapshot
- This is a 3-bed/2.0-bath manufactured listed at $171k.
Deal economics
- At list price, monthly cash flow is $429 ($5k/yr) — positive.
- The deal already cash-flows at list — no discount required.
- Meets the 1% rule at list price ($2k rent vs $171k).
- Recommended offer: $161k (6.0% below list) — sets the bar for market timing.
- Cap rate 9.3% vs local median 4.5% in Tavares — top-decile yield for the area; either an underpriced asset or a hidden risk that comps aren't pricing in. Stress-test before assuming the spread holds.
Location & tenants
- Location reads 76/100 on livability (#220 in FL, #3,464 nationally) — a middle-class / working-renter tenant base. Strengths: crime A+, cost of living A+, housing A+; Watch: employment D, amenities F, commute F.
- Lake (suburban): math 49% / reading 50% proficiency, ranked #37 of 73 in FL (top 51%) — families likely to look elsewhere, expect single-tenant / working-renter base with shorter leases.
- Zoned schools: Tavares Elementary School (math 49% / reading 45%, grade D-, #1,191 of 2,144 statewide, top 57%, 875 students, 61% FRL); Tavares High School (math 32% / reading 40%, grade F, #359 of 667 statewide, top 55%, 1,507 students, 45% FRL) — zoned schools at 53% FRL track the district average.
- Market conditions: Rents rising fast (+4.0%/yr); 501 active listings in the ZIP; 13 comparable units currently listed for rent nearby; rentals at typical pace (median 24d on market — plan ~3-4 weeks tenant-placement turnaround); 4,799 units permitted in Lake County in 2024 (814 in 5+ unit buildings).
- This rent runs 36% of the median local income ($63k/yr) — at the standard rent-burdened threshold; future hikes will face affordability resistance.
Forward outlook
- Local home prices are declining (-3.0%/yr); year-one equity from $1k of loan paydown is wiped out by about $5k of value loss. Plan a longer hold.
- Lake County population projected at +37% by 2050 — long-run rental-demand tailwind backs the buy-and-hold thesis.
- At projected returns (-3.0% appreciation + 4.0% rent growth), your $48k cash investment doubles in ~10 years — after that, you're playing with house money.
Negotiation context
- It's been on market 85 days — a 6% lower offer ($161k) is reasonable based on typical stale-listing flexibility.
Risks & watch-outs
- Climate carrying-cost: severe wind risk, 99% chance of damaging wind over 30y; extreme-heat days projected 7→21/yr by 2055 (HVAC capex compounding) — expect insurance premiums to compound above CPI over the hold.
Questions for the listing agent
- It's been on market 85 days. Have you received any prior offers? Is the seller open to a 6% concession, seller financing, or rate buy-down credit?
- Why hasn't it sold? Are there any deal-killer items the seller is aware of (foundation, flood, title, zoning, code violations)?
- Is there a deadline driving the sale (1031 exchange, divorce, estate, relocation)? That informs how much negotiation room exists.
- What's the average days-on-market for RENTAL listings here right now (not sales)? A rising rental-DOM trend means longer vacancies and softer asking-rent achievability than the comps imply.
- What's the recent tenant-quality profile in this submarket — average credit score on applications, eviction rate, late-payment / NSF rate, and stable-employment percentage? A property-management company in the area should have these aggregated.
- How much new for-sale + rental construction is in the pipeline within 1–3 miles? Heavy new supply typically softens prices + rents 12–24 months out; constrained supply supports both.
Investment metrics
- 1% rule
- 1.13% ✓
- Cap rate
- 9.30%
- Cash-on-cash
- 10.75%
- DSCR
- 1.48
- GRM
- 7.4
CMA / ARV
No comps found within radius.
Projected returns pro-forma
-3.0% appreciation · 4.05% rent growth · sell at horizon
- IRR
- 0.9%
- Equity multiple
- 1.03×
- Total profit
- $1,644
- Equity at exit
- $25,482
- IRR
- 11.5%
- Equity multiple
- 1.94×
- Total profit
- $45,120
- Equity at exit
- $14,776
Cash invested: $47,852 (down + closing). Projections, not guarantees.
Landlord ↔ Tenant lean methodology
- Overall (STATE)
- 87 Strongly Landlord-Friendly
- State Florida
- 87 Strongly Landlord-Friendly · R+3
- County
- — inherits STATE
- City
- — inherits STATE
ZIP-level market 32778
- Home prices YoY
- -23.4%
- Rents YoY
- 4.0%
- Active inventory
- 501
- Price-to-rent
- 7.4×
Monthly cashflow live
- Estimated rent
- $1,928 high interval (Pro) →
- Mortgage (P&I)
- −$896
- Tax from tax record
- −$127 /mo · $1,528/yr
- Insurance
- −$71
- HOA
- −$0
- Vacancy / Maint / Mgmt
- −$405
- Net cashflow
- $429
Break-even live
UW: 25.0% down · 7.5% · 30yr · 1.5% tax · 5.0% vac · 8.0% maint · 8.0% mgmt
Financing live
Cash to close
- Down payment
- $42,725
- Closing costs
- $5,127
- Reserves months
- —
- Total cash needed
- —
Loan-product check · same deal, 3 products live
Conventional
25% down · 7.5% · 30yr
- Down + closing
- —
- Monthly P&I
- —
- Monthly cashflow
- —
- DSCR
- —
- Eligible?
- —
Personal DTI + credit; lowest rate.
DSCR
20% down · 8.5% · 30yr
- Down + closing
- —
- Monthly P&I
- —
- Monthly cashflow
- —
- DSCR
- —
- Eligible?
- —
No personal income docs; deal must DSCR.
Hard money
10% down · 12.0% · 12mo
- Down + closing
- —
- Monthly P&I
- —
- Monthly cashflow
- —
- DSCR
- —
- Eligible?
- —
Short-term bridge; refi at stabilization.
Rent comps 13 comps
| Address | Beds | Baths | Sqft | Rent | $/sqft | DOM | Units | Dist |
|---|---|---|---|---|---|---|---|---|
| 123 N Lake Ave Tavares, FL | 2.0 | 1.0 | 1120 | $1,595 | $1.42 | 24d | 1 | 0.42mi |
| 1585 Dead River Rd Tavares, FL | 3.0 | 2.0 | 1053 | $1,990 | $1.89 | 24d | 1 | 0.46mi |
| 465 Oak Dr Tavares, FL | 3.0 | 3.0 | 1550 | $1,750 | $1.13 | 24d | 1 | 0.48mi |
| 459 E Rosewood Ln #157 Tavares, FL | 3.0 | 2.0 | 1240 | $1,400 | $1.13 | 22d | 1 | 0.96mi |
| 500 E Rosewood Ln Unit 154 Tavares, FL | 3.0 | 2.0 | 1140 | $1,650 | $1.45 | 24d | 1 | 0.99mi |
| 741 W Rosewood Ln Tavares, FL | 3.0 | 2.0 | 1125 | $1,195 | $1.06 | 3d | 1 | 1.01mi |
| 30024 Tavares Ridge Blvd Unit 62 Tavares, FL | 2.0 | 2.0 | 1140 | $2,000 | $1.75 | 24d | 1 | 1.05mi |
| 814 N Saint Clair Abrams Ave Tavares, FL | 3.0 | 2.0 | 1872 | $1,275 | $0.68 | 24d | 1 | 1.11mi |
| 743 E Alfred St Tavares, FL | 2.0 | 1.0 | 1000 | $1,450 | $1.45 | 24d | 1 | 1.16mi |
| 615 Juniper Way Tavares, FL | 3.0 | 2.0 | 1209 | $1,900 | $1.57 | 17d | 1 | 1.25mi |
| 807 McLain Ct Tavares, FL | 2.0 | 2.0 | 1104 | $1,700 | $1.54 | 16d | 1 | 1.27mi |
| 1604 Wynford Cir Tavares, FL | 3.0 | 2.5 | 1858 | $1,900 | $1.02 | 17d | 1 | 1.28mi |
| 1605 Wynford Cir Tavares, FL | 3.0 | 2.5 | 1817 | $2,200 | $1.21 | 24d | 1 | 1.31mi |
Listing history 16 events
-
2026-06-18days on market $170,900 Active 85 DOM
-
2026-06-17days on market $170,900 Active 84 DOM
-
2026-06-16days on market $170,900 Active 83 DOM
-
2026-06-15days on market $170,900 Active 82 DOM
-
2026-06-13pricedays on market $170,900 Active 80 DOM
-
2026-06-09days on market $176,900 Active 76 DOM
-
2026-06-08days on market $176,900 Active 75 DOM
-
2026-06-07days on market $176,900 Active 74 DOM
-
2026-06-04days on market $176,900 Active 71 DOM
-
2026-06-03days on market $176,900 Active 70 DOM
-
2026-06-02days on market $176,900 Active 69 DOM
-
2026-06-01days on market $176,900 Active 68 DOM
-
2026-05-31days on market $176,900 Active 67 DOM
-
2026-05-21price $176,900
-
2026-05-05price $179,900
-
2026-03-25$184,900 Active
ⓘ Source: listings_history table (triggers on properties + properties_extension) + one-shot
backfill from property_details.listing_events for pre-trigger history.
Tax reassessment forecast FL · Resets to sale price
- Current annual tax
- $1,528 · $127/mo
- Projected year-2 tax
- $1,528 · $127/mo
- Expected delta
- $0/yr ($0/mo · 0.0%)
ⓘ Screening estimate from a state-policy table — verify with the county assessor before closing.
Climate risk First Street
- Flood 4/10 Moderate FEMA zone X (unshaded) · 22% chance over 30 yrs
- Wildfire 3/10 Moderate
- Heat 8/10 Severe 7 d/yr ≥107°F today · 21 d/yr by 30 yrs out
- Wind 9/10 Extreme 99% chance of damaging wind over 30 yrs
- Air quality 2/10 Low 1 unhealthy d/yr today · 1 by 30 yrs out
Nearby sold comps map
Loading sold comps map…
Walkable amenities ~0.75 mi
Loading nearby amenities…
Taxation est. · year 1
- Rental income
- $23,141
- − Mortgage interest
- −$9,573
- − Property taxes
- −$1,528
- − Insurance
- −$854
- − Repairs & maintenance
- −$1,851
- − Management
- −$1,851
- − Depreciation
- −$4,972
- Taxable income
- $2,511
- Est. tax owed @ 24.0%
- −$603
- After-tax cash flow
- $4,541/yr
For passive investors: Depreciation is non-cash, so a rental often shows a tax loss while cash-flowing — sheltering income. Rental losses are passive: they offset passive income freely, and up to $25,000/yr can offset ordinary (W-2) income if you actively participate and your MAGI is under $100k (phasing out to $0 by $150k); unused losses carry forward. On sale, claimed depreciation is recaptured at up to 25%, and gains may owe capital-gains tax (a 1031 exchange can defer both). Figures are a year-1 estimate at your 24.0% rate — not tax advice; consult a CPA.
Schools (NCES district)
- District
- Lake
- NCES district ID
- 1201050
- Math proficiency
- 49% ▼ -7.00%
- Reading proficiency
- 50% ▼ -4.00%
- Median HH income
- $46,632
- Composite
- 42.05/100
- National rank
- #3327
- State rank
- #37 of 73 in FL
Livability — Tavares
- Score
- 76/100
- State rank
- #220
- US rank
- #3464
Category grades
Schools grade is shown separately in the Schools card above.
Census & demographics
- Census place
- Tavares, FL
- County
- Lake County · 364,602 people
- City population
- 25,042
- Metro
- Orlando-Kissimmee-Sanford, FL
- Population (ZIP)
- 25,042
- Household income
- $63,472
- Rent vs Own
- Severe rent burden
- 586.0
Population outlook (Lake County) Hauer SSP2
- Today (2025)
- 386,640 people
- By 2030
- 417,107 · +7.9%
- By 2040
- 476,676 · +23.3%
- By 2050
- 531,296 · +37.4%
- By 2075
- 648,303 · +67.7%
- By 2100
- 698,530 · +80.7%
Race, ethnicity, and origin ACS 2023
- Neighborhood character
- Predominantly White (72%)
- Race & ethnicity
- White 72% Hispanic / Latino 14% Two or more races 8% Black 8% Asian 2%
- Hispanic origin (detail)
- Mexican 1% Puerto Rican 7% Cuban 2% Dominican 1%
- Common ancestry
- Romanian 4% Italian 3% Slovak 2%
- Foreign-born
- 9% · Canada, Dominican Republic, Jamaica
- Languages at home
- 85% English-only · Spanish 11% Other Indo-European 2% Other Asian/Pacific 1%
Political lean MEDSL · Lake
- 2024 margin
- Strong R (+24.7) · D 37.3% · R 62.0%
- 2008→2024 swing
- -11.2pp toward R · 2008: -13.5pp · 2024: -24.7pp
- All cycles
- 2024: R+24.7 2020: R+20.0 2016: R+23.1 2012: R+17.1 2008: R+13.5
Not yet ingested
- Civics
- —
Market trends
- HPI YoY
- ▼ -88.07%
- Current HPI
- 288.7123
- Rent YoY
- ▲ 4.05%
- Metro
- Orlando-Kissimmee-Sanford, FL
- State GDP YoY
- ▲ 3.28%
- F500 in state
- 36
Industry mix (Fortune 500 HQ in FL)
| Industry | F500 HQs | Revenue |
|---|---|---|
| Industrial Technology | 2 | $29B |
|
||
| Insurance | 2 | $17B |
|
||
| Retail | 1 | $60B |
|
||
| Technology Distribution | 1 | $58B |
|
||
| Homebuilding | 1 | $35B |
|
||
| Technology Manufacturing | 1 | $35B |
|
||
Price history
-4.3% since first listed3 events — show timeline
- 2026-05-21 Price Changed $176,900 Stellar MLS as Distributed by MLS Grid
- 2026-05-05 Price Changed $179,900 Stellar MLS as Distributed by MLS Grid
- 2026-03-25 Listed $184,900 Stellar MLS as Distributed by MLS Grid
Property tax history
+24.6%/yrLatest (2025): $1,528 · +4.9% YoY. Source: county tax records.
Cash-flow waterfall
monthlySold comps — $/sqft
last 12 mo · ≤1 miLoading sold comps…