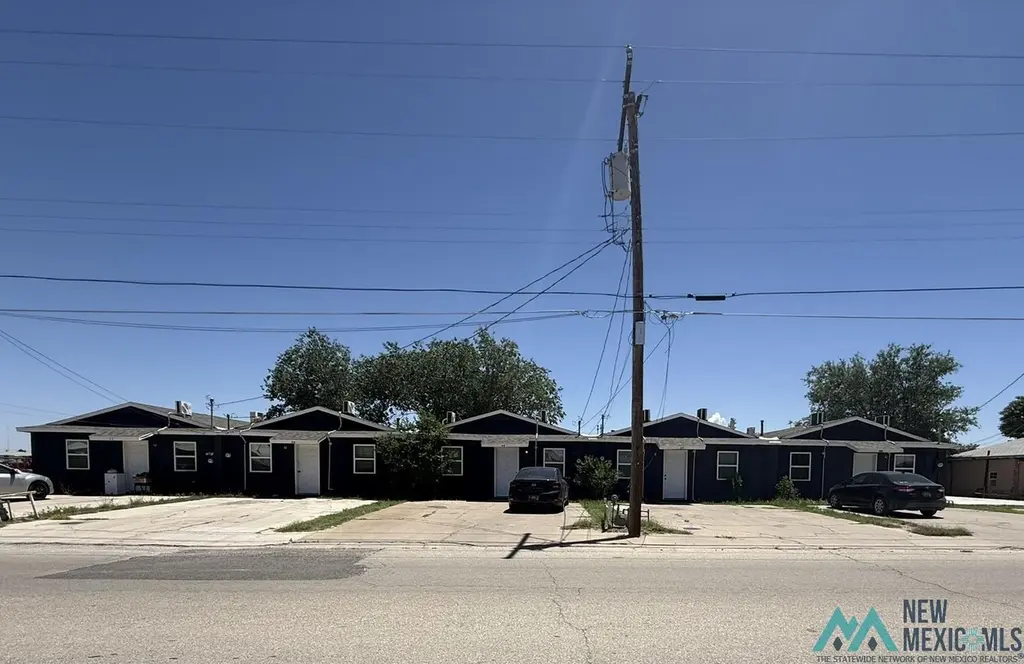
808, 810, 812 N Roselawn Ave Unit 814, 816, 818 N Roselawn · Artesia, NM
Flood risk 1/10 · Minimal
- FEMA flood zone
- AO
- Chance of flooding over 30 yrs
- 0.0%
- Est. flood insurance / yr
- $848 – $2,087
Fire risk 6/10 · Moderate
- Est. fire insurance / yr
- $706 – $1,312
Heat risk 6/10 · Moderate
- Hot days now (above 101°F)
- 7 days/yr
- Hot days in 30 yrs
- 18 days/yr
Wind risk 2/10 · Minimal
- Chance of severe wind over 30 yrs
- —
Air-quality risk 1/10 · Minimal
- Unhealthy air days now
- 0 days/yr
- Unhealthy air days in 30 yrs
- 0 days/yr
Risk factors via First Street. Map © Google.
Why this score? — see what drove the F grade
The composite is a weighted blend of 9 inputs, each scored 0–100. Each bar is that input's sub-score; the figure is the points it added to the 100-point composite (weight × sub-score).
- ARV discount +7.5/15.0
- Condition / age +4.0/5.0
- Schools +3.3/10.0
- Livability +3.2/5.0
- Rent growth +2.5/5.0
- Cash flow +1.7/30.0
- 1% rule +0.0/10.0
- DSCR +0.0/10.0
- Appreciation +0.0/10.0
$630,000
🖨 Deal sheet 📄 Offer letter ✓ Due diligence
Listing remarks
Totally Remodeled 2 bed room 1 bath apartments 850 Sq Ft per Unit! There are 5 Units. Included in the Remodels new flooring, fresh paint inside and outside, split units, cabinets, sinks windows, stove, refrigerators, electrical upgrade, light fixtures and more. Each Unit has their own fenced Back Yards.
Key facts
- Remodeled
- Fresh paint
- New flooring
Tags
Property features AI
Exterior
- Utilities: Public water; Electricity connected; Natural gas connected and available; Cable connected and available
- Home design: Multi-family property (Residential Income); One-story
- Construction: Stucco exterior; Slab foundation
- Exterior features: Lot dimensions: 25 x 140 per unit; Lot area about 3,500 square feet (0.0803 acres)
Interior
- Kitchen: Free-standing range; Refrigerator
- Flooring: Laminate
- Heating & cooling: Has heating; Has cooling; Ceiling fan(s); Electric and gas heating/cooling options; Window units
- Interior features: Ceiling fans; Double pane windows with blinds
- Laundry & utility: No laundry on site
Neighborhood map
What this means for you Summary
Snapshot
- This is a condo listed at $630k. Condition is rated good.
Deal economics
- At list price, monthly cash flow is $-3k ($-30k/yr) — negative.
- To cash-flow at today's rent, offer at most $265k (57.9% below list).
- To meet the 1% rule (rent ≥ 1% of price), the offer needs to be $248k (60.7% below list).
- Recommended offer: $248k (60.7% below list) — sets the bar for 1% rule.
Location & tenants
- Location reads 63/100 on livability (#75 in NM) — a middle-class / working-renter tenant base. Strengths: cost of living A+, housing A+; Watch: employment C-, health & safety C-, schools F.
- Artesia Public Schools (town): math 29% / reading 42% proficiency, ranked #17 of 95 in NM (top 18%) — families likely to look elsewhere, expect single-tenant / working-renter base with shorter leases.
- Market conditions: 166 active listings in the ZIP; 2 comparable units currently listed for rent nearby; solid renter incomes; 156 units permitted in Eddy County in 2024 (0 in 5+ unit buildings).
- This rent runs 37% of the median local income ($80k/yr) — at the standard rent-burdened threshold; future hikes will face affordability resistance.
Forward outlook
- Local home prices are declining (-3.0%/yr); year-one equity from $4k of loan paydown is wiped out by about $19k of value loss. Plan a longer hold.
- Eddy County population projected at +36% by 2050 — long-run rental-demand tailwind backs the buy-and-hold thesis.
Negotiation context
- It's been on market 29 days — a 2% lower offer ($621k) is reasonable based on typical stale-listing flexibility.
Risks & watch-outs
- Watch-outs: flood insurance adds $122/mo.
- Climate carrying-cost: in FEMA flood zone AO (mandatory federal flood insurance); major wildfire risk; extreme-heat days projected 7→18/yr by 2055 (HVAC capex compounding) — expect insurance premiums to compound above CPI over the hold.
Questions for the listing agent
- What do current leases actually rent for vs. the listed asking? Can we see a recent rent roll and the last 12 months of T-12 income?
- What's the actual annual flood-insurance premium (NFIP or private), and is the property in a SFHA with mandatory coverage?
- Any open or pending special assessments — roof, HVAC, plumbing, elevator, façade? What's the per-unit balance and payoff schedule, and is the seller paying it off at close or rolling it to the buyer?
- Is there a deadline driving the sale (1031 exchange, divorce, estate, relocation)? That informs how much negotiation room exists.
- Schools are F-rated, which usually means shorter tenancies and higher turnover. Who's the typical renter profile here, and what's been the actual vacancy rate?
- Crime grade is F in this area — have there been break-ins, vandalism, or insurance claims at this property in the last 3 years? What carrier currently insures it and at what premium?
- The area grade is low — what's the realistic commute time and amenity access for the typical tenant pool here? Any planned neighborhood developments (good or bad) we should know about?
- What's the average days-on-market for RENTAL listings here right now (not sales)? A rising rental-DOM trend means longer vacancies and softer asking-rent achievability than the comps imply.
- What's the recent tenant-quality profile in this submarket — average credit score on applications, eviction rate, late-payment / NSF rate, and stable-employment percentage? A property-management company in the area should have these aggregated.
- How much new apartment / multifamily construction is in the pipeline within 1–3 miles? Heavy new supply (>2% of stock underway) typically softens rents 12–24 months out; light construction supports rent growth.
Investment metrics
- 1% rule
- 0.39% ✗
- Cap rate
- 1.73%
- Cash-on-cash
- -16.31%
- DSCR
- 0.27
- GRM
- 21.2
CMA / ARV
No comps found within radius.
Projected returns pro-forma
-3.0% appreciation · 3.0% rent growth · sell at horizon
- IRR
- -50.2%
- Equity multiple
- -0.49×
- Total profit
- $-262,436
- Equity at exit
- $93,935
- IRR
- -99.9%
- Equity multiple
- -1.46×
- Total profit
- $-434,687
- Equity at exit
- $54,471
Cash invested: $176,400 (down + closing). Projections, not guarantees.
Landlord ↔ Tenant lean methodology
- Overall (STATE)
- 55 Moderately Landlord-Leaning
- State New Mexico
- 55 Moderately Landlord-Leaning · D+3
- County
- — inherits STATE
- City
- — inherits STATE
ZIP-level market 88210
- Active inventory
- 166
- Price-to-rent
- 21.2×
Monthly cashflow live
- Estimated rent
- $2,477 medium interval (Pro) →
- Mortgage (P&I)
- −$3,304
- Tax est. 1.5%
- −$788 /mo · $9,450/yr
- Insurance
- −$262
- Flood insurance flood zone
- −$122 /mo · $1,468/yr
- HOA
- −$0
- Vacancy / Maint / Mgmt
- −$520
- Net cashflow
- $-2,519
Break-even live
UW: 25.0% down · 7.5% · 30yr · 1.5% tax · 5.0% vac · 8.0% maint · 8.0% mgmt
Financing live
Cash to close
- Down payment
- $157,500
- Closing costs
- $18,900
- Reserves months
- —
- Total cash needed
- —
Loan-product check · same deal, 3 products live
Conventional
25% down · 7.5% · 30yr
- Down + closing
- —
- Monthly P&I
- —
- Monthly cashflow
- —
- DSCR
- —
- Eligible?
- —
Personal DTI + credit; lowest rate.
DSCR
20% down · 8.5% · 30yr
- Down + closing
- —
- Monthly P&I
- —
- Monthly cashflow
- —
- DSCR
- —
- Eligible?
- —
No personal income docs; deal must DSCR.
Hard money
10% down · 12.0% · 12mo
- Down + closing
- —
- Monthly P&I
- —
- Monthly cashflow
- —
- DSCR
- —
- Eligible?
- —
Short-term bridge; refi at stabilization.
Rent comps 2 comps
| Address | Beds | Baths | Sqft | Rent | $/sqft | DOM | Units | Dist |
|---|---|---|---|---|---|---|---|---|
| 103 N 7th St Artesia, NM | 3.0 | 1.0 | 1000 | $1,200 | $1.20 | 44d | 1 | 0.32mi |
| 1402 W Briscoe Ave Artesia, NM | 3.0 | 2.0 | 1564 | $1,750 | $1.12 | 44d | 1 | 1.35mi |
HOA detail condo
- Monthly dues
- $0 · $0/yr
- Likely covers
- electric
- Assessments
- None detected in remarks — confirm with the listing agent.
Listing history 17 events
-
2026-06-19days on market $630,000 Active 29 DOM
-
2026-06-18days on market $630,000 Active 28 DOM
-
2026-06-17days on market $630,000 Active 27 DOM
-
2026-06-16days on market $630,000 Active 26 DOM
-
2026-06-15days on market $630,000 Active 25 DOM
-
2026-06-14days on market $630,000 Active 23 DOM
-
2026-06-13days on market $630,000 Active 22 DOM
-
2026-06-10days on market $630,000 Active 20 DOM
-
2026-06-09days on market $630,000 Active 19 DOM
-
2026-06-08days on market $630,000 Active 18 DOM
-
2026-06-07days on market $630,000 Active 17 DOM
-
2026-06-03days on market $630,000 Active 13 DOM
-
2026-06-02days on market $630,000 Active 12 DOM
-
2026-06-01days on market $630,000 Active 11 DOM
-
2026-05-31days on market $630,000 Active 10 DOM
-
2026-05-30days on market $630,000 Active 9 DOM
-
2026-05-19$630,000 Active
ⓘ Source: listings_history table (triggers on properties + properties_extension) + one-shot
backfill from property_details.listing_events for pre-trigger history.
Climate risk First Street
- Flood 1/10 Low FEMA zone AO · 0% chance over 30 yrs
- Wildfire 6/10 Major
- Heat 6/10 Major 7 d/yr ≥101°F today · 18 d/yr by 30 yrs out
- Wind 2/10 Low
- Air quality 1/10 Low 0 unhealthy d/yr today · 0 by 30 yrs out
Nearby sold comps map
Loading sold comps map…
Walkable amenities ~0.75 mi
Loading nearby amenities…
Taxation est. · year 1
- Rental income
- $29,722
- − Mortgage interest
- −$35,290
- − Property taxes
- −$9,450
- − Insurance
- −$4,618
- − Repairs & maintenance
- −$2,378
- − Management
- −$2,378
- − Depreciation
- −$18,327
- Taxable loss
- −$42,718
- Est. tax savings @ 24.0%
- +$10,252
- After-tax cash flow
- $-19,980/yr
For passive investors: Depreciation is non-cash, so a rental often shows a tax loss while cash-flowing — sheltering income. Rental losses are passive: they offset passive income freely, and up to $25,000/yr can offset ordinary (W-2) income if you actively participate and your MAGI is under $100k (phasing out to $0 by $150k); unused losses carry forward. On sale, claimed depreciation is recaptured at up to 25%, and gains may owe capital-gains tax (a 1031 exchange can defer both). Figures are a year-1 estimate at your 24.0% rate — not tax advice; consult a CPA.
Condition & rehab AI · 12 photos
Totally remodeled 2-bedroom 1-bath apartments with new flooring and fresh paint, ready for move-in.
Value-add opportunities
- Both Paint exterior — Enhances curb appeal and value
- Both Landscaping — Improves curb appeal and rental appeal
Renovation cost estimate screening
Value-add ROI direction
- Both Paint exterior — Enhances curb appeal and value ↑
- Both Landscaping — Improves curb appeal and rental appeal ↑
ⓘ Cost ranges are severity-bucket heuristics (US national rule-of-thumb). Get contractor quotes + a written scope before underwriting a rehab budget.
Schools (NCES district)
- District
- Artesia Public Schools
- NCES district ID
- 3500120
- Math proficiency
- 29% —
- Reading proficiency
- 42% —
- Median HH income
- $51,397
- Composite
- 33.48/100
- National rank
- #10522
- State rank
- #17 of 95 in NM
Livability — Artesia
- Score
- 63/100
- State rank
- #75
- US rank
- #15300
Category grades
Schools grade is shown separately in the Schools card above.
Census & demographics
- Census place
- Artesia, NM
- County
- Eddy County · 58,370 people
- City population
- 18,542
- Metro
- Carlsbad-Artesia, NM
- Population (ZIP)
- 18,542
- Household income
- $79,632
- Rent vs Own
- Severe rent burden
- 159.0
Population outlook (Eddy County) Hauer SSP2
- Today (2025)
- 65,505 people
- By 2030
- 69,797 · +6.6%
- By 2040
- 79,191 · +20.9%
- By 2050
- 89,199 · +36.2%
- By 2075
- 115,829 · +76.8%
- By 2100
- 129,336 · +97.4%
Race, ethnicity, and origin ACS 2023
- Neighborhood character
- Majority Hispanic (55%)
- Race & ethnicity
- Hispanic / Latino 55% White 40% Two or more races 19% Native American 3%
- Hispanic origin (detail)
- Mexican 50%
- Common ancestry
- Italian 1% Romanian 1% Iranian 1%
- Foreign-born
- 6% · Canada, Jamaica
- Languages at home
- 74% English-only · Spanish 24%
Political lean MEDSL · Eddy
- 2024 margin
- Solid R (+55.9) · D 21.4% · R 77.3% · Other 1.3%
- 2008→2024 swing
- -30.2pp toward R · 2008: -25.6pp · 2024: -55.9pp
- All cycles
- 2024: R+55.9 2020: R+51.8 2016: R+41.6 2012: R+33.5 2008: R+25.6
Not yet ingested
- Civics
- —
Market trends
- HPI YoY
- ▼ -238.85%
- Current HPI
- 115.6107
- Rent YoY
- —
- Metro
- Carlsbad-Artesia, NM
- State GDP YoY
- —
- F500 in state
- 0
Price history
1 event — show timeline
- 2026-05-19 Listed $630,000 NMMLS
Cash-flow waterfall
monthlySold comps — $/sqft
last 12 mo · ≤1 miLoading sold comps…