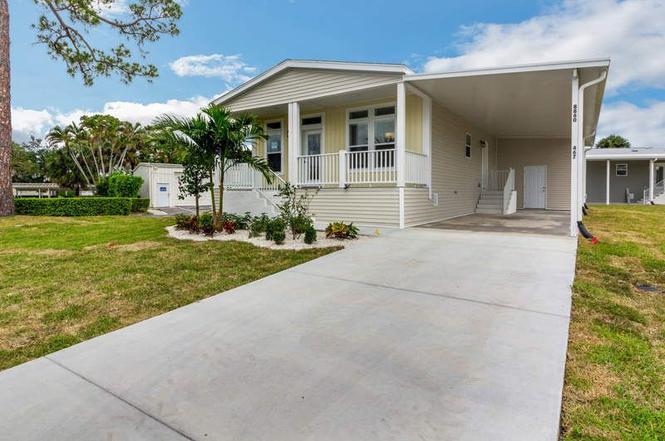
8860 Royal Manor Cir · Boynton Beach, FL
Flood risk 1/10 · Minimal
- FEMA flood zone
- X (unshaded)
- Chance of flooding over 30 yrs
- 0.0%
- Est. flood insurance / yr
- $507 – $1,088
Fire risk 1/10 · Minimal
- Est. fire insurance / yr
- $947 – $1,759
Heat risk 9/10 · Severe
- Hot days now (above 106°F)
- 5 days/yr
- Hot days in 30 yrs
- 18 days/yr
Wind risk 10/10 · Severe
- Chance of severe wind over 30 yrs
- 99.0%
Air-quality risk 2/10 · Minimal
- Unhealthy air days now
- 1 days/yr
- Unhealthy air days in 30 yrs
- 2 days/yr
Risk factors via First Street. Map © Google.
Why this score? — see what drove the B- grade
The composite is a weighted blend of 9 inputs, each scored 0–100. Each bar is that input's sub-score; the figure is the points it added to the 100-point composite (weight × sub-score).
- Cash flow +30.0/30.0
- DSCR +10.0/10.0
- 1% rule +8.6/10.0
- ARV discount +7.5/15.0
- Schools +4.3/10.0
- Livability +3.6/5.0
- Condition / age +2.5/5.0
- Rent growth +2.4/5.0
- Appreciation +0.0/10.0
$169,900
🖨 Deal sheet 📄 Offer letter ✓ Due diligence
Listing remarks
NEW HOME Welcome to your charming oasis in the heart of convenience! This delightful Palm Harbor Avon Park model located in a 55+ community that offers 1123 square feet of comfortable living space, featuring 2 bedrooms and 2 bathrooms. Situated on a corner lot, this home enjoys a prime location near the pool, Clubhouse, and all amenities, making it ideal for those seeking both relaxation and community engagement. Step inside to discover a well-appointed interior with thoughtfully designed spaces, perfect for everyday living and entertaining. Don't miss out on this opportunity to own a piece of paradise in a highly sought-after location! Schedule your showing today and start living the Flo
Key facts
- Near clubhouse
- Corner lot
- Near the pool
Tags
Property features AI
Finance
- Financial info: List price $169,900
Exterior
- Home design: Spec new construction
- Exterior features: Address: 8860 Royal Manor Cir, Boynton Beach, FL 33436
Interior
- Bedrooms: 2 bedrooms
- Bathrooms: 2 full bathrooms
- Interior features: Living area of 1,123
Neighborhood map
What this means for you Summary
Snapshot
- This is a 2-bed/2.0-bath manufactured listed at $170k.
Deal economics
- At list price, monthly cash flow is $652 ($8k/yr) — positive.
- The deal already cash-flows at list — no discount required.
- Meets the 1% rule at list price ($2k rent vs $170k).
- Recommended offer: $150k (12.0% below list) — sets the bar for market timing.
- Cap rate 10.9% vs local median 4.3% in Boynton Beach — top-decile yield for the area; either an underpriced asset or a hidden risk that comps aren't pricing in. Stress-test before assuming the spread holds.
Location & tenants
- Location reads 72/100 on livability (#351 in FL) — a middle-class / working-renter tenant base. Strengths: housing A+, health & safety B+, cost of living B; Watch: amenities D+, crime D-, commute F.
- Palm Beach (suburban): math 46% / reading 53% proficiency, ranked #34 of 73 in FL (top 47%) — families likely to look elsewhere, expect single-tenant / working-renter base with shorter leases.
- Market conditions: Rents soft (-0.6%/yr); 445 active listings in the ZIP; 40 comparable units currently listed for rent nearby; rentals at typical pace (median 25d on market — plan ~3-4 weeks tenant-placement turnaround); solid renter incomes; 3,974 units permitted in Palm Beach County in 2024 (1,012 in 5+ unit buildings).
- This rent runs 37% of the median local income ($76k/yr) — at the standard rent-burdened threshold; future hikes will face affordability resistance.
Forward outlook
- Local home prices are declining (-3.0%/yr); year-one equity from $1k of loan paydown is wiped out by about $5k of value loss. Plan a longer hold.
- Palm Beach County population projected at +30% by 2050 — long-run rental-demand tailwind backs the buy-and-hold thesis.
Negotiation context
- It's been on market 373 days — a 12% lower offer ($150k) is reasonable based on typical stale-listing flexibility.
Risks & watch-outs
- Climate carrying-cost: severe wind risk, 99% chance of damaging wind over 30y; extreme-heat days projected 5→18/yr by 2055 (HVAC capex compounding) — expect insurance premiums to compound above CPI over the hold.
Questions for the listing agent
- It's been on market 373 days. Have you received any prior offers? Is the seller open to a 12% concession, seller financing, or rate buy-down credit?
- Why hasn't it sold? Are there any deal-killer items the seller is aware of (foundation, flood, title, zoning, code violations)?
- Is there a deadline driving the sale (1031 exchange, divorce, estate, relocation)? That informs how much negotiation room exists.
- Crime grade is D in this area — have there been break-ins, vandalism, or insurance claims at this property in the last 3 years? What carrier currently insures it and at what premium?
- What's the average days-on-market for RENTAL listings here right now (not sales)? A rising rental-DOM trend means longer vacancies and softer asking-rent achievability than the comps imply.
- What's the recent tenant-quality profile in this submarket — average credit score on applications, eviction rate, late-payment / NSF rate, and stable-employment percentage? A property-management company in the area should have these aggregated.
- How much new for-sale + rental construction is in the pipeline within 1–3 miles? Heavy new supply typically softens prices + rents 12–24 months out; constrained supply supports both.
Investment metrics
- 1% rule
- 1.36% ✓
- Cap rate
- 10.90%
- Cash-on-cash
- 16.45%
- DSCR
- 1.73
- GRM
- 6.1
CMA / ARV
No comps found within radius.
Projected returns pro-forma
-3.0% appreciation · 0.0% rent growth · sell at horizon
- IRR
- 4.1%
- Equity multiple
- 1.15×
- Total profit
- $7,275
- Equity at exit
- $25,333
- IRR
- 10.6%
- Equity multiple
- 1.71×
- Total profit
- $33,790
- Equity at exit
- $14,690
Cash invested: $47,572 (down + closing). Projections, not guarantees.
Landlord ↔ Tenant lean methodology
- Overall (STATE)
- 87 Strongly Landlord-Friendly
- State Florida
- 87 Strongly Landlord-Friendly · R+3
- County
- — inherits STATE
- City
- — inherits STATE
ZIP-level market 33436
- Home prices YoY
- -26.0%
- Rents YoY
- -0.6%
- Active inventory
- 445
- Price-to-rent
- 6.1×
Monthly cashflow live
- Estimated rent
- $2,312 high interval (Pro) →
- Mortgage (P&I)
- −$891
- Tax est. 1.5%
- −$212 /mo · $2,548/yr
- Insurance
- −$71
- HOA
- −$0
- Vacancy / Maint / Mgmt
- −$486
- Net cashflow
- $652
Break-even live
UW: 25.0% down · 7.5% · 30yr · 1.5% tax · 5.0% vac · 8.0% maint · 8.0% mgmt
Financing live
Cash to close
- Down payment
- $42,475
- Closing costs
- $5,097
- Reserves months
- —
- Total cash needed
- —
Loan-product check · same deal, 3 products live
Conventional
25% down · 7.5% · 30yr
- Down + closing
- —
- Monthly P&I
- —
- Monthly cashflow
- —
- DSCR
- —
- Eligible?
- —
Personal DTI + credit; lowest rate.
DSCR
20% down · 8.5% · 30yr
- Down + closing
- —
- Monthly P&I
- —
- Monthly cashflow
- —
- DSCR
- —
- Eligible?
- —
No personal income docs; deal must DSCR.
Hard money
10% down · 12.0% · 12mo
- Down + closing
- —
- Monthly P&I
- —
- Monthly cashflow
- —
- DSCR
- —
- Eligible?
- —
Short-term bridge; refi at stabilization.
Rent comps 40 comps
| Address | Beds | Baths | Sqft | Rent | $/sqft | DOM | Units | Dist |
|---|---|---|---|---|---|---|---|---|
| 4482 King Theodore Dr Boynton Beach, FL | 1.0 | 1.0 | 800 | $1,795 | $2.24 | 24d | 1 | 0.17mi |
| 8949 Oak St Boynton Beach, FL | 2.0 | 2.0 | 1040 | $1,300 | $1.25 | 24d | 1 | 0.19mi |
| 3736 Coelebs Ave Boynton Beach, FL | 3.0 | 2.0 | 1232 | $3,000 | $2.44 | 24d | 1 | 0.66mi |
| 3930 Max Pl Boynton Beach, FL | 1.0 | 1.0 | 925 | $2,550 | $2.76 | 22d | 1 | 0.66mi |
| 3500 Sandpiper Dr Boynton Beach, FL | 1.0–2.0 | 1.0–2.0 | 1147 | $2,579 | $2.25 | 22d | 22 | 0.74mi |
| 920 Sun Acres Ln Boynton Beach, FL | 2.0 | 2.0 | 1352 | $2,200 | $1.63 | 24d | 1 | 0.80mi |
| 9498 S Military Trl #5 Boynton Beach, FL | 3.0 | 2.5 | 1317 | $2,900 | $2.20 | 24d | 1 | 0.92mi |
| 3561 Oberon Ave Boynton Beach, FL | 3.0 | 2.0 | 1248 | $2,850 | $2.28 | 21d | 1 | 1.04mi |
| 9873 Lawrence Rd Boynton Beach, FL | 2.0 | 2.0 | 1200 | $2,267 | $1.89 | 22d | 1 | 1.09mi |
| 9873 Lawrence Rd Boynton Beach, FL | 2.0 | 2.0 | 1200 | $2,315 | $1.93 | 4d | 1 | 1.09mi |
| 220 Savannah Lakes Dr Boynton Beach, FL | 2.0 | 2.0 | 1098 | $2,365 | $2.15 | 3d | 1 | 1.10mi |
| 4220 Grove Park Ln Unit 1 Boynton Beach, FL | 3.0 | 2.0 | 1406 | $3,600 | $2.56 | 24d | 1 | 1.11mi |
| 4220 Grove Park Ln Unit 1 Boynton Beach, FL | 3.0 | 2.0 | 1406 | $3,400 | $2.42 | 4d | 1 | 1.11mi |
| 9940 Bauhinia Tree Way Unit B Boynton Beach, FL | 1.0 | 1.0 | 1200 | $2,000 | $1.67 | 24d | 1 | 1.12mi |
| 9940 Bauhinia Tree Way Unit B Boynton Beach, FL | 1.0 | 1.0 | 1200 | $1,800 | $1.50 | 8d | 1 | 1.12mi |
| 1515 Arezzo Cir Boynton Beach, FL | 2.0 | 2.5 | 1286 | $2,750 | $2.14 | 24d | 1 | 1.13mi |
| 9900 Pineapple Tree Dr #106 Boynton Beach, FL | 2.0 | 2.0 | 1008 | $2,250 | $2.23 | 24d | 1 | 1.14mi |
| 7705 Forest Green Ln Boynton Beach, FL | 3.0 | 2.0 | 1379 | $3,200 | $2.32 | 24d | 1 | 1.15mi |
| 7705 Forest Green Ln Boynton Beach, FL | 2.0 | 2.0 | 1379 | $3,200 | $2.32 | 17d | 1 | 1.15mi |
| 5155 Europa Dr Unit J Boynton Beach, FL | 3.0 | 2.0 | 1333 | $2,750 | $2.06 | 24d | 1 | 1.16mi |
| 4525 Nutmeg Tree Ln Unit A Boynton Beach, FL | 2.0 | 2.0 | 1404 | $3,000 | $2.14 | 24d | 1 | 1.16mi |
| 9746 Nickels Blvd Boynton Beach, FL | 2.0 | 2.0 | 1215 | $2,800 | $2.30 | 24d | 1 | 1.17mi |
| 9935 Pineapple Tree Dr #202 Boynton Beach, FL | 2.0 | 2.0 | 1008 | $2,575 | $2.55 | 15d | 1 | 1.19mi |
| 5072 Arbor Glen Cir Lake Worth, FL | 3.0 | 2.0 | 1232 | $3,300 | $2.68 | 15d | 1 | 1.20mi |
| 4101 Mahogany Dr Boynton Beach, FL | 1.0–2.0 | 1.0–2.0 | 950 | $2,169 | $2.28 | 3d | 11 | 1.21mi |
| 1239 Sussex St Boynton Beach, FL | 3.0 | 2.0 | 1436 | $3,100 | $2.16 | 20d | 1 | 1.24mi |
| 1239 Sussex St Boynton Beach, FL | 3.0 | 2.0 | 1436 | $3,100 | $2.16 | 24d | 1 | 1.24mi |
| 2303 N Congress Ave #15 Boynton Beach, FL | 2.0 | 1.0 | 925 | $1,950 | $2.11 | 24d | 1 | 1.24mi |
| 5373 Mirror Lakes Blvd Boynton Beach, FL | 3.0 | 2.0 | 1310 | $2,100 | $1.60 | 24d | 1 | 1.24mi |
| 2305 N Congress Ave #18 Boynton Beach, FL | 3.0 | 2.0 | 1217 | $2,600 | $2.14 | 15d | 1 | 1.25mi |
| 4259 Wood Ride Unit E Boynton Beach, FL | 2.0 | 2.0 | 1240 | $2,350 | $1.90 | 8d | 1 | 1.26mi |
| 2313 N Congress Ave #18 Boynton Beach, FL | 2.0 | 1.0 | 758 | $1,950 | $2.57 | 15d | 1 | 1.26mi |
| 5157 Floria Way Unit J Boynton Beach, FL | 3.0 | 2.0 | 1447 | $3,300 | $2.28 | 24d | 1 | 1.27mi |
| 107 Buttonwood Ln Unit 107 Boynton Beach, FL | 2.0 | 2.5 | 1264 | $2,600 | $2.06 | 24d | 1 | 1.28mi |
| 2307 N Congress Ave #24 Boynton Beach, FL | 2.0 | 1.0 | 902 | $1,700 | $1.88 | 3d | 1 | 1.28mi |
| 5537 Pebble Brook Ln Boynton Beach, FL | 3.0 | 2.0 | 1166 | $2,825 | $2.42 | 15d | 1 | 1.30mi |
| 2301 N Congress Ave #25 Boynton Beach, FL | 2.0 | 1.0 | 758 | $2,000 | $2.64 | 24d | 1 | 1.30mi |
| 2317 N Congress Ave #24 Boynton Beach, FL | 2.0 | 1.0 | 902 | $2,300 | $2.55 | 5d | 1 | 1.31mi |
| 2319 N Congress Ave #28 Boynton Beach, FL | 2.0 | 2.0 | 1172 | $1,945 | $1.66 | 8d | 1 | 1.33mi |
| 5133 Brisata Cir Unit P Boynton Beach, FL | 3.0 | 2.0 | 1374 | $2,800 | $2.04 | 24d | 1 | 1.35mi |
Listing history 11 events
-
2026-06-18days on market $169,900 Active 373 DOM
-
2026-06-17days on market $169,900 Active 372 DOM
-
2026-06-16days on market $169,900 Active 371 DOM
-
2026-06-15days on market $169,900 Active 370 DOM
-
2026-06-13days on market $169,900 Active 368 DOM
-
2026-06-09days on market $169,900 Active 364 DOM
-
2026-06-07days on market $169,900 Active 362 DOM
-
2026-06-04days on market $169,900 Active 359 DOM
-
2026-06-03days on market $169,900 Active 358 DOM
-
2026-06-01days on market $169,900 Active 356 DOM
-
2026-05-31days on market $169,900 Active 355 DOM
ⓘ Source: listings_history table (triggers on properties + properties_extension) + one-shot
backfill from property_details.listing_events for pre-trigger history.
Climate risk First Street
- Flood 1/10 Low FEMA zone X (unshaded) · 0% chance over 30 yrs
- Wildfire 1/10 Low
- Heat 9/10 Extreme 5 d/yr ≥106°F today · 18 d/yr by 30 yrs out
- Wind 10/10 Extreme 99% chance of damaging wind over 30 yrs
- Air quality 2/10 Low 1 unhealthy d/yr today · 2 by 30 yrs out
Nearby sold comps map
Loading sold comps map…
Walkable amenities ~0.75 mi
Loading nearby amenities…
Taxation est. · year 1
- Rental income
- $27,744
- − Mortgage interest
- −$9,517
- − Property taxes
- −$2,548
- − Insurance
- −$850
- − Repairs & maintenance
- −$2,220
- − Management
- −$2,220
- − Depreciation
- −$4,943
- Taxable income
- $5,447
- Est. tax owed @ 24.0%
- −$1,307
- After-tax cash flow
- $6,521/yr
For passive investors: Depreciation is non-cash, so a rental often shows a tax loss while cash-flowing — sheltering income. Rental losses are passive: they offset passive income freely, and up to $25,000/yr can offset ordinary (W-2) income if you actively participate and your MAGI is under $100k (phasing out to $0 by $150k); unused losses carry forward. On sale, claimed depreciation is recaptured at up to 25%, and gains may owe capital-gains tax (a 1031 exchange can defer both). Figures are a year-1 estimate at your 24.0% rate — not tax advice; consult a CPA.
Schools (NCES district)
- District
- Palm Beach
- NCES district ID
- 1201500
- Math proficiency
- 46% ▼ -16.00%
- Reading proficiency
- 53% ▼ -4.00%
- Median HH income
- $53,943
- Composite
- 42.72/100
- National rank
- #3160
- State rank
- #34 of 73 in FL
Livability — Boynton Beach
- Score
- 72/100
- State rank
- #351
- US rank
- #6098
Category grades
Schools grade is shown separately in the Schools card above.
Census & demographics
- Census place
- Boynton Beach, FL
- County
- Palm Beach County · 1,438,312 people
- City population
- 148,060
- Metro
- Miami-Fort Lauderdale-Pompano Beach, FL
- Population (ZIP)
- 48,743
- Household income
- $75,789
- Rent vs Own
- Severe rent burden
- 1813.0
Population outlook (Palm Beach County) Hauer SSP2
- Today (2025)
- 1,637,487 people
- By 2030
- 1,743,255 · +6.5%
- By 2040
- 1,948,712 · +19.0%
- By 2050
- 2,132,979 · +30.3%
- By 2075
- 2,530,027 · +54.5%
- By 2100
- 2,706,979 · +65.3%
Race, ethnicity, and origin ACS 2023
- Neighborhood character
- Diverse neighborhood (Simpson 0.64)
- Race & ethnicity
- White 52% Black 24% Hispanic / Latino 19% Two or more races 10% Asian 2%
- Hispanic origin (detail)
- Mexican 2% Puerto Rican 4% Cuban 3% Dominican 1%
- Common ancestry
- Hispanic 12% Romanian 3% Scotch-Irish 2%
- Foreign-born
- 27% · Canada, Jamaica, Vietnam
- Languages at home
- 64% English-only · Spanish 14% French/Haitian/Cajun 13% Other Indo-European 2%
Political lean MEDSL · Palm Beach
- 2024 margin
- Toss-up / Even · D 50.0% · R 49.2%
- 2008→2024 swing
- -22.1pp toward R · 2008: 22.9pp · 2024: 0.8pp
- All cycles
- 2024: D+0.8 2020: D+12.8 2016: D+15.3 2012: D+17.0 2008: D+22.9
Not yet ingested
- Civics
- —
Market trends
- HPI YoY
- ▼ -109.59%
- Current HPI
- 311.7742
- Rent YoY
- ▼ -0.57%
- Metro
- Miami-Fort Lauderdale-Pompano Beach, FL
- State GDP YoY
- ▲ 3.28%
- F500 in state
- 36
Industry mix (Fortune 500 HQ in FL)
| Industry | F500 HQs | Revenue |
|---|---|---|
| Industrial Technology | 2 | $29B |
|
||
| Insurance | 2 | $17B |
|
||
| Retail | 1 | $60B |
|
||
| Technology Distribution | 1 | $58B |
|
||
| Homebuilding | 1 | $35B |
|
||
| Technology Manufacturing | 1 | $35B |
|
||
Cash-flow waterfall
monthlySold comps — $/sqft
last 12 mo · ≤1 miLoading sold comps…