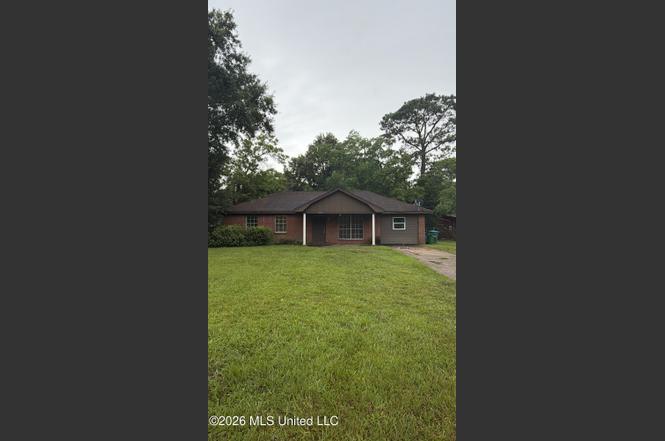
5210 Friar Tuck Ave · Pascagoula, MS
Flood risk 7/10 · Major
- FEMA flood zone
- AE
- Chance of flooding over 30 yrs
- 0.74%
- Est. flood insurance / yr
- $1,737 – $8,500
Fire risk 3/10 · Minor
- Est. fire insurance / yr
- $1,241 – $2,305
Heat risk 10/10 · Severe
- Hot days now (above 105°F)
- 7 days/yr
- Hot days in 30 yrs
- 22 days/yr
Wind risk 9/10 · Severe
- Chance of severe wind over 30 yrs
- 99.0%
Air-quality risk 3/10 · Minor
- Unhealthy air days now
- 2 days/yr
- Unhealthy air days in 30 yrs
- 3 days/yr
Risk factors via First Street. Map © Google.
Why this score? — see what drove the B+ grade
The composite is a weighted blend of 9 inputs, each scored 0–100. Each bar is that input's sub-score; the figure is the points it added to the 100-point composite (weight × sub-score).
- Cash flow +30.0/30.0
- ARV discount +15.0/15.0
- 1% rule +10.0/10.0
- DSCR +10.0/10.0
- Livability +3.5/5.0
- Schools +3.3/10.0
- Rent growth +2.5/5.0
- Condition / age +2.5/5.0
- Appreciation +0.0/10.0
$95,000
🖨 Deal sheet 📄 Offer letter ✓ Due diligence
Listing remarks MLS
INVESTORS SPECIAL~PASC. Brick 3BR/1.5BA home. Perfect for the investor or fixer-upper/handyman. Single garage & fenced yard.
Key facts
- Enclosed garage
- Corner lot
- 0.24 acre lot
Tags
Property features AI
Finance
- Other: Property listed as a fixer
Exterior
- Parking: Driveway with direct access; Parking for 4 vehicles
- Utilities: Public water; Public sewer; Electricity available
- Home design: Single family residence (house); One story
- Construction: Brick, brick veneer, and siding exterior; Slab foundation; Shingle roof; Built in public-records year (year built from public records)
- Exterior features: Front porch; Private yard; Back yard fencing; Corner lot
Interior
- Bedrooms: Bonus room may serve as an additional bedroom
- Flooring: Tile
- Bathrooms: 1 full bathroom; 1 half bathroom (1.5 total bathrooms)
- Heating & cooling: Central heating; Central air conditioning
- Interior features: Tile flooring; Bonus room that could be used as another bedroom; One total finished room listed
- Laundry & utility: Laundry inside the home
Neighborhood map
What this means for you Summary
Snapshot
- This is a 3-bed/1.0-bath single-family listed at $95k.
Deal economics
- At list price, monthly cash flow is $64 ($770/yr) — positive.
- The deal already cash-flows at list — no discount required.
- Meets the 1% rule at list price ($1k rent vs $95k).
- Cap rate 12.5% vs local median 4.2% in Pascagoula — top-decile yield for the area; either an underpriced asset or a hidden risk that comps aren't pricing in. Stress-test before assuming the spread holds.
Location & tenants
- Location reads 70/100 on livability (#41 in MS) — a middle-class / working-renter tenant base. Strengths: cost of living A+, housing A+, health & safety A+; Watch: crime F, amenities D-, commute F.
- Pascagoula-Gautier School District (urban): math 40% / reading 38% proficiency, ranked #41 of 130 in MS (top 32%) — families likely to look elsewhere, expect single-tenant / working-renter base with shorter leases; 78% free/reduced lunch — lower-income household profile, screen leases tightly.
- Zoned schools: Pascagoula High School (math 42% / reading 39%, grade F, #51 of 197 statewide, top 26%, 1,187 students, 100% FRL) — zoned schools average 100% FRL vs 78% district-wide (22 pts higher); higher-poverty schools than district average — tighter screening recommended.
- Market conditions: 79 active listings in the ZIP; 6 comparable units currently listed for rent nearby; rentals leasing fast (median 14d on market — plan ~1-2 weeks tenant-placement turnaround); lower-income renter base — watch delinquency; 516 units permitted in Jackson County in 2024 (6 in 5+ unit buildings).
- At $1,429/mo this rent would consume 45% of the median local household income ($38k/yr) (locally 965% of renters already pay >50% of income on rent) — very limited rent-growth headroom before tenants either downsize or default.
Forward outlook
- Local home prices are declining (-3.0%/yr); year-one equity from $657 of loan paydown is wiped out by about $3k of value loss. Plan a longer hold.
Negotiation context
- Only 2 days on market — expect competitive offers; lowballing is unlikely to land.
- 2 sale attempts since 16y ago with the ask held roughly flat each time — persistent listings suggest the price (not the market) is what's stuck; bring a comps-based counter.
Risks & watch-outs
- Watch-outs: flood insurance adds $427/mo.
- Climate carrying-cost: in FEMA flood zone AE (mandatory federal flood insurance); severe wind risk, 99% chance of damaging wind over 30y; extreme-heat days projected 7→22/yr by 2055 (HVAC capex compounding) — expect insurance premiums to compound above CPI over the hold.
Questions for the listing agent
- Built in 1965 — when were the roof, HVAC, electrical panel, plumbing, and water heater last replaced?
- What's the actual annual flood-insurance premium (NFIP or private), and is the property in a SFHA with mandatory coverage?
- Is there a deadline driving the sale (1031 exchange, divorce, estate, relocation)? That informs how much negotiation room exists.
- Crime grade is F in this area — have there been break-ins, vandalism, or insurance claims at this property in the last 3 years? What carrier currently insures it and at what premium?
- What's the average days-on-market for RENTAL listings here right now (not sales)? A rising rental-DOM trend means longer vacancies and softer asking-rent achievability than the comps imply.
- What's the recent tenant-quality profile in this submarket — average credit score on applications, eviction rate, late-payment / NSF rate, and stable-employment percentage? A property-management company in the area should have these aggregated.
- How much new for-sale + rental construction is in the pipeline within 1–3 miles? Heavy new supply typically softens prices + rents 12–24 months out; constrained supply supports both.
Investment metrics
- 1% rule
- 1.50% ✓
- Cap rate
- 12.49%
- Cash-on-cash
- 22.14%
- DSCR
- 1.98
- GRM
- 5.5
CMA / ARV
- ARV (on-the-fly)
- $114,000
- Comps found
- 2
Show comp detail 2 sales within ~0.75 mi
| Address | Dist | Beds/Ba | Sqft | Sold | Price | $/sf | Match |
|---|---|---|---|---|---|---|---|
| 4907 Old Mobile Ave | 0.34mi | 3/2.5 | 1,039 (+9%) | 1mo | $124,900 | $120 | 62 |
| 4507 Robinhood Dr | 0.19mi | 3/1.5 | 1,050 (+10%) | 17mo | $85,000 | $81 | 57 |
Match score weights: distance 35% · size 25% · config 20% · recency 20%. Top-matched comps best support the ARV.
Projected returns pro-forma
-3.0% appreciation · 3.0% rent growth · sell at horizon
- IRR
- -11.4%
- Equity multiple
- 0.59×
- Total profit
- $-11,036
- Equity at exit
- $14,165
- IRR
- -1.8%
- Equity multiple
- 0.88×
- Total profit
- $-3,243
- Equity at exit
- $8,214
Cash invested: $26,600 (down + closing). Projections, not guarantees.
Landlord ↔ Tenant lean methodology
- Overall (STATE)
- 90 Strongly Landlord-Friendly
- State Mississippi
- 90 Strongly Landlord-Friendly · R+11
- County
- — inherits STATE
- City
- — inherits STATE
ZIP-level market 39581
- Home prices YoY
- -10.5%
- Active inventory
- 79
- Price-to-rent
- 5.5×
Monthly cashflow live
- Estimated rent
- $1,429 high interval (Pro) →
- Mortgage (P&I)
- −$498
- Tax from tax record
- −$100 /mo · $1,203/yr
- Insurance
- −$40
- Flood insurance flood zone
- −$427 /mo · $5,118/yr
- HOA
- −$0
- Vacancy / Maint / Mgmt
- −$300
- Net cashflow
- $64
Break-even live
UW: 25.0% down · 7.5% · 30yr · 1.5% tax · 5.0% vac · 8.0% maint · 8.0% mgmt
Financing live
Cash to close
- Down payment
- $23,750
- Closing costs
- $2,850
- Reserves months
- —
- Total cash needed
- —
Loan-product check · same deal, 3 products live
Conventional
25% down · 7.5% · 30yr
- Down + closing
- —
- Monthly P&I
- —
- Monthly cashflow
- —
- DSCR
- —
- Eligible?
- —
Personal DTI + credit; lowest rate.
DSCR
20% down · 8.5% · 30yr
- Down + closing
- —
- Monthly P&I
- —
- Monthly cashflow
- —
- DSCR
- —
- Eligible?
- —
No personal income docs; deal must DSCR.
Hard money
10% down · 12.0% · 12mo
- Down + closing
- —
- Monthly P&I
- —
- Monthly cashflow
- —
- DSCR
- —
- Eligible?
- —
Short-term bridge; refi at stabilization.
Rent comps 6 comps
| Address | Beds | Baths | Sqft | Rent | $/sqft | DOM | Units | Dist |
|---|---|---|---|---|---|---|---|---|
| 4800 Long Ave Pascagoula, MS | 1.0–3.0 | 1.0–2.0 | 904 | $1,430 | $1.58 | 13d | 27 | 0.16mi |
| 5111 Orchard Ave Pascagoula, MS | 1.0–3.0 | 1.0–1.5 | 853 | $1,430 | $1.68 | 13d | 15 | 0.77mi |
| 4315 Orchard Ave Pascagoula, MS | 2.0 | 1.5 | 921 | $1,267 | $1.37 | 13d | 21 | 0.90mi |
| 3000 Brazil St Pascagoula, MS | 1.0–3.0 | 1.0 | 695 | $1,430 | $2.06 | 13d | 12 | 1.30mi |
| 4610 Legare Ave Pascagoula, MS | 3.0 | 1.0 | 975 | $1,250 | $1.28 | 21d | 1 | 1.34mi |
| 3801 Melton Dr Pascagoula, MS | 1.0–3.0 | 1.0–2.0 | 825 | $1,430 | $1.73 | 13d | 43 | 1.39mi |
Listing history 4 events
-
2026-06-19status $95,000 Pending 2 DOM
-
2026-06-18days on market $95,000 Active 2 DOM
-
2026-06-16remarks 693-char remark
-
2026-06-16$95,000 Active 1 DOM
ⓘ Source: listings_history table (triggers on properties + properties_extension) + one-shot
backfill from property_details.listing_events for pre-trigger history.
Tax reassessment forecast MS · Resets to sale price
- Current annual tax
- $1,203 · $100/mo
- Projected year-2 tax
- $1,203 · $100/mo
- Expected delta
- $0/yr ($0/mo · 0.0%)
ⓘ Screening estimate from a state-policy table — verify with the county assessor before closing.
Climate risk First Street
- Flood 7/10 Severe FEMA zone AE · 74% chance over 30 yrs
- Wildfire 3/10 Moderate
- Heat 10/10 Extreme 7 d/yr ≥105°F today · 22 d/yr by 30 yrs out
- Wind 9/10 Extreme 99% chance of damaging wind over 30 yrs
- Air quality 3/10 Moderate 2 unhealthy d/yr today · 3 by 30 yrs out
Nearby sold comps map
Loading sold comps map…
Walkable amenities ~0.75 mi
Loading nearby amenities…
Taxation est. · year 1
- Rental income
- $17,145
- − Mortgage interest
- −$5,321
- − Property taxes
- −$1,203
- − Insurance
- −$5,594
- − Repairs & maintenance
- −$1,372
- − Management
- −$1,372
- − Depreciation
- −$2,764
- Taxable loss
- −$480
- Est. tax savings @ 24.0%
- +$115
- After-tax cash flow
- $885/yr
For passive investors: Depreciation is non-cash, so a rental often shows a tax loss while cash-flowing — sheltering income. Rental losses are passive: they offset passive income freely, and up to $25,000/yr can offset ordinary (W-2) income if you actively participate and your MAGI is under $100k (phasing out to $0 by $150k); unused losses carry forward. On sale, claimed depreciation is recaptured at up to 25%, and gains may owe capital-gains tax (a 1031 exchange can defer both). Figures are a year-1 estimate at your 24.0% rate — not tax advice; consult a CPA.
Schools (NCES district)
- District
- Pascagoula-Gautier School District
- NCES district ID
- 2803480
- Math proficiency
- 40% ▼ -3.00%
- Reading proficiency
- 38% ▼ -4.00%
- Median HH income
- $41,392
- Composite
- 32.86/100
- National rank
- #5613
- State rank
- #41 of 130 in MS
Livability — Pascagoula
- Score
- 70/100
- State rank
- #41
- US rank
- #7866
Category grades
Schools grade is shown separately in the Schools card above.
Census & demographics
- Census place
- Pascagoula, MS
- County
- Jackson County · 82,196 people
- City population
- 21,731
- Metro
- Gulfport-Biloxi, MS
- Population (ZIP)
- 11,390
- Household income
- $37,927
- Rent vs Own
- Severe rent burden
- 965.0
Population outlook (Jackson County) Hauer SSP2
- Today (2025)
- 146,926 people
- By 2030
- 148,442 · +1.0%
- By 2040
- 149,631 · +1.8%
- By 2050
- 148,723 · +1.2%
- By 2075
- 147,845 · +0.6%
- By 2100
- 144,510 · -1.6%
Race, ethnicity, and origin ACS 2023
- Neighborhood character
- Diverse neighborhood (Simpson 0.66)
- Race & ethnicity
- Black 40% White 38% Hispanic / Latino 18% Two or more races 7% Asian 2%
- Hispanic origin (detail)
- Mexican 3% Puerto Rican 7% Dominican 5%
- Common ancestry
- Lithuanian 2% Serbian 2% Slovak 1%
- Foreign-born
- 8% · Canada
- Languages at home
- 82% English-only · Spanish 16% Other Indo-European 1%
Political lean MEDSL · Jackson
- 2024 margin
- Solid R (+39.9) · D 29.5% · R 69.4% · Other 1.1%
- 2008→2024 swing
- -6.4pp toward R · 2008: -33.5pp · 2024: -39.9pp
- All cycles
- 2024: R+39.9 2020: R+34.6 2016: R+39.9 2012: R+36.1 2008: R+33.5
Not yet ingested
- Civics
- —
Market trends
- HPI YoY
- ▼ -22.34%
- Current HPI
- 191.273
- Rent YoY
- —
- Metro
- Gulfport-Biloxi, MS
- State GDP YoY
- —
- F500 in state
- 0
Price history
+97.9% since first listed3 events — show timeline
- 2026-06-16 Listed $95,000 MLSU
- 2010-04-16 Sold (MLS) — MLSU
- 2010-02-16 Listed $48,000 MLSU
Property tax history
+2.0%/yrLatest (2025): $1,203 · +4.3% YoY. Source: county tax records.
Cash-flow waterfall
monthlySold comps — $/sqft
last 12 mo · ≤1 miLoading sold comps…