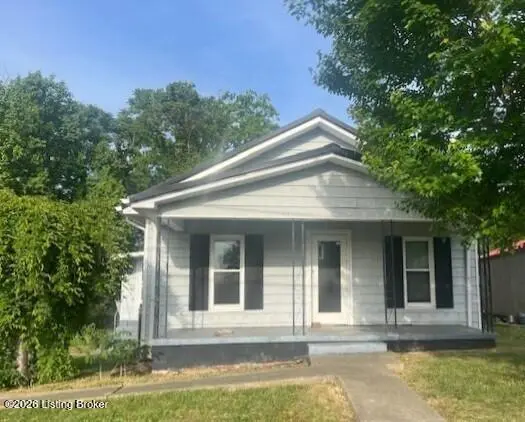
21 Knox St · North Corbin, KY
Flood risk 1/10 · Minimal
- FEMA flood zone
- X (unshaded)
- Chance of flooding over 30 yrs
- 0.0%
- Est. flood insurance / yr
- $507 – $1,088
Fire risk 2/10 · Minimal
- Est. fire insurance / yr
- $839 – $1,559
Heat risk 4/10 · Minor
- Hot days now (above 100°F)
- 7 days/yr
- Hot days in 30 yrs
- 19 days/yr
Wind risk 3/10 · Minor
- Chance of severe wind over 30 yrs
- 5.0%
Air-quality risk 2/10 · Minimal
- Unhealthy air days now
- 0 days/yr
- Unhealthy air days in 30 yrs
- 1 days/yr
Risk factors via First Street. Map © Google.
Why this score? — see what drove the B grade
The composite is a weighted blend of 9 inputs, each scored 0–100. Each bar is that input's sub-score; the figure is the points it added to the 100-point composite (weight × sub-score).
- Cash flow +30.0/30.0
- 1% rule +10.0/10.0
- DSCR +10.0/10.0
- ARV discount +7.5/15.0
- Appreciation +5.9/10.0
- Livability +3.3/5.0
- Rent growth +2.5/5.0
- Schools +2.5/10.0
- Condition / age +2.5/5.0
$64,900
🖨 Deal sheet (PDF) 📄 Offer letter ✓ Due diligence
Listing remarks
Cozy bungalow on corner lot now available. Home offers two bedrooms and one bath. Features include a detached garage, covered front and back porches with a nice size lot. Contact listing broker for additional information.
Key facts
- Covered front porch
- Corner lot
- Detached garage
Tags
Property features AI
Finance
- HOA & community: No association fee
Exterior
- Parking: Detached garage (1 car)
- Utilities: Electricity connected; One HVAC unit
- Home design: Single-family bungalow; One story; Built in 1920
- Construction: Vinyl siding; Shingle roof; Crawl space foundation
- Exterior features: Partial chain-link fencing; Corner lot
Interior
- Kitchen: First-floor kitchen
- Bedrooms: Two bedrooms on the first floor
- Bathrooms: One full bathroom
- Heating & cooling: Forced air heating; Central air conditioning
- Interior features: Five total rooms; Unfinished basement with outside entry; Living room on the first floor
- Laundry & utility: First-floor laundry
Neighborhood map
What this means for you Summary
Snapshot
- This is a 2-bed/1.0-bath single-family listed at $65k.
Deal economics
- At list price, monthly cash flow is $332 ($4k/yr) — positive.
- The deal already cash-flows at list — no discount required.
- Meets the 1% rule at list price ($994 rent vs $65k).
Location & tenants
- Location reads 66/100 on livability (#245 in KY) — a middle-class / working-renter tenant base. Strengths: crime A+, cost of living A+, housing A+; Watch: amenities F, commute F, employment F.
- Knox County (town): math 24% / reading 38% proficiency, ranked #116 of 165 in KY (top 70%) — families likely to look elsewhere, expect single-tenant / working-renter base with shorter leases; 68% free/reduced lunch — lower-income household profile, screen leases tightly.
- Zoned schools: Knox County Middle School (math 17% / reading 42%, grade F, #151 of 217 statewide, top 71%, 429 students, 81% FRL).
- Market conditions: 331 active listings in the ZIP.
Forward outlook
- In year one you build about $2k of equity ($449 loan paydown + $1k appreciation (1.8% local appreciation)).
- Knox County population projected at -16% by 2050 — secular population decline; favor cash flow + early exit over multi-decade hold.
- At projected returns (1.8% appreciation + 3.0% rent growth), your $18k cash investment doubles in ~4 years — after that, you're playing with house money.
Negotiation context
- Only 6 days on market — expect competitive offers; lowballing is unlikely to land.
- Current owner paid $44k; 47% above their basis — modest negotiation headroom, anchor on the comps not their cost.
Risks & watch-outs
- Watch-outs: built in 1920 — expect roof / HVAC / electrical / plumbing capex.
Questions for the listing agent
- Built in 1920 — when were the roof, HVAC, electrical panel, plumbing, and water heater last replaced?
- Is there a deadline driving the sale (1031 exchange, divorce, estate, relocation)? That informs how much negotiation room exists.
- Schools are F-rated, which usually means shorter tenancies and higher turnover. Who's the typical renter profile here, and what's been the actual vacancy rate?
- What's the average days-on-market for RENTAL listings here right now (not sales)? A rising rental-DOM trend means longer vacancies and softer asking-rent achievability than the comps imply.
- What's the recent tenant-quality profile in this submarket — average credit score on applications, eviction rate, late-payment / NSF rate, and stable-employment percentage? A property-management company in the area should have these aggregated.
- How much new for-sale + rental construction is in the pipeline within 1–3 miles? Heavy new supply typically softens prices + rents 12–24 months out; constrained supply supports both.
Investment metrics
- 1% rule
- 1.53% ✓
- Cap rate
- 12.43%
- Cash-on-cash
- 21.92%
- DSCR
- 1.98
- GRM
- 5.4
CMA / ARV
- ARV (on-the-fly)
- $162,440
- Comps found
- 11
Show comp detail 11 sales within ~0.75 mi
| Address | Dist | Beds/Ba | Sqft | Sold | Price | $/sf | Match |
|---|---|---|---|---|---|---|---|
| 770 North Hancock Ave | 0.33mi | 2/1.0 | 996 (-5%) | 13mo | $160,000 | $161 | 65 |
| 850 Hancock Ave | 0.33mi | 3/1.5 (+1) | 1,036 (-1%) | 13mo | $160,500 | $155 | 65 |
| 135 Lewis St | 0.59mi | 3/1.0 (+1) | 1,008 (-4%) | 2mo | $130,000 | $129 | 59 |
| 64 Beech Tree Ln Ln | 0.55mi | 2/2.0 | 1,080 (+3%) | 9mo | $179,900 | $167 | 58 |
| 507 Caldwell St | 0.44mi | 3/1.0 (+1) | 1,104 (+5%) | 12mo | $166,200 | $151 | 56 |
| 252 Cherry Ave | 0.63mi | 2/1.0 | 1,008 (-4%) | 12mo | $187,000 | $186 | 54 |
| 195 Nelson St | 0.18mi | 3/2.0 (+1) | 1,194 (+14%) | 7mo | $180,000 | $151 | 54 |
| 156 Sampson St | 0.57mi | 3/2.0 (+1) | 1,064 (+2%) | 12mo | $193,500 | $182 | 52 |
| 231 Hatfield St | 0.68mi | 3/1.0 (+1) | 1,018 (-3%) | 12mo | $158,762 | $156 | 49 |
| 602 Caldwell St | 0.32mi | 3/2.0 (+1) | 1,117 (+7%) | 21mo | $75,000 | $67 | 48 |
| 95 East Cypress St | 0.66mi | 3/1.0 (+1) | 1,000 (-5%) | 22mo | $62,000 | $62 | 38 |
Match score weights: distance 35% · size 25% · config 20% · recency 20%. Top-matched comps best support the ARV.
Projected returns pro-forma
1.82% appreciation · 3.0% rent growth · sell at horizon
- IRR
- 25.8%
- Equity multiple
- 2.38×
- Total profit
- $25,030
- Equity at exit
- $24,984
- IRR
- 27.6%
- Equity multiple
- 4.56×
- Total profit
- $64,667
- Equity at exit
- $35,512
Cash invested: $18,172 (down + closing). Projections, not guarantees.
Landlord ↔ Tenant lean methodology
- Overall (STATE)
- 83 Strongly Landlord-Friendly
- State Kentucky
- 83 Strongly Landlord-Friendly · R+16
- County
- — inherits STATE
- City
- — inherits STATE
ZIP-level market 40701
- Home prices YoY
- 0.6%
- Active inventory
- 331
- Price-to-rent
- 5.4×
Monthly cashflow live
- Estimated rent
- $994 medium interval (Pro) →
- Mortgage (P&I)
- −$340
- Tax from tax record
- −$86 /mo · $1,030/yr
- Insurance
- −$27
- HOA
- −$0
- Vacancy / Maint / Mgmt
- −$209
- Net cashflow
- $332
Break-even live
Sensitivity live
| Price | -10% $369 | -5% $350 | +0% $332 | +5% $314 | +10% $295 |
|---|---|---|---|---|---|
| Rent | -10% $253 | -5% $293 | +0% $332 | +5% $371 | +10% $410 |
| Rate | -1.0pp $365 | -0.5pp $348 | base $332 | +0.5pp $315 | +1.0pp $298 |
UW: 25.0% down · 7.5% · 30yr · 1.5% tax · 5.0% vac · 8.0% maint · 8.0% mgmt
Financing live
Cash to close
- Down payment
- $16,225
- Closing costs
- $1,947
- Reserves months
- —
- Total cash needed
- —
Loan-product check · same deal, 3 products live
Conventional
25% down · 7.5% · 30yr
- Down + closing
- —
- Monthly P&I
- —
- Monthly cashflow
- —
- DSCR
- —
- Eligible?
- —
Personal DTI + credit; lowest rate.
DSCR
20% down · 8.5% · 30yr
- Down + closing
- —
- Monthly P&I
- —
- Monthly cashflow
- —
- DSCR
- —
- Eligible?
- —
No personal income docs; deal must DSCR.
Hard money
10% down · 12.0% · 12mo
- Down + closing
- —
- Monthly P&I
- —
- Monthly cashflow
- —
- DSCR
- —
- Eligible?
- —
Short-term bridge; refi at stabilization.
Listing history 6 events
-
2026-06-17status $64,900 Pending 6 DOM
-
2026-06-16days on market $64,900 Active 6 DOM
-
2026-06-15days on market $64,900 Active 5 DOM
-
2026-06-13days on market $64,900 Active 3 DOM
-
2026-06-12remarks 221-char remark
-
2026-06-12$64,900 Active 2 DOM
ⓘ Source: listings_history table (triggers on properties + properties_extension) + one-shot
backfill from property_details.listing_events for pre-trigger history.
Tax reassessment forecast KY · Resets to sale price
- Current annual tax
- $1,030 · $86/mo
- Projected year-2 tax
- $1,030 · $86/mo
- Expected delta
- $0/yr ($0/mo · 0.0%)
ⓘ Screening estimate from a state-policy table — verify with the county assessor before closing.
Climate risk First Street
- Flood 1/10 Low FEMA zone X (unshaded) · 0% chance over 30 yrs
- Wildfire 2/10 Low
- Heat 4/10 Moderate 7 d/yr ≥100°F today · 19 d/yr by 30 yrs out
- Wind 3/10 Moderate 5% chance of damaging wind over 30 yrs
- Air quality 2/10 Low 0 unhealthy d/yr today · 1 by 30 yrs out
Nearby sold comps map
Loading sold comps map…
Walkable amenities ~0.75 mi
Loading nearby amenities…
Taxation est. · year 1
- Rental income
- $11,926
- − Mortgage interest
- −$3,635
- − Property taxes
- −$1,030
- − Insurance
- −$324
- − Repairs & maintenance
- −$954
- − Management
- −$954
- − Depreciation
- −$1,888
- Taxable income
- $3,140
- Est. tax owed @ 24.0%
- −$754
- After-tax cash flow
- $3,229/yr
For passive investors: Depreciation is non-cash, so a rental often shows a tax loss while cash-flowing — sheltering income. Rental losses are passive: they offset passive income freely, and up to $25,000/yr can offset ordinary (W-2) income if you actively participate and your MAGI is under $100k (phasing out to $0 by $150k); unused losses carry forward. On sale, claimed depreciation is recaptured at up to 25%, and gains may owe capital-gains tax (a 1031 exchange can defer both). Figures are a year-1 estimate at your 24.0% rate — not tax advice; consult a CPA.
Schools (NCES district)
- District
- Knox County
- NCES district ID
- 2103150
- Math proficiency
- 24% ▼ -20.00%
- Reading proficiency
- 38% ▼ -19.00%
- Median HH income
- $24,965
- Composite
- 24.59/100
- National rank
- #7636
- State rank
- #116 of 165 in KY
Livability — North Corbin
- Score
- 66/100
- State rank
- #245
- US rank
- #12260
Category grades
Schools grade is shown separately in the Schools card above.
Census & demographics
- Census place
- North Corbin, KY
- Population (ZIP)
- 29,767
Population outlook (Knox County) Hauer SSP2
- Today (2025)
- 30,741 people
- By 2030
- 29,887 · -2.8%
- By 2040
- 27,940 · -9.1%
- By 2050
- 25,826 · -16.0%
- By 2075
- 20,895 · -32.0%
- By 2100
- 16,238 · -47.2%
Race, ethnicity, and origin ACS 2023
- Neighborhood character
- Predominantly White (95%)
- Race & ethnicity
- White 95% Two or more races 3% Hispanic / Latino 1%
- Common ancestry
- Serbian 2% Slovak 2% Italian 1%
- Foreign-born
- 1% · Canada
- Languages at home
- 99% English-only · Spanish 1%
Political lean MEDSL · Knox
- 2024 margin
- Solid R (+71.1) · D 13.8% · R 85.0% · Other 1.2%
- 2008→2024 swing
- -26.6pp toward R · 2008: -44.6pp · 2024: -71.1pp
- All cycles
- 2024: R+71.1 2020: R+67.0 2016: R+67.7 2012: R+53.9 2008: R+44.6
Not yet ingested
- Civics
- —
Market trends
- HPI YoY
- ▲ 1.82%
- Current HPI
- 294.7961
- Rent YoY
- —
- Metro
- —
- State GDP YoY
- ▲ 1.81%
- F500 in state
- 4
Industry mix (Fortune 500 HQ in KY)
| Industry | F500 HQs | Revenue |
|---|---|---|
| Healthcare | 1 | $118B |
|
||
| Food / Beverage | 1 | $7B |
|
||
Price history
+46.5% since first listed2 events — show timeline
- 2026-06-11 Listed $64,900 Metro Search MLS
- 2003-04-01 Sold (Public Records) $44,300 Public Records
Property tax history
+7.5%/yrLatest (2025): $1,030 · +1.7% YoY. Source: county tax records.
Cash-flow waterfall
monthlySold comps — $/sqft
last 12 mo · ≤1 miLoading sold comps…