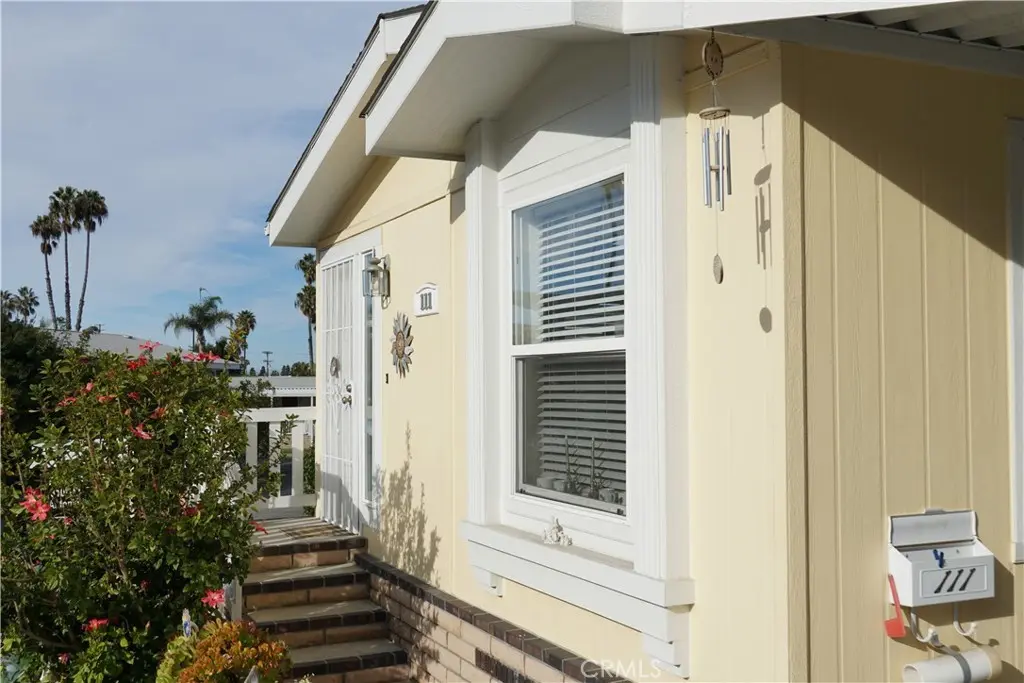
2550 Pacific Coast Hwy #111 · Torrance, CA
Flood risk 1/10 · Minimal
- FEMA flood zone
- X (unshaded)
- Chance of flooding over 30 yrs
- 0.0%
- Est. flood insurance / yr
- $507 – $1,088
Fire risk 1/10 · Minimal
- Est. fire insurance / yr
- $659 – $1,223
Heat risk 3/10 · Minor
- Hot days now (above 86°F)
- 7 days/yr
- Hot days in 30 yrs
- 22 days/yr
Wind risk 1/10 · Minimal
- Chance of severe wind over 30 yrs
- —
Air-quality risk 5/10 · Moderate
- Unhealthy air days now
- 7 days/yr
- Unhealthy air days in 30 yrs
- 7 days/yr
Risk factors via First Street. Map © Google.
Why this score? — see what drove the B- grade
The composite is a weighted blend of 9 inputs, each scored 0–100. Each bar is that input's sub-score; the figure is the points it added to the 100-point composite (weight × sub-score).
- Cash flow +27.5/30.0
- DSCR +9.7/10.0
- ARV discount +7.5/15.0
- 1% rule +6.2/10.0
- Schools +5.9/10.0
- Livability +3.8/5.0
- Rent growth +3.6/5.0
- Condition / age +2.5/5.0
- Appreciation +0.0/10.0
$250,000
🖨 Deal sheet (PDF) 📄 Offer letter ✓ Due diligence
Listing remarks MLS
One of a kind on this South Torrance manufactured home park. Skyline community for families all ages. Set across Rolling Hills Plaza; great choices of restaurants, dance studios, cafes, schools, movie theatres, Torrance airport, and minutes from the Hollywood Riviera and the great Pacific Ocean. Skyline offers: private gated entrance with a clubhouse, swimming pool, and a dog park. The unit is located in a quite setting within in short distance to all amenities. 980 square feet of cozy living space, traditional kitchen with Oak cabinets, gas stove, oven, refrigerator, and dishwasher. The unit has a well maintained garden to adorn the front steps . The perfect retreat at the South Bay and a place you'll call home.
Key facts
- Dog park
- Clubhouse
- Swimming pool
Tags
Neighborhood map
What this means for you Summary
Snapshot
- This is a 2-bed/2.0-bath manufactured listed at $250k.
Deal economics
- At list price, monthly cash flow is $742 ($9k/yr) — positive.
- The deal already cash-flows at list — no discount required.
- Meets the 1% rule at list price ($3k rent vs $250k).
- Recommended offer: $228k (9.0% below list) — sets the bar for market timing.
- Cap rate 9.9% vs local median 2.1% in Torrance — top-decile yield for the area; either an underpriced asset or a hidden risk that comps aren't pricing in. Stress-test before assuming the spread holds.
Location & tenants
- Location reads 76/100 on livability (#95 in CA, #3,501 nationally) — a middle-class / working-renter tenant base. Strengths: amenities A+, commute A+, employment A+; Watch: health & safety C-, crime D+, cost of living F.
- Torrance Unified (urban): math 62% / reading 67% proficiency, ranked #150 of 1,400 in CA (top 11%) — acceptable for families but not a draw, mixed tenant base, ~2y average lease; only 20% free/reduced lunch — higher-income household profile.
- Zoned schools: Walteria Elementary (626 students, 15% FRL); Edward J. Richardson Middle (661 students, 16% FRL); South High (math 24% / reading 24%, grade F, #826 of 1,170 statewide, top 80%, 1,841 students, 16% FRL) — zoned schools at 16% FRL track the district average.
- Zoned-school proficiency averages 24% at this address vs 64% district-wide (-40 pts) — the specific schools serving this property underperform the Torrance Unified average; the district grade overstates school quality for this exact location.
- Market conditions: Rents rising fast (+4.5%/yr); 61 active listings in the ZIP; 33 comparable units currently listed for rent nearby; rentals at typical pace (median 18d on market — plan ~3-4 weeks tenant-placement turnaround); high-income renter base; 19,697 units permitted in Los Angeles County in 2024 (9,426 in 5+ unit buildings).
Forward outlook
- Local home prices are declining (-3.0%/yr); year-one equity from $2k of loan paydown is wiped out by about $8k of value loss. Plan a longer hold.
- Los Angeles County population projected at +9% by 2050 — modest demand growth; plan on rents tracking national, not racing it.
- At projected returns (-3.0% appreciation + 4.5% rent growth), your $70k cash investment doubles in ~8 years — after that, you're playing with house money.
Negotiation context
- It's been on market 119 days — a 9% lower offer ($228k) is reasonable based on typical stale-listing flexibility.
- 8 sale attempts since 25y ago; this cycle's ask has dropped $20k (7%) from the opening price — seller is motivated, your offer sets the floor, not the list.
Questions for the listing agent
- It's been on market 119 days. Have you received any prior offers? Is the seller open to a 9% concession, seller financing, or rate buy-down credit?
- Why hasn't it sold? Are there any deal-killer items the seller is aware of (foundation, flood, title, zoning, code violations)?
- Is there a deadline driving the sale (1031 exchange, divorce, estate, relocation)? That informs how much negotiation room exists.
- Schools are A-rated — typically a magnet for longer-tenancy family renters. What's the average tenant stay here, and is there a school-zone premium baked into asking?
- Crime grade is D in this area — have there been break-ins, vandalism, or insurance claims at this property in the last 3 years? What carrier currently insures it and at what premium?
- What's the average days-on-market for RENTAL listings here right now (not sales)? A rising rental-DOM trend means longer vacancies and softer asking-rent achievability than the comps imply.
- What's the recent tenant-quality profile in this submarket — average credit score on applications, eviction rate, late-payment / NSF rate, and stable-employment percentage? A property-management company in the area should have these aggregated.
- How much new for-sale + rental construction is in the pipeline within 1–3 miles? Heavy new supply typically softens prices + rents 12–24 months out; constrained supply supports both.
Investment metrics
- 1% rule
- 1.12% ✓
- Cap rate
- 9.85%
- Cash-on-cash
- 12.71%
- DSCR
- 1.57
- GRM
- 7.4
CMA / ARV
- ARV (median comp)
- $147,468
- List price
- $250,000
- Delta
- 69.53%
- Verdict
- OVERPRICED
- Comps
- 8 within 1.0 mi
Show comp detail 11 sales within ~0.75 mi
| Address | Dist | Beds/Ba | Sqft | Sold | Price | $/sf | Match |
|---|---|---|---|---|---|---|---|
| 2550 Pacific Cost Hwy. #36 | 0.00mi | 2/2.0 | 1,040 (+7%) | 3mo | $185,000 | $178 | 85 |
| 2550 Pacific Coast Hwy #114 | 0.16mi | 2/1.0 | 1,000 (+3%) | 10mo | $125,000 | $125 | 75 |
| 2550 Pacific Coast Hwy. #63A | 0.04mi | 2/2.0 | 1,080 (+11%) | 6mo | $135,000 | $125 | 74 |
| 2550 Pacific Coast Hwy #31 | 0.19mi | 2/2.0 | 1,000 (+3%) | 16mo | $99,500 | $100 | 73 |
| 2550 Pacific Coast Hwy #47 | 0.05mi | 2/2.0 | 1,100 (+13%) | 6mo | $110,000 | $100 | 71 |
| 2550 Pacific Coast Hwy #148 | 0.00mi | 2/2.0 | 836 (-14%) | 8mo | $225,000 | $269 | 71 |
| 2550 Pacific Coast Hwy #150 | 0.00mi | 2/2.0 | 1,056 (+9%) | 21mo | $279,000 | $264 | 67 |
| 2550 Pacific Coast Hwy. #146 | 0.00mi | 2/2.0 | 1,095 (+13%) | 15mo | $240,000 | $219 | 66 |
| 2550 Pacific Coast Hwy #169 | 0.20mi | 2/2.0 | 1,080 (+11%) | 9mo | $125,000 | $116 | 65 |
| 2550 Pacific Coast Hwy #1 | 0.00mi | 3/2.0 (+1) | 1,104 (+14%) | 20mo | $275,000 | $249 | 56 |
| 2550 Pacific Coast Highway #104 | 0.16mi | 2/2.0 | 1,080 (+11%) | 22mo | $257,500 | $238 | 55 |
Match score weights: distance 35% · size 25% · config 20% · recency 20%. Top-matched comps best support the ARV.
Projected returns pro-forma
-3.0% appreciation · 4.55% rent growth · sell at horizon
- IRR
- 4.0%
- Equity multiple
- 1.16×
- Total profit
- $11,047
- Equity at exit
- $37,276
- IRR
- 14.8%
- Equity multiple
- 2.27×
- Total profit
- $88,761
- Equity at exit
- $21,615
Cash invested: $70,000 (down + closing). Projections, not guarantees.
Landlord ↔ Tenant lean methodology
- Overall (STATE)
- 18 Strongly Tenant-Friendly
- State California
- 18 Strongly Tenant-Friendly · D+13
- County
- — inherits STATE
- City
- — inherits STATE
ZIP-level market 90505
- Rents YoY
- 4.5%
- Active inventory
- 61
- Price-to-rent
- 7.4×
Monthly cashflow live
- Estimated rent
- $2,801 high interval (Pro) →
- Mortgage (P&I)
- −$1,311
- Tax from tax record
- −$56 /mo · $670/yr
- Insurance
- −$104
- HOA
- −$0
- Vacancy / Maint / Mgmt
- −$588
- Net cashflow
- $742
Break-even live
Sensitivity live
| Price | -10% $883 | -5% $812 | +0% $742 | +5% $671 | +10% $600 |
|---|---|---|---|---|---|
| Rent | -10% $520 | -5% $631 | +0% $742 | +5% $852 | +10% $963 |
| Rate | -1.0pp $868 | -0.5pp $805 | base $742 | +0.5pp $677 | +1.0pp $611 |
UW: 25.0% down · 7.5% · 30yr · 1.5% tax · 5.0% vac · 8.0% maint · 8.0% mgmt
Financing live
Cash to close
- Down payment
- $62,500
- Closing costs
- $7,500
- Reserves months
- —
- Total cash needed
- —
Loan-product check · same deal, 3 products live
Conventional
25% down · 7.5% · 30yr
- Down + closing
- —
- Monthly P&I
- —
- Monthly cashflow
- —
- DSCR
- —
- Eligible?
- —
Personal DTI + credit; lowest rate.
DSCR
20% down · 8.5% · 30yr
- Down + closing
- —
- Monthly P&I
- —
- Monthly cashflow
- —
- DSCR
- —
- Eligible?
- —
No personal income docs; deal must DSCR.
Hard money
10% down · 12.0% · 12mo
- Down + closing
- —
- Monthly P&I
- —
- Monthly cashflow
- —
- DSCR
- —
- Eligible?
- —
Short-term bridge; refi at stabilization.
Rent comps 33 comps
| Address | Beds | Baths | Sqft | Rent | $/sqft | DOM | Units | Dist |
|---|---|---|---|---|---|---|---|---|
| 25930 Rolling Hills Rd Torrance, CA | 1.0–2.0 | 1.0–1.5 | 1055 | $2,950 | $2.80 | 3d | 5 | 0.52mi |
| 25925 Narbonne Ave #3 Lomita, CA | 2.0 | 1.0 | 805 | $2,550 | $3.17 | 26d | 1 | 0.59mi |
| 25925 Narbonne Ave Lomita, CA | 1.0–2.0 | 1.0 | 805 | $2,550 | $3.17 | 45d | 2 | 0.59mi |
| 3603 W Hidden Ln #118 Rolling Hills Estates, CA | 1.0 | 1.0 | 659 | $2,250 | $3.41 | 5d | 1 | 0.64mi |
| 26110 Narbonne Ave Unit 10 Lomita, CA | 2.0 | 1.0 | 975 | $2,307 | $2.37 | 45d | 1 | 0.67mi |
| 26110 Narbonne Ave Unit 16 Lomita, CA | 1.0 | 1.0 | 700 | $1,779 | $2.54 | 45d | 1 | 0.67mi |
| 26110 Narbonne Ave Apt 9 Lomita, CA | 2.0 | 2.0 | 1100 | $2,399 | $2.18 | 45d | 1 | 0.67mi |
| 26019 Oak St Lomita, CA | 2.0 | 1.0 | 711 | $1,925 | $2.71 | 3d | 2 | 0.75mi |
| 25907 Oak St Unit 19 Lomita, CA | 2.0 | 1.5 | 1014 | $2,795 | $2.76 | 45d | 1 | 0.77mi |
| 25907 Oak St Unit 19 Lomita, CA | 2.0 | 1.5 | 1014 | $2,795 | $2.76 | 9d | 1 | 0.77mi |
| 15 Lantana Pl Unit A Rolling Hills Estates, CA | 1.0 | 1.0 | 1000 | $4,500 | $4.50 | 0d | 1 | 0.77mi |
| 25233 Bigelow Rd Unit 4 Torrance, CA | 1.0 | 1.0 | 700 | $1,995 | $2.85 | 1d | 1 | 0.79mi |
| 25230 Loytan St Torrance, CA | 1.0 | 1.0 | 700 | $2,250 | $3.21 | 1d | 1 | 0.79mi |
| 25846 Oak St Unit 13 Lomita, CA | 2.0 | 1.0 | 992 | $2,495 | $2.52 | 7d | 1 | 0.81mi |
| 3305 Dalemead St Torrance, CA | 2.0 | 2.5 | 1000 | $4,150 | $4.15 | 45d | 1 | 1.02mi |
| 24836 Narbonne Ave Lomita, CA | 2.0 | 1.0 | 740 | $2,995 | $4.05 | 45d | 1 | 1.03mi |
| 25822 Walnut St Lomita, CA | 2.0 | 1.0 | 900 | $2,350 | $2.61 | 45d | 1 | 1.11mi |
| 49 Hitching Post Dr Unit 1 Rolling Hills Estates, CA | 2.0 | 2.0 | 750 | $4,500 | $6.00 | 1d | 1 | 1.12mi |
| 24410 Crenshaw Blvd Torrance, CA | 2.0 | 2.0 | 1010 | $2,795 | $2.77 | 5d | 1 | 1.17mi |
| 25110 Eshelman Ave Lomita, CA | 2.0 | 1.5 | 800 | $2,245 | $2.81 | 12d | 1 | 1.19mi |
| 1800 255th St Unit 1812-A Lomita, CA | 2.0 | 1.0 | 750 | $2,145 | $2.86 | 45d | 1 | 1.28mi |
| 1724 260th St Lomita, CA | 2.0 | 2.0 | 1000 | $3,350 | $3.35 | 9d | 1 | 1.29mi |
| 3650 Newton St Torrance, CA | 2.0 | 1.5 | 950 | $3,400 | $3.58 | 26d | 1 | 1.31mi |
| 2457 Lomita Blvd Lomita, CA | 2.0 | 1.0–2.0 | 878 | $5,036 | $5.74 | 0d | 14 | 1.34mi |
| 24510 Park St Torrance, CA | 2.0 | 1.0 | 878 | $3,500 | $3.99 | 9d | 1 | 1.34mi |
| 24638 Eshelman Ave Unit 1/4 Lomita, CA | 2.0 | 1.0 | 950 | $2,950 | $3.11 | 45d | 1 | 1.37mi |
| 24636 Eshelman Ave Lomita, CA | 2.0 | 1.0 | 950 | $2,950 | $3.11 | 6d | 1 | 1.37mi |
| 25109 Ebony Ln Lomita, CA | 1.0 | 1.0 | 700 | $1,839 | $2.63 | 45d | 1 | 1.39mi |
| 1661 259th St Harbor City, CA | 1.0 | 1.0 | 650 | $1,895 | $2.92 | 18d | 1 | 1.43mi |
| 1661 259th St Harbor City, CA | 1.0 | 1.0 | 800 | $1,995 | $2.49 | 17d | 1 | 1.43mi |
| 2217 Estribo Dr Rolling Hills Estates, CA | 3.0 | 2.0 | 1000 | $6,600 | $6.60 | 45d | 1 | 1.48mi |
| 1648 255th St W Harbor City, CA | 2.0 | 2.0 | 800 | $3,400 | $4.25 | 45d | 1 | 1.49mi |
| 1625 257th St Unit 07 Harbor City, CA | 1.0 | 1.0 | 600 | $1,750 | $2.92 | 26d | 1 | 1.49mi |
Listing history 35 events
-
2026-06-21days on market $250,000 Active 119 DOM
-
2026-06-18days on market $250,000 Active 116 DOM
-
2026-06-17days on market $250,000 Active 115 DOM
-
2026-06-16days on market $250,000 Active 114 DOM
-
2026-06-15days on market $250,000 Active 113 DOM
-
2026-06-13days on market $250,000 Active 111 DOM
-
2026-06-13days on market $250,000 Active 110 DOM
-
2026-06-09days on market $250,000 Active 107 DOM
-
2026-06-08days on market $250,000 Active 106 DOM
-
2026-06-07pricedays on market $250,000 Active 105 DOM
-
2026-06-04days on market $270,000 Active 102 DOM
-
2026-06-03days on market $270,000 Active 101 DOM
-
2026-05-31days on market $270,000 Active 100 DOM
-
2026-02-20$270,000 Active 724-char remark
Show marketing remark (724 chars)
One of a kind on this South Torrance manufactured home park. Skyline community for families all ages. Set across Rolling Hills Plaza; great choices of restaurants, dance studios, cafes, schools, movie theatres, Torrance airport, and minutes from the Hollywood Riviera and the great Pacific Ocean. Skyline offers: private gated entrance with a clubhouse, swimming pool, and a dog park. The unit is located in a quite setting within in short distance to all amenities. 980 square feet of cozy living space, traditional kitchen with Oak cabinets, gas stove, oven, refrigerator, and dishwasher. The unit has a well maintained garden to adorn the front steps . The perfect retreat at the South Bay and a place you'll call home.
-
2025-10-16historical
-
2025-06-18price $280,000
-
2025-04-19$290,000 Active
-
2025-04-15historical
-
2024-12-19$290,000 Active
-
2024-12-18historical
-
2023-01-13soldstatus $235,000 Closed Sale
-
2022-11-16historical Active Under Contract
-
2022-09-21status Active
-
2022-09-20price $235,000
-
2022-09-20status Active
-
2022-06-29price $260,000
-
2022-03-28price $279,000
-
2022-03-11price $299,000
-
2022-02-10price $299,999
-
2022-02-02$302,500 Active
-
2022-02-02historical
-
2021-12-09price $302,500
-
2021-11-02$309,000 Active
-
2001-10-19soldstatus $31,500
-
2001-08-16$34,950
ⓘ Source: listings_history table (triggers on properties + properties_extension) + one-shot
backfill from property_details.listing_events for pre-trigger history.
Tax reassessment forecast CA · Resets to sale price
- Current annual tax
- $670 · $56/mo
- Projected year-2 tax
- $1,900 · $158/mo
- Expected delta
- +$1,230/yr (+$103/mo · 183.8%)
ⓘ Screening estimate from a state-policy table — verify with the county assessor before closing.
Climate risk First Street
- Flood 1/10 Low FEMA zone X (unshaded) · 0% chance over 30 yrs
- Wildfire 1/10 Low
- Heat 3/10 Moderate 7 d/yr ≥86°F today · 22 d/yr by 30 yrs out
- Wind 1/10 Low
- Air quality 5/10 Major 7 unhealthy d/yr today · 7 by 30 yrs out
Nearby sold comps map
Loading sold comps map…
Walkable amenities ~0.75 mi
Loading nearby amenities…
Taxation est. · year 1
- Rental income
- $33,610
- − Mortgage interest
- −$14,004
- − Property taxes
- −$670
- − Insurance
- −$1,250
- − Repairs & maintenance
- −$2,689
- − Management
- −$2,689
- − Depreciation
- −$7,273
- Taxable income
- $5,036
- Est. tax owed @ 24.0%
- −$1,209
- After-tax cash flow
- $7,691/yr
For passive investors: Depreciation is non-cash, so a rental often shows a tax loss while cash-flowing — sheltering income. Rental losses are passive: they offset passive income freely, and up to $25,000/yr can offset ordinary (W-2) income if you actively participate and your MAGI is under $100k (phasing out to $0 by $150k); unused losses carry forward. On sale, claimed depreciation is recaptured at up to 25%, and gains may owe capital-gains tax (a 1031 exchange can defer both). Figures are a year-1 estimate at your 24.0% rate — not tax advice; consult a CPA.
Schools (NCES district)
- District
- Torrance Unified
- NCES district ID
- 0639420
- Math proficiency
- 62% ▲ 2.00%
- Reading proficiency
- 67% ▬ 0.00%
- Median HH income
- $78,640
- Composite
- 58.96/100
- National rank
- #1969
- State rank
- #150 of 1400 in CA
Livability — Torrance
- Score
- 76/100
- State rank
- #95
- US rank
- #3501
Category grades
Schools grade is shown separately in the Schools card above.
Census & demographics
- Census place
- Torrance, CA
- County
- Los Angeles County · 9,444,647 people
- City population
- 153,473
- Metro
- Los Angeles-Long Beach-Anaheim, CA
- Population (ZIP)
- 35,148
- Household income
- $115,593
- Rent vs Own
- Severe rent burden
- 1527.0
Population outlook (Los Angeles County) Hauer SSP2
- Today (2025)
- 10,940,515 people
- By 2030
- 11,256,481 · +2.9%
- By 2040
- 11,729,929 · +7.2%
- By 2050
- 11,948,407 · +9.2%
- By 2075
- 11,818,114 · +8.0%
- By 2100
- 10,842,928 · -0.9%
Race, ethnicity, and origin ACS 2023
- Neighborhood character
- Diverse neighborhood (Simpson 0.69)
- Race & ethnicity
- Asian 41% White 35% Hispanic / Latino 14% Two or more races 12% Black 3%
- Hispanic origin (detail)
- Mexican 8%
- Common ancestry
- Romanian 2% Portuguese 1% Slovak 1%
- Foreign-born
- 31% · South Korea, Canada, China
- Languages at home
- 60% English-only · Other Asian/Pacific 11% Korean 8% Spanish 7%
Political lean MEDSL · Los Angeles
- 2024 margin
- Solid D (+32.9) · D 64.8% · R 31.9% · Other 3.3%
- 2008→2024 swing
- -7.4pp toward R · 2008: 40.4pp · 2024: 32.9pp
- All cycles
- 2024: D+32.9 2020: D+44.2 2016: D+48.0 2012: D+40.0 2008: D+40.4
Not yet ingested
- Civics
- —
Market trends
- HPI YoY
- ▼ -906.04%
- Current HPI
- 352.4976
- Rent YoY
- ▲ 4.55%
- Metro
- Los Angeles-Long Beach-Anaheim, CA
- State GDP YoY
- ▲ 3.21%
- F500 in state
- 116
Industry mix (Fortune 500 HQ in CA)
| Industry | F500 HQs | Revenue |
|---|---|---|
| Technology | 27 | $1,492B |
|
||
| Financial Services | 3 | $174B |
|
||
| Retail | 3 | $44B |
|
||
| Insurance | 3 | $26B |
|
||
| Media / Entertainment | 2 | $115B |
|
||
| Pharmaceuticals / Biotech | 2 | $62B |
|
||
Price history
+672.5% since first listed22 events — show timeline
- 2026-02-20 Listed $270,000 CRMLS
- 2025-10-16 Listing Removed — CRMLS
- 2025-06-18 Price Changed $280,000 CRMLS
- 2025-04-19 Listed $290,000 CRMLS
- 2025-04-15 Listing Removed — CRMLS
- 2024-12-19 Listed $290,000 CRMLS
- 2024-12-18 Coming Soon — CRMLS
- 2023-01-13 Sold (MLS) $235,000 CRMLS
- 2022-11-16 Contingent — CRMLS
- 2022-09-21 Relisted — CRMLS
- 2022-09-20 Price Changed $235,000 CRMLS
- 2022-09-20 Relisted — CRMLS
- 2022-06-29 Price Changed $260,000 CRMLS
- 2022-03-28 Price Changed $279,000 CRMLS
- 2022-03-11 Price Changed $299,000 CRMLS
- 2022-02-10 Price Changed $299,999 CRMLS
- 2022-02-02 Listing Removed — CRMLS
- 2022-02-02 Listed $302,500 CRMLS
- 2021-12-09 Price Changed $302,500 CRMLS
- 2021-11-02 Listed $309,000 CRMLS
- 2001-10-19 Sold (MLS) $31,500 CRMLS
- 2001-08-16 Listed $34,950 CRMLS
Property tax history
+3.4%/yrLatest (2025): $670 · +3.4% YoY. Source: county tax records.
Cash-flow waterfall
monthlySold comps — $/sqft
last 12 mo · ≤1 miLoading sold comps…