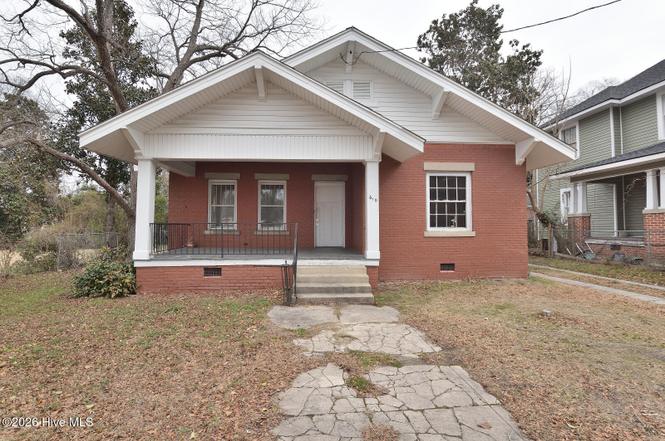
610 Marigold St · Rocky Mount, NC
Flood risk 1/10 · Minimal
- FEMA flood zone
- X (unshaded)
- Chance of flooding over 30 yrs
- 0.0%
- Est. flood insurance / yr
- $507 – $1,088
Fire risk 3/10 · Minor
- Est. fire insurance / yr
- $906 – $1,684
Heat risk 8/10 · Major
- Hot days now (above 107°F)
- 7 days/yr
- Hot days in 30 yrs
- 16 days/yr
Wind risk 6/10 · Moderate
- Chance of severe wind over 30 yrs
- 76.0%
Air-quality risk 2/10 · Minimal
- Unhealthy air days now
- 1 days/yr
- Unhealthy air days in 30 yrs
- 2 days/yr
Risk factors via First Street. Map © Google.
Why this score? — see what drove the B grade
The composite is a weighted blend of 9 inputs, each scored 0–100. Each bar is that input's sub-score; the figure is the points it added to the 100-point composite (weight × sub-score).
- Cash flow +29.2/30.0
- ARV discount +15.0/15.0
- DSCR +10.0/10.0
- 1% rule +7.0/10.0
- Livability +3.5/5.0
- Rent growth +2.5/5.0
- Condition / age +2.5/5.0
- Schools +2.0/10.0
- Appreciation +0.0/10.0
$129,900
🖨 Deal sheet 📄 Offer letter ✓ Due diligence
Listing remarks MLS
Brick home with oak floors. Home has 3 bedrooms and 2 baths. No appliances. Great investment opportunity.
Key facts
- 0.24 acre lot
- Built 1915
- Listed 111 days
Property features AI
Finance
- Other:
- Financial info:
- HOA & community: No association
Exterior
- Parking: No parking
- Security:
- Utilities: Public water; Public sewer; Gas-powered HVAC
- Home design: Single-story house; Brick veneer exterior
- Construction: Brick veneer construction; Composition roof; One-level structure
- Exterior features: No patio or porch; No fencing; Not waterfront
Interior
- Kitchen:
- Bedrooms: Three bedrooms (all on the main level)
- Flooring: Vinyl flooring; Wood flooring
- Bathrooms: Two full bathrooms
- Heating & cooling: Gas pack heating; Central air conditioning
- Interior features: Vinyl and wood flooring; Laundry room
- Laundry & utility: Dedicated laundry room
Neighborhood map
What this means for you Summary
Snapshot
- This is a 4-bed/3.0-bath single-family listed at $130k.
Deal economics
- At list price, monthly cash flow is $453 ($5k/yr) — positive.
- The deal already cash-flows at list — no discount required.
- Meets the 1% rule at list price ($2k rent vs $130k).
- Recommended offer: $118k (9.0% below list) — sets the bar for market timing.
- Cap rate 10.5% vs local median 4.5% in Rocky Mount — top-decile yield for the area; either an underpriced asset or a hidden risk that comps aren't pricing in. Stress-test before assuming the spread holds.
Location & tenants
- Location reads 70/100 on livability (#134 in NC) — a middle-class / working-renter tenant base. Strengths: cost of living A+, housing A+, health & safety A+; Watch: schools F, crime F, amenities F.
- Edgecombe County Public Schools (rural): math 21% / reading 27% proficiency, ranked #163 of 178 in NC (top 92%) — low school quality limits family demand, transient renter base, plan for 1-2y turnover; 74% free/reduced lunch — lower-income household profile, screen leases tightly.
- Market conditions: 133 active listings in the ZIP; lower-income renter base — watch delinquency; 50 units permitted in Edgecombe County in 2024 (5 in 5+ unit buildings).
- This rent runs 42% of the median local income ($45k/yr) — at the standard rent-burdened threshold; future hikes will face affordability resistance.
Forward outlook
- Local home prices are declining (-3.0%/yr); year-one equity from $898 of loan paydown is wiped out by about $4k of value loss. Plan a longer hold.
- Edgecombe County population projected at -34% by 2050 — secular population decline; favor cash flow + early exit over multi-decade hold.
- At projected returns (-3.0% appreciation + 3.0% rent growth), your $36k cash investment doubles in ~8 years — after that, you're playing with house money.
Negotiation context
- It's been on market 112 days — a 9% lower offer ($118k) is reasonable based on typical stale-listing flexibility.
- 5 sale attempts since 2y ago; this cycle's ask is 13223% above the opening price — seller raised mid-cycle; expect resistance to lowballs.
- Current owner paid $44k; list at $130k implies a 199% gain — meaningful room to come down on a strong offer.
Risks & watch-outs
- Watch-outs: built in 1915 — expect roof / HVAC / electrical / plumbing capex.
- Climate carrying-cost: major wind risk, 76% chance of damaging wind over 30y; extreme-heat days projected 7→16/yr by 2055 (HVAC capex compounding) — expect insurance premiums to compound above CPI over the hold.
Questions for the listing agent
- It's been on market 112 days. Have you received any prior offers? Is the seller open to a 9% concession, seller financing, or rate buy-down credit?
- Built in 1915 — when were the roof, HVAC, electrical panel, plumbing, and water heater last replaced?
- Why hasn't it sold? Are there any deal-killer items the seller is aware of (foundation, flood, title, zoning, code violations)?
- Is there a deadline driving the sale (1031 exchange, divorce, estate, relocation)? That informs how much negotiation room exists.
- Schools are F-rated, which usually means shorter tenancies and higher turnover. Who's the typical renter profile here, and what's been the actual vacancy rate?
- Crime grade is F in this area — have there been break-ins, vandalism, or insurance claims at this property in the last 3 years? What carrier currently insures it and at what premium?
- What's the average days-on-market for RENTAL listings here right now (not sales)? A rising rental-DOM trend means longer vacancies and softer asking-rent achievability than the comps imply.
- What's the recent tenant-quality profile in this submarket — average credit score on applications, eviction rate, late-payment / NSF rate, and stable-employment percentage? A property-management company in the area should have these aggregated.
- How much new for-sale + rental construction is in the pipeline within 1–3 miles? Heavy new supply typically softens prices + rents 12–24 months out; constrained supply supports both.
Investment metrics
- 1% rule
- 1.20% ✓
- Cap rate
- 10.47%
- Cash-on-cash
- 14.94%
- DSCR
- 1.66
- GRM
- 6.9
CMA / ARV
- ARV (on-the-fly)
- $165,771
- Comps found
- 12
Show comp detail 12 sales within ~0.75 mi
| Address | Dist | Beds/Ba | Sqft | Sold | Price | $/sf | Match |
|---|---|---|---|---|---|---|---|
| 715 Clark St | 0.26mi | 4/1.0 | 1,378 (-6%) | 3mo | $40,000 | $29 | 67 |
| 508 Buena Vista Ave | 0.17mi | 3/2.0 (-1) | 1,375 (-6%) | 10mo | $171,900 | $125 | 64 |
| 621 Clark St | 0.21mi | 3/1.0 (-1) | 1,401 (-4%) | 9mo | $45,000 | $32 | 62 |
| 509 N Mercer St | 0.54mi | 3/2.0 (-1) | 1,439 (-2%) | 3mo | $75,000 | $52 | 60 |
| 421 N Daughtry St | 0.46mi | 3/1.0 (-1) | 1,506 (+3%) | 2mo | $80,000 | $53 | 60 |
| 906 Arlington St | 0.47mi | 4/2.0 | 1,326 (-10%) | 1mo | $180,000 | $136 | 57 |
| 1201 Cypress St | 0.62mi | 4/2.0 | 1,533 (+4%) | 4mo | $179,900 | $117 | 56 |
| 1136 Hill St | 0.63mi | 3/2.0 (-1) | 1,504 (+2%) | 4mo | $185,000 | $123 | 54 |
| 1313 Old Wilson Rd | 0.74mi | 3/2.0 (-1) | 1,440 (-2%) | 2mo | $128,000 | $89 | 52 |
| 1132 Rosewood Ave | 0.59mi | 3/1.0 (-1) | 1,442 (-2%) | 8mo | $162,500 | $113 | 50 |
| 321 Coleman Ave | 0.70mi | 4/1.0 | 1,572 (+7%) | 7mo | $145,000 | $92 | 42 |
| 1100 Long Ave | 0.53mi | 3/2.0 (-1) | 1,670 (+14%) | 9mo | $210,000 | $126 | 36 |
Match score weights: distance 35% · size 25% · config 20% · recency 20%. Top-matched comps best support the ARV.
Projected returns pro-forma
-3.0% appreciation · 3.0% rent growth · sell at horizon
- IRR
- 5.5%
- Equity multiple
- 1.21×
- Total profit
- $7,736
- Equity at exit
- $19,369
- IRR
- 14.9%
- Equity multiple
- 2.20×
- Total profit
- $43,669
- Equity at exit
- $11,231
Cash invested: $36,372 (down + closing). Projections, not guarantees.
Landlord ↔ Tenant lean methodology
- Overall (STATE)
- 85 Strongly Landlord-Friendly
- State North Carolina
- 85 Strongly Landlord-Friendly · R+3
- County
- — inherits STATE
- City
- — inherits STATE
ZIP-level market 27801
- Home prices YoY
- -5.6%
- Active inventory
- 133
- Price-to-rent
- 6.9×
Monthly cashflow live
- Estimated rent
- $1,562 medium interval (Pro) →
- Mortgage (P&I)
- −$681
- Tax from tax record
- −$46 /mo · $555/yr
- Insurance
- −$54
- HOA
- −$0
- Vacancy / Maint / Mgmt
- −$328
- Net cashflow
- $453
Break-even live
UW: 25.0% down · 7.5% · 30yr · 1.5% tax · 5.0% vac · 8.0% maint · 8.0% mgmt
Financing live
Cash to close
- Down payment
- $32,475
- Closing costs
- $3,897
- Reserves months
- —
- Total cash needed
- —
Loan-product check · same deal, 3 products live
Conventional
25% down · 7.5% · 30yr
- Down + closing
- —
- Monthly P&I
- —
- Monthly cashflow
- —
- DSCR
- —
- Eligible?
- —
Personal DTI + credit; lowest rate.
DSCR
20% down · 8.5% · 30yr
- Down + closing
- —
- Monthly P&I
- —
- Monthly cashflow
- —
- DSCR
- —
- Eligible?
- —
No personal income docs; deal must DSCR.
Hard money
10% down · 12.0% · 12mo
- Down + closing
- —
- Monthly P&I
- —
- Monthly cashflow
- —
- DSCR
- —
- Eligible?
- —
Short-term bridge; refi at stabilization.
Listing history 25 events
-
2026-06-19days on market $129,900 Active 112 DOM
-
2026-06-18days on market $129,900 Active 111 DOM
-
2026-06-17days on market $129,900 Active 110 DOM
-
2026-06-16days on market $129,900 Active 109 DOM
-
2026-06-15days on market $129,900 Active 108 DOM
-
2026-06-14days on market $129,900 Active 106 DOM
-
2026-06-13days on market $129,900 Active 105 DOM
-
2026-06-10days on market $129,900 Active 103 DOM
-
2026-06-09days on market $129,900 Active 102 DOM
-
2026-06-08days on market $129,900 Active 101 DOM
-
2026-06-07days on market $129,900 Active 100 DOM
-
2026-06-03days on market $129,900 Active 96 DOM
-
2026-06-02days on market $129,900 Active 95 DOM
-
2026-06-01days on market $129,900 Active 94 DOM
-
2026-05-31days on market $129,900 Active 93 DOM
-
2026-05-30days on market $129,900 Active 92 DOM
-
2026-05-03$975
-
2026-05-01price $124,900 105-char remark
Show marketing remark (105 chars)
Brick home with oak floors. Home has 3 bedrooms and 2 baths. No appliances. Great investment opportunity.
-
2026-02-26$129,900 Active 105-char remark
Show marketing remark (105 chars)
Brick home with oak floors. Home has 3 bedrooms and 2 baths. No appliances. Great investment opportunity.
-
2026-02-26$129,900 Active
Show marketing remark (105 chars)
Brick home with oak floors. Home has 3 bedrooms and 2 baths. No appliances. Great investment opportunity.
-
2026-01-10historical $895
-
2025-12-16$895
-
2024-11-08historical $895
-
2024-09-20$895
-
1999-03-01soldstatus $43,500
ⓘ Source: listings_history table (triggers on properties + properties_extension) + one-shot
backfill from property_details.listing_events for pre-trigger history.
Tax reassessment forecast NC · Resets to sale price
- Current annual tax
- $555 · $46/mo
- Projected year-2 tax
- $1,065 · $89/mo
- Expected delta
- +$510/yr (+$43/mo · 91.9%)
ⓘ Screening estimate from a state-policy table — verify with the county assessor before closing.
Climate risk First Street
- Flood 1/10 Low FEMA zone X (unshaded) · 0% chance over 30 yrs
- Wildfire 3/10 Moderate
- Heat 8/10 Severe 7 d/yr ≥107°F today · 16 d/yr by 30 yrs out
- Wind 6/10 Major 76% chance of damaging wind over 30 yrs
- Air quality 2/10 Low 1 unhealthy d/yr today · 2 by 30 yrs out
Nearby sold comps map
Loading sold comps map…
Walkable amenities ~0.75 mi
Loading nearby amenities…
Taxation est. · year 1
- Rental income
- $18,749
- − Mortgage interest
- −$7,276
- − Property taxes
- −$555
- − Insurance
- −$650
- − Repairs & maintenance
- −$1,500
- − Management
- −$1,500
- − Depreciation
- −$3,779
- Taxable income
- $3,489
- Est. tax owed @ 24.0%
- −$837
- After-tax cash flow
- $4,595/yr
For passive investors: Depreciation is non-cash, so a rental often shows a tax loss while cash-flowing — sheltering income. Rental losses are passive: they offset passive income freely, and up to $25,000/yr can offset ordinary (W-2) income if you actively participate and your MAGI is under $100k (phasing out to $0 by $150k); unused losses carry forward. On sale, claimed depreciation is recaptured at up to 25%, and gains may owe capital-gains tax (a 1031 exchange can defer both). Figures are a year-1 estimate at your 24.0% rate — not tax advice; consult a CPA.
Schools (NCES district)
- District
- Edgecombe County Public Schools
- NCES district ID
- 3701320
- Math proficiency
- 21% ▼ -2.00%
- Reading proficiency
- 27% ▲ 2.00%
- Median HH income
- $35,711
- Composite
- 19.85/100
- National rank
- #8696
- State rank
- #163 of 178 in NC
Livability — Rocky Mount
- Score
- 70/100
- State rank
- #134
- US rank
- #7692
Category grades
Schools grade is shown separately in the Schools card above.
Census & demographics
- Census place
- Rocky Mount, NC
- County
- Edgecombe County · 37,913 people
- City population
- 70,300
- Metro
- Rocky Mount, NC
- Population (ZIP)
- 19,532
- Household income
- $44,884
- Rent vs Own
- Severe rent burden
- 900.0
Population outlook (Edgecombe County) Hauer SSP2
- Today (2025)
- 47,800 people
- By 2030
- 44,396 · -7.1%
- By 2040
- 37,562 · -21.4%
- By 2050
- 31,495 · -34.1%
- By 2075
- 20,943 · -56.2%
- By 2100
- 13,674 · -71.4%
Race, ethnicity, and origin ACS 2023
- Neighborhood character
- Predominantly Black (70%)
- Race & ethnicity
- Black 70% White 24% Two or more races 3% Hispanic / Latino 1%
- Common ancestry
- Romanian 1%
- Foreign-born
- 1% · Canada
- Languages at home
- 97% English-only · Spanish 2%
Political lean MEDSL · Edgecombe
- 2024 margin
- Strong D (+22.7) · D 61.0% · R 38.3%
- 2008→2024 swing
- -11.8pp toward R · 2008: 34.5pp · 2024: 22.7pp
- All cycles
- 2024: D+22.7 2020: D+27.0 2016: D+32.2 2012: D+36.4 2008: D+34.5
Not yet ingested
- Civics
- —
Market trends
- HPI YoY
- ▼ -17.65%
- Current HPI
- 296.3428
- Rent YoY
- —
- Metro
- Rocky Mount, NC
- State GDP YoY
- ▲ 3.28%
- F500 in state
- 26
Industry mix (Fortune 500 HQ in NC)
| Industry | F500 HQs | Revenue |
|---|---|---|
| Financial Services | 2 | $213B |
|
||
| Retail | 2 | $95B |
|
||
| Industrial Conglomerate | 1 | $38B |
|
||
| Metals / Steel | 1 | $35B |
|
||
| Utilities | 1 | $30B |
|
||
| Industrial Machinery | 1 | $19B |
|
||
Price history
+187.1% since first listed9 events — show timeline
- 2026-05-03 Listed for Rent $975 APPFOLIO
- 2026-05-01 Price Changed $124,900 Hive MLS
- 2026-02-26 Listed $129,900 TMLS
- 2026-02-26 Listed $129,900 Hive MLS
- 2026-01-10 Rental Removed $895 APPFOLIO
- 2025-12-16 Listed for Rent $895 APPFOLIO
- 2024-11-08 Rental Removed $895 APPFOLIO
- 2024-09-20 Listed for Rent $895 APPFOLIO
- 1999-03-01 Sold (Public Records) $43,500 Public Records
Property tax history
+5.1%/yrLatest (2025): $555 · +0.0% YoY. Source: county tax records.
Cash-flow waterfall
monthlySold comps — $/sqft
last 12 mo · ≤1 miLoading sold comps…