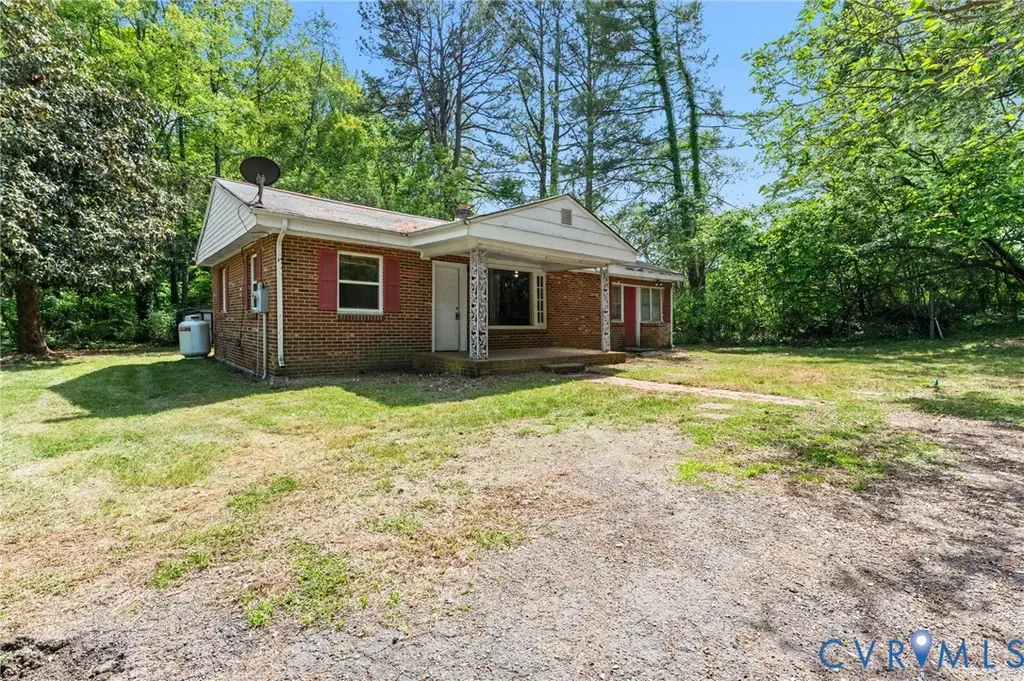
51 Anderson Dr · Dillwyn, VA
Flood risk 1/10 · Minimal
- FEMA flood zone
- X (unshaded)
- Chance of flooding over 30 yrs
- 0.0%
- Est. flood insurance / yr
- $507 – $1,088
Fire risk 4/10 · Minor
- Est. fire insurance / yr
- $666 – $1,236
Heat risk 5/10 · Moderate
- Hot days now (above 104°F)
- 7 days/yr
- Hot days in 30 yrs
- 17 days/yr
Wind risk 3/10 · Minor
- Chance of severe wind over 30 yrs
- 6.0%
Air-quality risk 2/10 · Minimal
- Unhealthy air days now
- 0 days/yr
- Unhealthy air days in 30 yrs
- 1 days/yr
Risk factors via First Street. Map © Google.
Why this score? — see what drove the B+ grade
The composite is a weighted blend of 9 inputs, each scored 0–100. Each bar is that input's sub-score; the figure is the points it added to the 100-point composite (weight × sub-score).
- Cash flow +30.0/30.0
- 1% rule +10.0/10.0
- DSCR +10.0/10.0
- Appreciation +10.0/10.0
- ARV discount +7.5/15.0
- Schools +3.6/10.0
- Livability +3.0/5.0
- Rent growth +2.5/5.0
- Condition / age +2.5/5.0
$79,900
🖨 Deal sheet (PDF) 📄 Offer letter ✓ Due diligence
Listing remarks
* * SELLER FINANCING AVAILABLE * * WHAT A DEAL!! Welcome to this charming handyman special. Offering 966 square feet with 3 spacious bedrooms, 1 full bathroom, large storage sheds, and a large open yard. This property is being sold as-is, presenting a unique opportunity for customization. Although this is not an REO property, it does need repairs, and some TLC. This is a perfect opportunity to remodel to your taste and make it the perfect home for you to move into. For investors, this home will make a great investment property and should cash flow very well while building wealth or rehab for a quick profit. List price is based on needed repairs. Similar updated houses in the area sell f
Key facts
- 9,583 sq ft lot
- Built 1960
- Listed 8 days
Property features AI
Exterior
- Utilities: Public water; Public sewer
- Home design: Single-story home
- Construction: Brick and frame construction; Shingle roof; Built (actual year not specified)
- Exterior features: 0.22-acre lot
Interior
- Kitchen: No kitchen appliance details provided
- Bedrooms: 5 total rooms (includes bedrooms and living spaces)
- Bathrooms: 1 full bathroom with tub and shower
- Heating & cooling: Propane heating; Window unit cooling
- Interior features: Resale condition
- Laundry & utility: Electric water heater
Neighborhood map
What this means for you Summary
Snapshot
- This is a 3-bed/1.0-bath single-family listed at $80k.
Deal economics
- At list price, monthly cash flow is $968 ($12k/yr) — positive.
- The deal already cash-flows at list — no discount required.
- Meets the 1% rule at list price ($2k rent vs $80k).
- Cap rate 20.8% vs local median 4.7% in Dillwyn — top-decile yield for the area; either an underpriced asset or a hidden risk that comps aren't pricing in. Stress-test before assuming the spread holds.
Location & tenants
- Location reads 60/100 on livability (#435 in VA) — a middle-class / working-renter tenant base. Strengths: cost of living A+, housing A+; Watch: employment D, amenities F, commute F.
- Buckingham County Public School District (rural): math 36% / reading 49% proficiency, ranked #117 of 131 in VA (top 89%) — families likely to look elsewhere, expect single-tenant / working-renter base with shorter leases; 60% free/reduced lunch — lower-income household profile, screen leases tightly.
- Zoned schools: Buckingham Co Elementary (math 32% / reading 44%, grade F, #928 of 1,108 statewide, top 84%, 417 students, 92% FRL); Buckingham County Middle (math 31% / reading 50%, grade F, #303 of 342 statewide, top 89%, 466 students, 92% FRL); Buckingham County High (math 57% / reading 62%, grade C+, #247 of 319 statewide, top 80%, 654 students, 92% FRL) — zoned schools average 92% FRL vs 60% district-wide (32 pts higher); higher-poverty schools than district average — tighter screening recommended.
- Market conditions: 63 active listings in the ZIP; 96 units permitted in Buckingham County in 2024 (0 in 5+ unit buildings).
Forward outlook
- In year one you build about $9k of equity ($552 loan paydown + $8k appreciation (10.0% local appreciation)).
- Buckingham County population projected to shrink 8% by 2050 — rents likely to lag national; underwrite the cash flow, not the appreciation.
- At projected returns (10.0% appreciation + 3.0% rent growth), your $22k cash investment doubles in ~2 years — after that, you're playing with house money.
- By year 4, paydown + projected appreciation supports a ~$30k cash-out refi (75% LTV) — recoverable capital for the next deal without selling this one.
Negotiation context
- Only 8 days on market — expect competitive offers; lowballing is unlikely to land.
Risks & watch-outs
- Climate carrying-cost: extreme-heat days projected 7→17/yr by 2055 (HVAC capex compounding) — expect insurance premiums to compound above CPI over the hold.
Questions for the listing agent
- Built in 1960 — when were the roof, HVAC, electrical panel, plumbing, and water heater last replaced?
- Is there a deadline driving the sale (1031 exchange, divorce, estate, relocation)? That informs how much negotiation room exists.
- Schools are D-rated, which usually means shorter tenancies and higher turnover. Who's the typical renter profile here, and what's been the actual vacancy rate?
- What's the average days-on-market for RENTAL listings here right now (not sales)? A rising rental-DOM trend means longer vacancies and softer asking-rent achievability than the comps imply.
- What's the recent tenant-quality profile in this submarket — average credit score on applications, eviction rate, late-payment / NSF rate, and stable-employment percentage? A property-management company in the area should have these aggregated.
- How much new for-sale + rental construction is in the pipeline within 1–3 miles? Heavy new supply typically softens prices + rents 12–24 months out; constrained supply supports both.
Investment metrics
- 1% rule
- 2.31% ✓
- Cap rate
- 20.83%
- Cash-on-cash
- 51.91%
- DSCR
- 3.31
- GRM
- 3.6
CMA / ARV
- ARV (median comp)
- $175,655
- List price
- $79,900
- Delta
- -54.51%
- Verdict
- UNDERPRICED
- Comps
- 12 within 1.0 mi
Show comp detail 4 sales within ~0.75 mi
| Address | Dist | Beds/Ba | Sqft | Sold | Price | $/sf | Match |
|---|---|---|---|---|---|---|---|
| 51 Anderson Dr | 0.00mi | 3/1.0 | 966 (0%) | 1mo | $79,900 | $83 | 99 |
| 845 Main St | 0.35mi | 2/1.0 (-1) | 1,102 (+14%) | 12mo | $215,000 | $195 | 45 |
| 89 Conner St | 0.50mi | 2/1.0 (-1) | 1,105 (+14%) | 8mo | $170,000 | $154 | 41 |
| 17031 Oak St | 0.46mi | 2/1.0 (-1) | 840 (-13%) | 17mo | $119,900 | $143 | 38 |
Match score weights: distance 35% · size 25% · config 20% · recency 20%. Top-matched comps best support the ARV.
Projected returns pro-forma
10.0% appreciation · 3.0% rent growth · sell at horizon
- IRR
- 65.2%
- Equity multiple
- 5.70×
- Total profit
- $105,150
- Equity at exit
- $71,980
- IRR
- 58.8%
- Equity multiple
- 12.67×
- Total profit
- $261,157
- Equity at exit
- $155,228
Cash invested: $22,372 (down + closing). Projections, not guarantees.
Landlord ↔ Tenant lean methodology
- Overall (STATE)
- 55 Moderately Landlord-Leaning
- State Virginia
- 55 Moderately Landlord-Leaning · D+2
- County
- — inherits STATE
- City
- — inherits STATE
ZIP-level market 23936
- Home prices YoY
- 21.8%
- Active inventory
- 63
- Price-to-rent
- 3.6×
Monthly cashflow live
- Estimated rent
- $1,849 medium interval (Pro) →
- Mortgage (P&I)
- −$419
- Tax from tax record
- −$40 /mo · $485/yr
- Insurance
- −$33
- HOA
- −$0
- Vacancy / Maint / Mgmt
- −$388
- Net cashflow
- $968
Break-even live
Sensitivity live
| Price | -10% $1,013 | -5% $990 | +0% $968 | +5% $945 | +10% $923 |
|---|---|---|---|---|---|
| Rent | -10% $822 | -5% $895 | +0% $968 | +5% $1,041 | +10% $1,114 |
| Rate | -1.0pp $1,008 | -0.5pp $988 | base $968 | +0.5pp $947 | +1.0pp $926 |
UW: 25.0% down · 7.5% · 30yr · 1.5% tax · 5.0% vac · 8.0% maint · 8.0% mgmt
Financing live
Cash to close
- Down payment
- $19,975
- Closing costs
- $2,397
- Reserves months
- —
- Total cash needed
- —
Loan-product check · same deal, 3 products live
Conventional
25% down · 7.5% · 30yr
- Down + closing
- —
- Monthly P&I
- —
- Monthly cashflow
- —
- DSCR
- —
- Eligible?
- —
Personal DTI + credit; lowest rate.
DSCR
20% down · 8.5% · 30yr
- Down + closing
- —
- Monthly P&I
- —
- Monthly cashflow
- —
- DSCR
- —
- Eligible?
- —
No personal income docs; deal must DSCR.
Hard money
10% down · 12.0% · 12mo
- Down + closing
- —
- Monthly P&I
- —
- Monthly cashflow
- —
- DSCR
- —
- Eligible?
- —
Short-term bridge; refi at stabilization.
Listing history 2 events
-
2026-05-15status Pending 841-char remark
-
2026-05-07$79,900 Active 841-char remark
ⓘ Source: listings_history table (triggers on properties + properties_extension) + one-shot
backfill from property_details.listing_events for pre-trigger history.
Tax reassessment forecast VA · Resets to sale price
- Current annual tax
- $485 · $40/mo
- Projected year-2 tax
- $655 · $55/mo
- Expected delta
- +$170/yr (+$14/mo · 35.0%)
ⓘ Screening estimate from a state-policy table — verify with the county assessor before closing.
Climate risk First Street
- Flood 1/10 Low FEMA zone X (unshaded) · 0% chance over 30 yrs
- Wildfire 4/10 Moderate
- Heat 5/10 Major 7 d/yr ≥104°F today · 17 d/yr by 30 yrs out
- Wind 3/10 Moderate 6% chance of damaging wind over 30 yrs
- Air quality 2/10 Low 0 unhealthy d/yr today · 1 by 30 yrs out
Nearby sold comps map
Loading sold comps map…
Walkable amenities ~0.75 mi
Loading nearby amenities…
Taxation est. · year 1
- Rental income
- $22,186
- − Mortgage interest
- −$4,476
- − Property taxes
- −$485
- − Insurance
- −$400
- − Repairs & maintenance
- −$1,775
- − Management
- −$1,775
- − Depreciation
- −$2,324
- Taxable income
- $10,952
- Est. tax owed @ 24.0%
- −$2,628
- After-tax cash flow
- $8,986/yr
For passive investors: Depreciation is non-cash, so a rental often shows a tax loss while cash-flowing — sheltering income. Rental losses are passive: they offset passive income freely, and up to $25,000/yr can offset ordinary (W-2) income if you actively participate and your MAGI is under $100k (phasing out to $0 by $150k); unused losses carry forward. On sale, claimed depreciation is recaptured at up to 25%, and gains may owe capital-gains tax (a 1031 exchange can defer both). Figures are a year-1 estimate at your 24.0% rate — not tax advice; consult a CPA.
Schools (NCES district)
- District
- Buckingham County Public School District
- NCES district ID
- 5100540
- Math proficiency
- 36% ▼ -38.00%
- Reading proficiency
- 49% ▼ -12.00%
- Median HH income
- $40,158
- Composite
- 35.58/100
- National rank
- #4897
- State rank
- #117 of 131 in VA
Livability — Dillwyn
- Score
- 60/100
- State rank
- #435
- US rank
- #18682
Category grades
Schools grade is shown separately in the Schools card above.
Census & demographics
- Census place
- Dillwyn, VA
- Population (ZIP)
- 6,992
Population outlook (Buckingham County) Hauer SSP2
- Today (2025)
- 16,866 people
- By 2030
- 16,625 · -1.4%
- By 2040
- 16,108 · -4.5%
- By 2050
- 15,588 · -7.6%
- By 2075
- 14,125 · -16.3%
- By 2100
- 11,701 · -30.6%
Race, ethnicity, and origin ACS 2023
- Neighborhood character
- Diverse neighborhood (Simpson 0.56)
- Race & ethnicity
- White 53% Black 40% Two or more races 5% Hispanic / Latino 1%
- Common ancestry
- Lithuanian 1% Slovak 1% Scotch-Irish 1%
- Foreign-born
- 2% · Canada
- Languages at home
- 96% English-only · German/W. Germanic 2% Spanish 1%
Political lean MEDSL · Buckingham
- 2024 margin
- Strong R (+23.5) · D 37.8% · R 61.2% · Other 1.0%
- 2008→2024 swing
- -24.4pp toward R · 2008: 0.9pp · 2024: -23.5pp
- All cycles
- 2024: R+23.5 2020: R+13.2 2016: R+11.6 2012: D+2.4 2008: D+0.9
Not yet ingested
- Civics
- —
Market trends
- HPI YoY
- ▲ 39.71%
- Current HPI
- 221.8804
- Rent YoY
- —
- Metro
- —
- State GDP YoY
- ▲ 2.40%
- F500 in state
- 50
Industry mix (Fortune 500 HQ in VA)
| Industry | F500 HQs | Revenue |
|---|---|---|
| Aerospace / Defense | 4 | $236B |
|
||
| Technology / Defense | 3 | $32B |
|
||
| Financial Services | 2 | $176B |
|
||
| Utilities | 2 | $27B |
|
||
| Insurance | 2 | $25B |
|
||
| Technology | 2 | $15B |
|
||
Price history
+0.0% since first listed3 events — show timeline
- 2026-06-02 Sold (MLS) $79,900 CVRMLS
- 2026-05-15 Pending — CVRMLS
- 2026-05-07 Listed $79,900 CVRMLS
Property tax history
+5.2%/yrLatest (2026): $485 · +11.9% YoY. Source: county tax records.
Cash-flow waterfall
monthlySold comps — $/sqft
last 12 mo · ≤1 miLoading sold comps…