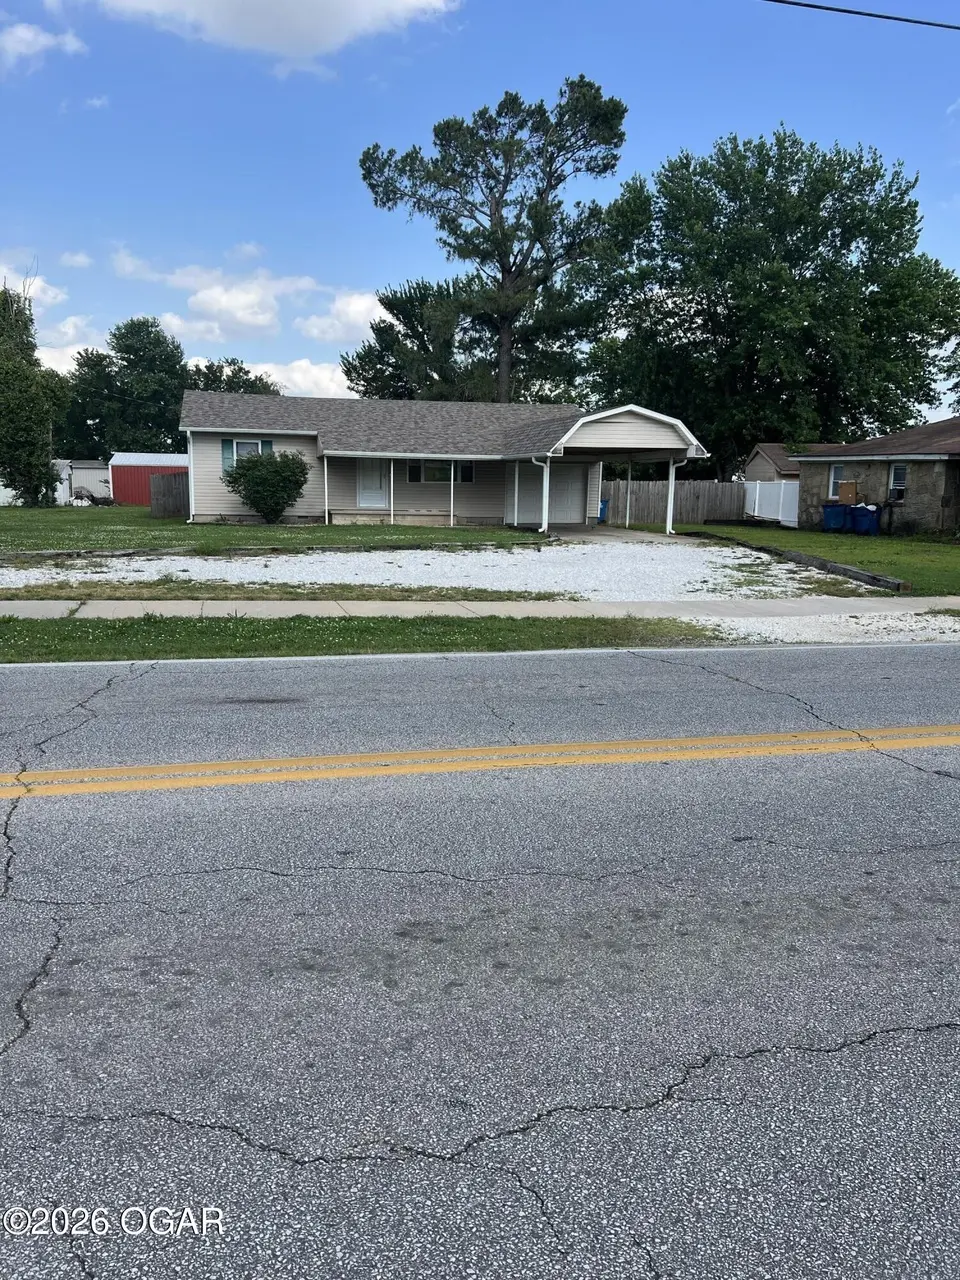
103 N Roney St · Carl Junction, MO
Flood risk 1/10 · Minimal
- FEMA flood zone
- X (unshaded)
- Chance of flooding over 30 yrs
- 0.0%
- Est. flood insurance / yr
- $507 – $1,088
Fire risk 4/10 · Minor
- Est. fire insurance / yr
- $1,054 – $1,958
Heat risk 5/10 · Moderate
- Hot days now (above 107°F)
- 7 days/yr
- Hot days in 30 yrs
- 20 days/yr
Wind risk 2/10 · Minimal
- Chance of severe wind over 30 yrs
- 2.0%
Air-quality risk 2/10 · Minimal
- Unhealthy air days now
- 1 days/yr
- Unhealthy air days in 30 yrs
- 1 days/yr
Risk factors via First Street. Map © Google.
Why this score? — see what drove the B- grade
The composite is a weighted blend of 9 inputs, each scored 0–100. Each bar is that input's sub-score; the figure is the points it added to the 100-point composite (weight × sub-score).
- Cash flow +29.3/30.0
- DSCR +10.0/10.0
- ARV discount +7.5/15.0
- 1% rule +7.3/10.0
- Schools +4.1/10.0
- Livability +3.4/5.0
- Rent growth +2.5/5.0
- Condition / age +2.5/5.0
- Appreciation +0.0/10.0
$110,000
🖨 Deal sheet 📄 Offer letter ✓ Due diligence
Listing remarks
Great starter home, clean and tidy, conveniently located in Carl Junction, near Main St. businesses and adjacent to schools. 2 Bed 1 Bath. Refrigerator, electric stove, washer and dryer included. 1 Car attached garage with a carport, plus extra parking area. New roof July 2025. Large fenced yard. In-ground Storm Shelter.
Key facts
- Adjacent to schools
- Large fenced yard
- Conveniently located
Tags
Property features AI
Exterior
- Parking: Attached 1-car garage; Attached 1-car carport
- Utilities: Public sewer
- Home design: Single-family residence, freestanding; Residential property
- Construction: Vinyl siding; Block foundation; Built with shingle roof
- Exterior features: Covered porch; Privacy wood fencing; Shingle roof; Level topography
Interior
- Kitchen: Electric range; Refrigerator
- Bedrooms: Total of 5 rooms (includes living/bedroom spaces)
- Flooring: Vinyl
- Bathrooms: 1 full bathroom
- Heating & cooling: Electric central heating; Cooling present
- Interior features: Electric range, refrigerator, washer, dryer; Vinyl flooring; No fireplace; Crawl space basement
- Laundry & utility: Washer and dryer included
Neighborhood map
What this means for you Summary
Snapshot
- This is a 3-bed/1.0-bath other listed at $110k.
Deal economics
- At list price, monthly cash flow is $386 ($5k/yr) — positive.
- The deal already cash-flows at list — no discount required.
- Meets the 1% rule at list price ($1k rent vs $110k).
- Cap rate 10.5% vs local median 3.2% in Carl Junction — top-decile yield for the area; either an underpriced asset or a hidden risk that comps aren't pricing in. Stress-test before assuming the spread holds.
Location & tenants
- Location reads 68/100 on livability (#169 in MO) — a middle-class / working-renter tenant base. Strengths: cost of living A+, housing A+, crime B+; Watch: amenities F, commute F, health & safety D-.
- Carl Junction R-I (suburban): math 42% / reading 53% proficiency, ranked #57 of 324 in MO (top 18%) — families likely to look elsewhere, expect single-tenant / working-renter base with shorter leases.
- Zoned schools: Carl Junction Primary K-1 (670 students, 37% FRL); Carl Junction Jr. High (math 43% / reading 50%, grade D+, #99 of 391 statewide, top 26%, 501 students, 42% FRL).
- Market conditions: 129 active listings in the ZIP; 1 comparable units currently listed for rent nearby; 602 units permitted in Jasper County in 2024 (0 in 5+ unit buildings).
Forward outlook
- Local home prices are declining (-3.0%/yr); year-one equity from $761 of loan paydown is wiped out by about $3k of value loss. Plan a longer hold.
- At projected returns (-3.0% appreciation + 3.0% rent growth), your $31k cash investment doubles in ~8 years — after that, you're playing with house money.
Negotiation context
- Only 1 days on market — expect competitive offers; lowballing is unlikely to land.
Risks & watch-outs
- Climate carrying-cost: extreme-heat days projected 7→20/yr by 2055 (HVAC capex compounding) — expect insurance premiums to compound above CPI over the hold.
Questions for the listing agent
- Built in 1975 — when were the roof, HVAC, electrical panel, plumbing, and water heater last replaced?
- Is there a deadline driving the sale (1031 exchange, divorce, estate, relocation)? That informs how much negotiation room exists.
- What's the average days-on-market for RENTAL listings here right now (not sales)? A rising rental-DOM trend means longer vacancies and softer asking-rent achievability than the comps imply.
- What's the recent tenant-quality profile in this submarket — average credit score on applications, eviction rate, late-payment / NSF rate, and stable-employment percentage? A property-management company in the area should have these aggregated.
- How much new for-sale + rental construction is in the pipeline within 1–3 miles? Heavy new supply typically softens prices + rents 12–24 months out; constrained supply supports both.
Investment metrics
- 1% rule
- 1.23% ✓
- Cap rate
- 10.51%
- Cash-on-cash
- 15.05%
- DSCR
- 1.67
- GRM
- 6.8
CMA / ARV
No comps found within radius.
Projected returns pro-forma
-3.0% appreciation · 3.0% rent growth · sell at horizon
- IRR
- 5.6%
- Equity multiple
- 1.22×
- Total profit
- $6,744
- Equity at exit
- $16,401
- IRR
- 15.0%
- Equity multiple
- 2.22×
- Total profit
- $37,430
- Equity at exit
- $9,511
Cash invested: $30,800 (down + closing). Projections, not guarantees.
Landlord ↔ Tenant lean methodology
- Overall (STATE)
- 81 Strongly Landlord-Friendly
- State Missouri
- 81 Strongly Landlord-Friendly · R+10
- County
- — inherits STATE
- City
- — inherits STATE
ZIP-level market 64834
- Home prices YoY
- -13.2%
- Active inventory
- 129
- Price-to-rent
- 6.8×
Monthly cashflow live
- Estimated rent
- $1,350 medium interval (Pro) →
- Mortgage (P&I)
- −$577
- Tax from tax record
- −$58 /mo · $691/yr
- Insurance
- −$46
- HOA
- −$0
- Vacancy / Maint / Mgmt
- −$284
- Net cashflow
- $386
Break-even live
UW: 25.0% down · 7.5% · 30yr · 1.5% tax · 5.0% vac · 8.0% maint · 8.0% mgmt
Financing live
Cash to close
- Down payment
- $27,500
- Closing costs
- $3,300
- Reserves months
- —
- Total cash needed
- —
Loan-product check · same deal, 3 products live
Conventional
25% down · 7.5% · 30yr
- Down + closing
- —
- Monthly P&I
- —
- Monthly cashflow
- —
- DSCR
- —
- Eligible?
- —
Personal DTI + credit; lowest rate.
DSCR
20% down · 8.5% · 30yr
- Down + closing
- —
- Monthly P&I
- —
- Monthly cashflow
- —
- DSCR
- —
- Eligible?
- —
No personal income docs; deal must DSCR.
Hard money
10% down · 12.0% · 12mo
- Down + closing
- —
- Monthly P&I
- —
- Monthly cashflow
- —
- DSCR
- —
- Eligible?
- —
Short-term bridge; refi at stabilization.
Rent comps 1 comps
| Address | Beds | Baths | Sqft | Rent | $/sqft | DOM | Units | Dist |
|---|---|---|---|---|---|---|---|---|
| 623 Valley View St Carl Junction, MO | 3.0 | 2.0 | 1008 | $1,350 | $1.34 | 21d | 1 | 0.66mi |
Listing history 3 events
-
2026-06-07status $110,000 Pending 1 DOM
-
2026-06-03remarks 322-char remark
-
2026-06-03$110,000 Active 1 DOM
ⓘ Source: listings_history table (triggers on properties + properties_extension) + one-shot
backfill from property_details.listing_events for pre-trigger history.
Tax reassessment forecast MO · Resets to sale price
- Current annual tax
- $691 · $58/mo
- Projected year-2 tax
- $1,067 · $89/mo
- Expected delta
- +$376/yr (+$31/mo · 54.4%)
ⓘ Screening estimate from a state-policy table — verify with the county assessor before closing.
Climate risk First Street
- Flood 1/10 Low FEMA zone X (unshaded) · 0% chance over 30 yrs
- Wildfire 4/10 Moderate
- Heat 5/10 Major 7 d/yr ≥107°F today · 20 d/yr by 30 yrs out
- Wind 2/10 Low 2% chance of damaging wind over 30 yrs
- Air quality 2/10 Low 1 unhealthy d/yr today · 1 by 30 yrs out
Nearby sold comps map
Loading sold comps map…
Walkable amenities ~0.75 mi
Loading nearby amenities…
Taxation est. · year 1
- Rental income
- $16,200
- − Mortgage interest
- −$6,162
- − Property taxes
- −$691
- − Insurance
- −$550
- − Repairs & maintenance
- −$1,296
- − Management
- −$1,296
- − Depreciation
- −$3,200
- Taxable income
- $3,005
- Est. tax owed @ 24.0%
- −$721
- After-tax cash flow
- $3,913/yr
For passive investors: Depreciation is non-cash, so a rental often shows a tax loss while cash-flowing — sheltering income. Rental losses are passive: they offset passive income freely, and up to $25,000/yr can offset ordinary (W-2) income if you actively participate and your MAGI is under $100k (phasing out to $0 by $150k); unused losses carry forward. On sale, claimed depreciation is recaptured at up to 25%, and gains may owe capital-gains tax (a 1031 exchange can defer both). Figures are a year-1 estimate at your 24.0% rate — not tax advice; consult a CPA.
Schools (NCES district)
- District
- Carl Junction R-I
- NCES district ID
- 2907350
- Math proficiency
- 42% ▲ 1.00%
- Reading proficiency
- 53% ▬ 0.00%
- Median HH income
- $53,866
- Composite
- 41.04/100
- National rank
- #3580
- State rank
- #57 of 324 in MO
Livability — Carl Junction
- Score
- 68/100
- State rank
- #169
- US rank
- #9146
Category grades
Schools grade is shown separately in the Schools card above.
Census & demographics
- Census place
- Carl Junction, MO
- City population
- 10,476
- Population (ZIP)
- 10,476
Population outlook (Jasper County) Hauer SSP2
- Today (2025)
- 120,033 people
- By 2030
- 120,091 · +0.0%
- By 2040
- 119,297 · -0.6%
- By 2050
- 117,705 · -1.9%
- By 2075
- 110,402 · -8.0%
- By 2100
- 99,719 · -16.9%
Race, ethnicity, and origin ACS 2023
- Neighborhood character
- Predominantly White (90%)
- Race & ethnicity
- White 90% Two or more races 5% Hispanic / Latino 3%
- Common ancestry
- Lithuanian 4% Italian 4% Slovak 3%
- Foreign-born
- 2% · Canada, South Korea
- Languages at home
- 96% English-only · Spanish 3% French/Haitian/Cajun 1%
Political lean MEDSL · Jasper
- 2024 margin
- Solid R (+46.8) · D 25.9% · R 72.7% · Other 1.4%
- 2008→2024 swing
- -13.6pp toward R · 2008: -33.2pp · 2024: -46.8pp
- All cycles
- 2024: R+46.8 2020: R+46.2 2016: R+50.8 2012: R+41.0 2008: R+33.2
Not yet ingested
- Civics
- —
Market trends
- HPI YoY
- ▼ -38.68%
- Current HPI
- 255.1864
- Rent YoY
- —
- Metro
- —
- State GDP YoY
- ▲ 1.84%
- F500 in state
- 20
Industry mix (Fortune 500 HQ in MO)
| Industry | F500 HQs | Revenue |
|---|---|---|
| Healthcare | 1 | $163B |
|
||
| Insurance | 1 | $21B |
|
||
| Industrial Technology | 1 | $17B |
|
||
| Retail | 1 | $16B |
|
||
| Industrial Distribution | 1 | $10B |
|
||
| Utilities | 1 | $9B |
|
||
Price history
3 events — show timeline
- 2026-06-03 Listed $110,000 OGAR
- 2007-12-03 Sold (Public Records) — Public Records
- 2002-02-15 Sold (Public Records) — Public Records
Property tax history
+3.4%/yrLatest (2025): $691 · +12.1% YoY. Source: county tax records.
Cash-flow waterfall
monthlySold comps — $/sqft
last 12 mo · ≤1 miLoading sold comps…