7888 Lexington Club Blvd Unit B · Delray Beach, FL
Flood risk 1/10 · Minimal
- FEMA flood zone
- X (unshaded)
- Chance of flooding over 30 yrs
- 0.0%
- Est. flood insurance / yr
- $507 – $1,088
Fire risk 4/10 · Minor
- Est. fire insurance / yr
- $947 – $1,759
Heat risk 9/10 · Severe
- Hot days now (above 107°F)
- 6 days/yr
- Hot days in 30 yrs
- 22 days/yr
Wind risk 10/10 · Severe
- Chance of severe wind over 30 yrs
- 99.0%
Air-quality risk 2/10 · Minimal
- Unhealthy air days now
- 0 days/yr
- Unhealthy air days in 30 yrs
- 2 days/yr
Risk factors via First Street. Map © Google.
Why this score? — see what drove the D grade
The composite is a weighted blend of 9 inputs, each scored 0–100. Each bar is that input's sub-score; the figure is the points it added to the 100-point composite (weight × sub-score).
- ARV discount +7.5/15.0
- Cash flow +7.3/30.0
- 1% rule +6.5/10.0
- Appreciation +5.3/10.0
- Schools +4.3/10.0
- Livability +3.9/5.0
- Rent growth +2.6/5.0
- Condition / age +2.5/5.0
- DSCR +1.4/10.0
$269,500
🖨 Deal sheet (PDF) 📄 Offer letter ✓ Due diligence
Listing remarks
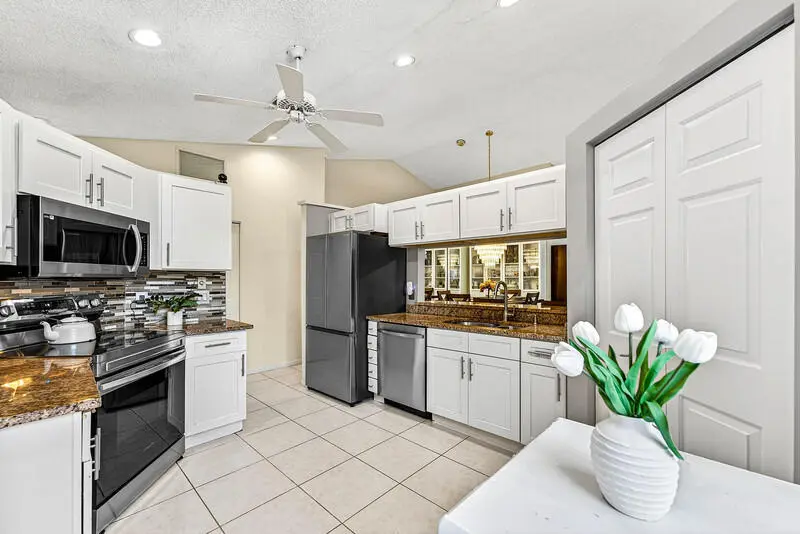
Welcome home to your beautiful new villa in Lexington Club of Delray Beach. This light & bright single story villa features two full bedrooms & bathrooms, an updated kitchen w/ white shaker cabinets, granite countertops, & stainless steel appliances, updated bathrooms, tile & vinyl flooring throughout, accordion hurricane protection, & a glass enclosed patio area w/ access from both the living room & primary bedroom. Lots of storage & closet space throughout, full size washer & dryer, & a lovely garden view from the patio. Lexington Club is a premier 55+ gated community w/ a beautiful clubhouse w/ community room, pool, hot tub, pickle ball,
Key facts
- Gated community
- Fitness center
- Glass enclosed patio
Tags
Property features AI
Finance
- Other: Pets allowed (possible limits/restrictions)
- HOA & community: Lexington Club community; Monthly HOA fee of $959; HOA covers cable TV, grounds maintenance, security, sewer, hot water, common areas, and recreation facilities; Community amenities include clubhouse, fitness center, game room, pool, sauna, spa/hot tub, tennis courts, pickleball courts, shuffleboard, community room, manager on site, parking, and street lights; Senior community
Exterior
- Parking: Attached garage (1 covered space); Driveway and guest/open parking available; Total 1 parking space
- Security: Security system (owned); Closed-circuit cameras; Key card entry; Smoke detectors; Security patrol; Gated community (no guard)
- Utilities: Public water; Public sewer; Cable available
- Home design: Villa (single-story / one and one-half levels); Faces north; Resale condition
- Construction: Built with stucco and CBS; Concrete/tile roof
- Exterior features: Glass-enclosed patio/porch; Not waterfront
Interior
- Kitchen: Dishwasher; Disposal; Electric range; Gas range; Microwave; Refrigerator; Electric water heater
- Bedrooms: 2 bedrooms on the main level
- Flooring: Ceramic tile; Tile; Wood
- Bathrooms: 2 full bathrooms (both on the main level)
- Heating & cooling: Central heating (electric); Central air conditioning; Ceiling fans
- Interior features: Cathedral and vaulted ceilings with high ceilings; Walk-in closets; Split bedroom layout; Closet cabinetry; Blinds on windows
- Laundry & utility: Laundry area on main level with laundry tub; Laundry hook-ups located in garage
Neighborhood map
What this means for you Summary
Snapshot
- This is a 2-bed/2.0-bath single-family listed at $270k.
Deal economics
- At list price, monthly cash flow is $-361 ($-4k/yr) — negative.
- To cash-flow at today's rent, offer at most $206k (23.6% below list).
- Meets the 1% rule at list price ($3k rent vs $270k).
- Recommended offer: $206k (23.6% below list) — sets the bar for cash-flow.
Location & tenants
- Location reads 77/100 on livability (#202 in FL, #3,160 nationally) — a middle-class / working-renter tenant base. Strengths: housing A+, health & safety A+, commute A-; Watch: cost of living C-, crime D-, amenities F.
- Palm Beach (suburban): math 46% / reading 53% proficiency, ranked #34 of 73 in FL (top 47%) — families likely to look elsewhere, expect single-tenant / working-renter base with shorter leases.
- Zoned schools: Orchard View Elementary School (math 48% / reading 47%, grade D, #1,182 of 2,144 statewide, top 55%, 596 students, 76% FRL); Carver Middle School (math 22% / reading 34%, grade F, #486 of 571 statewide, top 86%, 732 students, 73% FRL); Spanish River Community High School (math 64% / reading 74%, grade B, #63 of 667 statewide, top 10%, 2,578 students, 25% FRL).
- Market conditions: Rents flat; 586 active listings in the ZIP; 40 comparable units currently listed for rent nearby; rentals at typical pace (median 20d on market — plan ~3-4 weeks tenant-placement turnaround); solid renter incomes; 3,974 units permitted in Palm Beach County in 2024 (1,012 in 5+ unit buildings).
- At $3,100/mo this rent would consume 46% of the median local household income ($80k/yr) (locally 494% of renters already pay >50% of income on rent) — very limited rent-growth headroom before tenants either downsize or default.
Forward outlook
- In year one you build about $4k of equity ($2k loan paydown + $2k appreciation (0.7% local appreciation)).
- Palm Beach County population projected at +30% by 2050 — long-run rental-demand tailwind backs the buy-and-hold thesis.
- By year 8, paydown + projected appreciation supports a ~$31k cash-out refi (75% LTV) — recoverable capital for the next deal without selling this one.
Negotiation context
- It's been on market 79 days — a 6% lower offer ($253k) is reasonable based on typical stale-listing flexibility.
- 6 sale attempts since 20y ago with the ask held roughly flat each time — persistent listings suggest the price (not the market) is what's stuck; bring a comps-based counter.
Risks & watch-outs
- Watch-outs: HOA is 31% of rent.
- Climate carrying-cost: severe wind risk, 99% chance of damaging wind over 30y; extreme-heat days projected 6→22/yr by 2055 (HVAC capex compounding) — expect insurance premiums to compound above CPI over the hold.
Questions for the listing agent
- What do current leases actually rent for vs. the listed asking? Can we see a recent rent roll and the last 12 months of T-12 income?
- It's been on market 79 days. Have you received any prior offers? Is the seller open to a 24% concession, seller financing, or rate buy-down credit?
- What does the HOA fee cover, when was the last increase, and are there any pending special assessments or reserve-fund shortfalls?
- Why hasn't it sold? Are there any deal-killer items the seller is aware of (foundation, flood, title, zoning, code violations)?
- Is there a deadline driving the sale (1031 exchange, divorce, estate, relocation)? That informs how much negotiation room exists.
- Schools are B-rated — typically a magnet for longer-tenancy family renters. What's the average tenant stay here, and is there a school-zone premium baked into asking?
- Crime grade is D in this area — have there been break-ins, vandalism, or insurance claims at this property in the last 3 years? What carrier currently insures it and at what premium?
- The area grade is low — what's the realistic commute time and amenity access for the typical tenant pool here? Any planned neighborhood developments (good or bad) we should know about?
- What's the average days-on-market for RENTAL listings here right now (not sales)? A rising rental-DOM trend means longer vacancies and softer asking-rent achievability than the comps imply.
- What's the recent tenant-quality profile in this submarket — average credit score on applications, eviction rate, late-payment / NSF rate, and stable-employment percentage? A property-management company in the area should have these aggregated.
- How much new for-sale + rental construction is in the pipeline within 1–3 miles? Heavy new supply typically softens prices + rents 12–24 months out; constrained supply supports both.
Investment metrics
- 1% rule
- 1.15% ✓
- Cap rate
- 4.69%
- Cash-on-cash
- -5.73%
- DSCR
- 0.74
- GRM
- 7.2
CMA / ARV
No comps found within radius.
Projected returns pro-forma
0.69% appreciation · 0.51% rent growth · sell at horizon
- IRR
- -8.0%
- Equity multiple
- 0.62×
- Total profit
- $-28,982
- Equity at exit
- $87,637
- IRR
- -4.4%
- Equity multiple
- 0.52×
- Total profit
- $-36,219
- Equity at exit
- $113,158
Cash invested: $75,460 (down + closing). Projections, not guarantees.
Landlord ↔ Tenant lean methodology
- Overall (STATE)
- 87 Strongly Landlord-Friendly
- State Florida
- 87 Strongly Landlord-Friendly · R+3
- County
- — inherits STATE
- City
- — inherits STATE
ZIP-level market 33446
- Home prices YoY
- 0.3%
- Rents YoY
- 0.5%
- Active inventory
- 586
- Price-to-rent
- 7.2×
Monthly cashflow live
- Estimated rent
- $3,100 high interval (Pro) →
- Mortgage (P&I)
- −$1,413
- Tax from tax record
- −$325 /mo · $3,898/yr
- Insurance
- −$112
- HOA
- −$959
- Lot rent
- −$0
- Vacancy / Maint / Mgmt
- −$651
- Net cashflow
- $-361
Break-even live
Sensitivity live
| Price | -10% $-208 | -5% $-284 | +0% $-361 | +5% $-437 | +10% $-513 |
|---|---|---|---|---|---|
| Rent | -10% $-606 | -5% $-483 | +0% $-361 | +5% $-238 | +10% $-116 |
| Rate | -1.0pp $-225 | -0.5pp $-292 | base $-361 | +0.5pp $-430 | +1.0pp $-502 |
UW: 25.0% down · 7.5% · 30yr · 1.5% tax · 5.0% vac · 8.0% maint · 8.0% mgmt
Financing live
Cash to close
- Down payment
- $67,375
- Closing costs
- $8,085
- Reserves months
- —
- Total cash needed
- —
Loan-product check · same deal, 3 products live
Conventional
25% down · 7.5% · 30yr
- Down + closing
- —
- Monthly P&I
- —
- Monthly cashflow
- —
- DSCR
- —
- Eligible?
- —
Personal DTI + credit; lowest rate.
DSCR
20% down · 8.5% · 30yr
- Down + closing
- —
- Monthly P&I
- —
- Monthly cashflow
- —
- DSCR
- —
- Eligible?
- —
No personal income docs; deal must DSCR.
Hard money
10% down · 12.0% · 12mo
- Down + closing
- —
- Monthly P&I
- —
- Monthly cashflow
- —
- DSCR
- —
- Eligible?
- —
Short-term bridge; refi at stabilization.
Rent comps 40 comps
| Address | Beds | Baths | Sqft | Rent | $/sqft | DOM | Units | Dist |
|---|---|---|---|---|---|---|---|---|
| 7657 Lexington Club Blvd Delray Beach, FL | 3.0 | 2.0 | 1645 | $4,500 | $2.74 | 26d | 1 | 0.14mi |
| 15212 W Tranquility Lake Dr Unit 15212 Delray Beach, FL | 2.0 | 2.0 | 1175 | $3,250 | $2.77 | 24d | 1 | 0.26mi |
| 7512 Eagle Point Dr Delray Beach, FL | 3.0 | 2.0 | 1463 | $4,000 | $2.73 | 6d | 1 | 0.35mi |
| 7512 Eagle Point Dr Delray Beach, FL | 3.0 | 2.0 | 1461 | $4,000 | $2.74 | 1d | 1 | 0.35mi |
| 7512 Eagle Point Dr Unit 7512 Delray Beach, FL | 3.0 | 2.0 | 1463 | $4,000 | $2.73 | 21d | 1 | 0.35mi |
| 15306 W Tranquility Lake Dr Delray Beach, FL | 2.0 | 2.0 | 1175 | $2,850 | $2.43 | 13d | 1 | 0.35mi |
| 15711 Loch Maree Ln #4702 Delray Beach, FL | 2.0 | 2.0 | 1688 | $10,000 | $5.92 | 26d | 1 | 0.47mi |
| 15694 Loch Maree Ln #5903 Delray Beach, FL | 2.0 | 2.0 | 1705 | $9,000 | $5.28 | 17d | 1 | 0.51mi |
| 7533 Glendevon Ln #907 Delray Beach, FL | 2.0 | 2.0 | 1311 | $8,000 | $6.10 | 17d | 1 | 0.51mi |
| 7455 Glendevon Ln #206 Delray Beach, FL | 2.0 | 2.0 | 1260 | $9,500 | $7.54 | 26d | 1 | 0.51mi |
| 7509 Glendevon Ln #1002 Delray Beach, FL | 2.0 | 2.0 | 1399 | $9,500 | $6.79 | 20d | 1 | 0.51mi |
| 15831 Loch Maree Ln #5502 Delray Beach, FL | 2.0 | 2.0 | 1340 | $9,500 | $7.09 | 15d | 1 | 0.56mi |
| 8061 Red Jasper Ln Delray Beach, FL | 2.0 | 2.0 | 1097 | $2,877 | $2.62 | 26d | 1 | 0.57mi |
| 8061 Red Jasper Ln Delray Beach, FL | 2.0 | 2.0 | 1153 | $3,002 | $2.60 | 5d | 1 | 0.57mi |
| 8061 Red Jasper Ln Delray Beach, FL | 2.0 | 2.0 | 1097 | $2,892 | $2.64 | 14d | 1 | 0.57mi |
| 14856 Barletta Way Delray Beach, FL | 2.0 | 2.0 | 1406 | $3,200 | $2.28 | 26d | 1 | 0.66mi |
| 15055 Michelangelo Blvd Delray Beach, FL | 2.0–3.0 | 2.0 | 1158 | $2,125 | $1.83 | 24d | 2 | 0.67mi |
| 15055 Michelangelo Blvd #208 Delray Beach, FL | 3.0 | 2.0 | 1238 | $2,500 | $2.02 | 1d | 1 | 0.67mi |
| 15085 Michelangelo Blvd #202 Delray Beach, FL | 3.0 | 2.0 | 1238 | $2,700 | $2.18 | 24d | 1 | 0.67mi |
| 7350 Kinghurst Dr #305 Delray Beach, FL | 2.0 | 2.0 | 1220 | $4,500 | $3.69 | 1d | 1 | 0.68mi |
| 7350 Kinghurst Dr #305 Delray Beach, FL | 2.0 | 2.0 | 1220 | $4,500 | $3.69 | 24d | 1 | 0.68mi |
| 7350 Kinghurst Dr Delray Beach, FL | 2.0 | 2.0 | 1220 | $4,500 | $3.69 | 17d | 1 | 0.68mi |
| 15065 Michelangelo Blvd #105 Delray Beach, FL | 2.0 | 2.0 | 1079 | $2,400 | $2.22 | 24d | 1 | 0.70mi |
| 15065 Michelangelo Blvd #105 Delray Beach, FL | 2.0 | 2.0 | 1079 | $2,400 | $2.22 | 4d | 1 | 0.70mi |
| 15035 Michelangelo Blvd #103 Delray Beach, FL | 2.0 | 2.0 | 1079 | $2,000 | $1.85 | 26d | 1 | 0.70mi |
| 7254 Clunie Pl #15002 Delray Beach, FL | 2.0 | 2.0 | 1311 | $9,000 | $6.86 | 26d | 1 | 0.73mi |
| 14895 Builtmore Way Delray Beach, FL | 2.0 | 2.0 | 1103 | $1,800 | $1.63 | 26d | 1 | 0.73mi |
| 14898 Wedgefield Dr #202 Delray Beach, FL | 2.0 | 2.0 | 1103 | $2,000 | $1.81 | 20d | 1 | 0.73mi |
| 15005 Michelangelo Blvd Delray Beach, FL | 2.0–3.0 | 2.0 | 1234 | $2,050 | $1.66 | 1d | 21 | 0.75mi |
| 15015 Michelangelo Blvd #102 Delray Beach, FL | 3.0 | 2.0 | 1238 | $2,499 | $2.02 | 26d | 1 | 0.76mi |
| 15015 Michelangelo Blvd #102 Delray Beach, FL | 3.0 | 2.0 | 1238 | $2,499 | $2.02 | 5d | 1 | 0.76mi |
| 8085 Tumblestone Ct Delray Beach, FL | 3.0 | 2.0 | 1242 | $2,998 | $2.41 | 4d | 1 | 0.76mi |
| 8085 Tumblestone Ct Delray Beach, FL | 2.0 | 2.0 | 1076 | $2,668 | $2.48 | 5d | 1 | 0.76mi |
| 8085 Tumblestone Ct Delray Beach, FL | 2.0 | 2.0 | 1097 | $2,679 | $2.44 | 26d | 1 | 0.76mi |
| 15145 Michelangelo Blvd #102 Delray Beach, FL | 3.0 | 2.0 | 1238 | $2,600 | $2.10 | 5d | 1 | 0.76mi |
| 15145 Michelangelo Blvd #102 Delray Beach, FL | 3.0 | 2.0 | 1238 | $2,600 | $2.10 | 1d | 1 | 0.76mi |
| 15145 Michelangelo Blvd #102 Delray Beach, FL | 3.0 | 2.0 | 1238 | $2,600 | $2.10 | 26d | 1 | 0.76mi |
| 15018 Three Ponds Trl Delray Beach, FL | 3.0 | 2.0 | 1703 | $4,150 | $2.44 | 26d | 1 | 0.77mi |
| 15018 Three Ponds Trl Delray Beach, FL | 3.0 | 2.0 | 1703 | $4,150 | $2.44 | 14d | 1 | 0.77mi |
| 14896 Bal Moral Ln Delray Beach, FL | 2.0 | 2.0 | 1040 | $2,200 | $2.12 | 26d | 1 | 0.79mi |
HOA detail
- Monthly dues
- $959 · $11,508/yr
- Likely covers
- poolsecurity
Listing history 37 events
-
2026-06-22days on market $269,500 Active 79 DOM
-
2026-06-21pricedays on market $269,500 Active 78 DOM
-
2026-06-18days on market $275,000 Active 75 DOM
-
2026-06-17days on market $275,000 Active 74 DOM
-
2026-06-16days on market $275,000 Active 73 DOM
-
2026-06-15days on market $275,000 Active 72 DOM
-
2026-06-13days on market $275,000 Active 70 DOM
-
2026-06-09days on market $275,000 Active 66 DOM
-
2026-06-08days on market $275,000 Active 65 DOM
-
2026-06-07days on market $275,000 Active 64 DOM
-
2026-06-04days on market $275,000 Active 61 DOM
-
2026-06-03days on market $275,000 Active 60 DOM
-
2026-06-02days on market $275,000 Active 59 DOM
-
2026-06-01days on market $275,000 Active 58 DOM
-
2026-05-31days on market $275,000 Active 57 DOM
-
2026-04-21price $275,000
-
2026-04-04$279,900 Active
-
2026-02-21historical
-
2025-10-24price $315,500
-
2025-07-25$319,500 Active
-
2025-06-23historical
-
2025-04-29price $329,500
-
2025-03-13price $332,500
-
2024-10-31$375,500 Active
-
2022-12-23soldstatus $285,000
-
2022-12-22soldstatus $285,000 Closed
-
2022-12-01status Pending
-
2022-11-10price $310,000
-
2022-10-27price $320,000
-
2022-10-19price $329,000
-
2022-10-03$349,999 Active
-
2014-10-16historical
-
2008-04-02soldstatus $150,000
-
2008-01-15historical
-
2007-06-01$185,000
-
2006-06-01$225,000
-
1995-07-12soldstatus $83,000
ⓘ Source: listings_history table (triggers on properties + properties_extension) + one-shot
backfill from property_details.listing_events for pre-trigger history.
Tax reassessment forecast FL · Resets to sale price
- Current annual tax
- $3,898 · $325/mo
- Projected year-2 tax
- $3,898 · $325/mo
- Expected delta
- $0/yr ($0/mo · 0.0%)
ⓘ Screening estimate from a state-policy table — verify with the county assessor before closing.
Climate risk First Street
- Flood 1/10 Low FEMA zone X (unshaded) · 0% chance over 30 yrs
- Wildfire 4/10 Moderate
- Heat 9/10 Extreme 6 d/yr ≥107°F today · 22 d/yr by 30 yrs out
- Wind 10/10 Extreme 99% chance of damaging wind over 30 yrs
- Air quality 2/10 Low 0 unhealthy d/yr today · 2 by 30 yrs out
Nearby sold comps map
Loading sold comps map…
Walkable amenities ~0.75 mi
Loading nearby amenities…
Taxation est. · year 1
- Rental income
- $37,197
- − Mortgage interest
- −$15,096
- − Property taxes
- −$3,898
- − Insurance
- −$1,348
- − Repairs & maintenance
- −$2,976
- − Management
- −$2,976
- − HOA
- −$11,508
- − Depreciation
- −$7,840
- Taxable loss
- −$8,444
- Est. tax savings @ 24.0%
- +$2,027
- After-tax cash flow
- $-2,301/yr
For passive investors: Depreciation is non-cash, so a rental often shows a tax loss while cash-flowing — sheltering income. Rental losses are passive: they offset passive income freely, and up to $25,000/yr can offset ordinary (W-2) income if you actively participate and your MAGI is under $100k (phasing out to $0 by $150k); unused losses carry forward. On sale, claimed depreciation is recaptured at up to 25%, and gains may owe capital-gains tax (a 1031 exchange can defer both). Figures are a year-1 estimate at your 24.0% rate — not tax advice; consult a CPA.
Schools (NCES district)
- District
- Palm Beach
- NCES district ID
- 1201500
- Math proficiency
- 46% ▼ -16.00%
- Reading proficiency
- 53% ▼ -4.00%
- Median HH income
- $53,943
- Composite
- 42.72/100
- National rank
- #3160
- State rank
- #34 of 73 in FL
Livability — Delray Beach
- Score
- 77/100
- State rank
- #202
- US rank
- #3160
Category grades
Schools grade is shown separately in the Schools card above.
Census & demographics
- County
- Palm Beach County · 1,438,312 people
- City population
- 123,167
- Metro
- Miami-Fort Lauderdale-Pompano Beach, FL
- Population (ZIP)
- 28,431
- Household income
- $80,187
- Rent vs Own
- Severe rent burden
- 494.0
Population outlook (Palm Beach County) Hauer SSP2
- Today (2025)
- 1,637,487 people
- By 2030
- 1,743,255 · +6.5%
- By 2040
- 1,948,712 · +19.0%
- By 2050
- 2,132,979 · +30.3%
- By 2075
- 2,530,027 · +54.5%
- By 2100
- 2,706,979 · +65.3%
Race, ethnicity, and origin ACS 2023
- Neighborhood character
- Predominantly White (79%)
- Race & ethnicity
- White 79% Hispanic / Latino 13% Two or more races 9% Black 4%
- Hispanic origin (detail)
- Puerto Rican 3% Dominican 1%
- Common ancestry
- Romanian 9% Scotch-Irish 9% Italian 2%
- Foreign-born
- 20% · Canada, Jamaica, Guatemala
- Languages at home
- 80% English-only · Spanish 12% Other Indo-European 2% French/Haitian/Cajun 2%
Political lean MEDSL · Palm Beach
- 2024 margin
- Toss-up / Even · D 50.0% · R 49.2%
- 2008→2024 swing
- -22.1pp toward R · 2008: 22.9pp · 2024: 0.8pp
- All cycles
- 2024: D+0.8 2020: D+12.8 2016: D+15.3 2012: D+17.0 2008: D+22.9
Not yet ingested
- Civics
- —
Market trends
- HPI YoY
- ▲ 0.69%
- Current HPI
- 242.5138
- Rent YoY
- ▲ 0.51%
- Metro
- Miami-Fort Lauderdale-Pompano Beach, FL
- State GDP YoY
- ▲ 3.28%
- F500 in state
- 36
Industry mix (Fortune 500 HQ in FL)
| Industry | F500 HQs | Revenue |
|---|---|---|
| Industrial Technology | 2 | $29B |
|
||
| Insurance | 2 | $17B |
|
||
| Retail | 1 | $60B |
|
||
| Technology Distribution | 1 | $58B |
|
||
| Homebuilding | 1 | $35B |
|
||
| Technology Manufacturing | 1 | $35B |
|
||
Price history
+231.3% since first listed22 events — show timeline
- 2026-04-21 Price Changed $275,000 Beaches MLS
- 2026-04-04 Listed $279,900 Beaches MLS
- 2026-02-21 Listing Removed — Beaches MLS
- 2025-10-24 Price Changed $315,500 Beaches MLS
- 2025-07-25 Listed $319,500 Beaches MLS
- 2025-06-23 Listing Removed — Beaches MLS
- 2025-04-29 Price Changed $329,500 Beaches MLS
- 2025-03-13 Price Changed $332,500 Beaches MLS
- 2024-10-31 Listed $375,500 Beaches MLS
- 2022-12-23 Sold (Public Records) $285,000 Public Records
- 2022-12-22 Sold (MLS) $285,000 Beaches MLS
- 2022-12-01 Pending — Beaches MLS
- 2022-11-10 Price Changed $310,000 Beaches MLS
- 2022-10-27 Price Changed $320,000 Beaches MLS
- 2022-10-19 Price Changed $329,000 Beaches MLS
- 2022-10-03 Listed $349,999 Beaches MLS
- 2014-10-16 Listing Removed — Beaches MLS
- 2008-04-02 Sold (Public Records) $150,000 Public Records
- 2008-01-15 Listing Removed — Beaches MLS
- 2007-06-01 Listed $185,000 Beaches MLS
- 2006-06-01 Listed $225,000 Beaches MLS
- 1995-07-12 Sold (Public Records) $83,000 Public Records
Property tax history
+7.2%/yrLatest (2025): $3,898 · +3.2% YoY. Source: county tax records.
Cash-flow waterfall
monthlySold comps — $/sqft
last 12 mo · ≤1 miLoading sold comps…