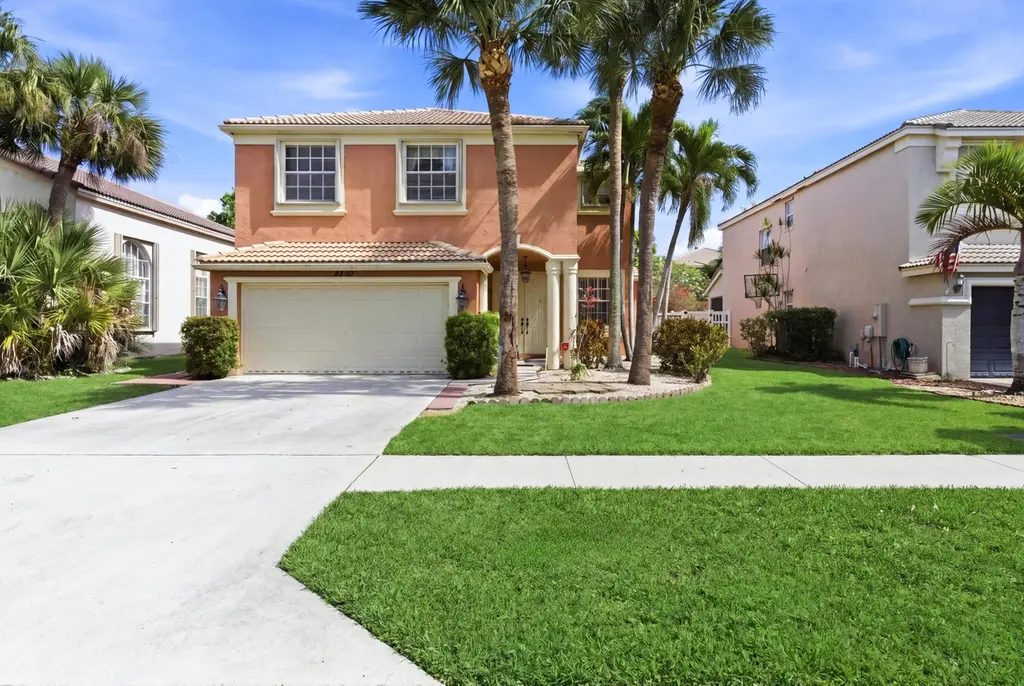
2430 Westmont Dr · Royal Palm Beach, FL
Flood risk 1/10 · Minimal
- FEMA flood zone
- X (unshaded)
- Chance of flooding over 30 yrs
- 0.0%
- Est. flood insurance / yr
- $507 – $1,088
Fire risk 4/10 · Minor
- Est. fire insurance / yr
- $947 – $1,759
Heat risk 10/10 · Severe
- Hot days now (above 107°F)
- 7 days/yr
- Hot days in 30 yrs
- 25 days/yr
Wind risk 10/10 · Severe
- Chance of severe wind over 30 yrs
- 99.0%
Air-quality risk 2/10 · Minimal
- Unhealthy air days now
- 0 days/yr
- Unhealthy air days in 30 yrs
- 1 days/yr
Risk factors via First Street. Map © Google.
Why this score? — see what drove the D+ grade
The composite is a weighted blend of 9 inputs, each scored 0–100. Each bar is that input's sub-score; the figure is the points it added to the 100-point composite (weight × sub-score).
- ARV discount +15.0/15.0
- Appreciation +10.0/10.0
- Cash flow +7.7/30.0
- Schools +4.3/10.0
- Livability +4.0/5.0
- Rent growth +2.7/5.0
- Condition / age +2.5/5.0
- 1% rule +1.9/10.0
- DSCR +1.8/10.0
$640,000
🖨 Deal sheet 📄 Offer letter ✓ Due diligence
Listing remarks
Welcome to this beautifully maintained and spacious home located in the highly sought-after Madison Green community of Royal Palm Beach. Thoughtfully designed for both comfort and functionality, this residence features five bedrooms and multiple living areas, providing ample space for everyday living, entertaining, or working from home. The flexible layout easily adapts to your lifestyle, whether hosting guests or enjoying quiet time. Step outside to your own private backyard oasis, complete with a sparkling pool—perfect for relaxing on sunny Florida days—and a selection of desirable fruit trees that add both charm and a natural touch. This inviting outdoor space is ideal for en
Key facts
- 6,380 sq ft lot
- 2 garage spots
- Pool
Property features AI
Finance
- Other: Pets allowed with number limits
- HOA & community: Part of Ashford Village Association and Madison Green Master Association; Community amenities include clubhouse, fitness center, playground, basketball court, tennis courts, pickleball courts, and gated access; HOA fee paid quarterly (listed)
Exterior
- Parking: Attached 2-car garage; Driveway parking; Two covered spaces; Total parking capacity listed
- Security: Smoke detectors; Gated community (no guard)
- Utilities: Public water; Public sewer; Electricity available; Cable available
- Home design: Single family residence; Two stories; Resale property; North-facing
- Construction: Concrete block with stucco construction; Concrete and tile roof; Built by Minto Communities
- Exterior features: Private in-ground salt water pool (fenced); Back yard fully fenced; Fruit trees; Sidewalks; Concrete and paved roads
Interior
- Kitchen: Dishwasher; Microwave; Refrigerator; Electric water heater
- Bedrooms: No main-level bedrooms
- Flooring: Carpet; Ceramic tile
- Bathrooms: Two full bathrooms and one half bathroom; One bathroom on the main level
- Heating & cooling: Central heating; Central air conditioning; Ceiling fans; Electric cooling
- Interior features: Entrance foyer; High ceilings; Kitchen island; Walk-in closets; Roman tub; Upstairs living area; Blinds on windows
- Laundry & utility: Main-level laundry room with sink
Neighborhood map
What this means for you Summary
Snapshot
- This is a 5-bed/2.5-bath single-family listed at $640k.
Deal economics
- At list price, monthly cash flow is $-750 ($-9k/yr) — negative.
- To cash-flow at today's rent, offer at most $508k (20.7% below list).
- To meet the 1% rule (rent ≥ 1% of price), the offer needs to be $444k (30.7% below list).
- Recommended offer: $444k (30.7% below list) — sets the bar for 1% rule.
Location & tenants
- Location reads 79/100 on livability (#135 in FL, #2,039 nationally) — a middle-class / working-renter tenant base. Strengths: employment A+, housing A+, health & safety A+; Watch: cost of living C-, amenities F, commute F.
- Palm Beach (suburban): math 46% / reading 53% proficiency, ranked #34 of 73 in FL (top 47%) — families likely to look elsewhere, expect single-tenant / working-renter base with shorter leases.
- Zoned schools: Royal Palm Beach Elementary School (math 58% / reading 62%, grade B-, #680 of 2,144 statewide, top 32%, 662 students, 40% FRL); Crestwood Community Middle (math 49% / reading 52%, grade C, #246 of 571 statewide, top 44%, 724 students, 50% FRL); Royal Palm Beach High School (math 22% / reading 38%, grade F, #441 of 667 statewide, top 67%, 2,343 students, 57% FRL) — zoned schools at 49% FRL track the district average.
- Market conditions: Rents flat; 574 active listings in the ZIP; 10 comparable units currently listed for rent nearby; rentals at typical pace (median 22d on market — plan ~3-4 weeks tenant-placement turnaround); solid renter incomes; 3,974 units permitted in Palm Beach County in 2024 (1,012 in 5+ unit buildings).
- At $4,436/mo this rent would consume 57% of the median local household income ($93k/yr) (locally 1870% of renters already pay >50% of income on rent) — very limited rent-growth headroom before tenants either downsize or default.
Forward outlook
- In year one you build about $68k of equity ($4k loan paydown + $64k appreciation (10.0% local appreciation)).
- Palm Beach County population projected at +30% by 2050 — long-run rental-demand tailwind backs the buy-and-hold thesis.
- By year 2, paydown + projected appreciation supports a ~$110k cash-out refi (75% LTV) — recoverable capital for the next deal without selling this one.
Negotiation context
- It's been on market 62 days — a 6% lower offer ($602k) is reasonable based on typical stale-listing flexibility.
Risks & watch-outs
- Climate carrying-cost: severe wind risk, 99% chance of damaging wind over 30y; extreme-heat days projected 7→25/yr by 2055 (HVAC capex compounding) — expect insurance premiums to compound above CPI over the hold.
Questions for the listing agent
- What do current leases actually rent for vs. the listed asking? Can we see a recent rent roll and the last 12 months of T-12 income?
- It's been on market 62 days. Have you received any prior offers? Is the seller open to a 31% concession, seller financing, or rate buy-down credit?
- What does the HOA fee cover, when was the last increase, and are there any pending special assessments or reserve-fund shortfalls?
- Why hasn't it sold? Are there any deal-killer items the seller is aware of (foundation, flood, title, zoning, code violations)?
- Is there a deadline driving the sale (1031 exchange, divorce, estate, relocation)? That informs how much negotiation room exists.
- Schools are B-rated — typically a magnet for longer-tenancy family renters. What's the average tenant stay here, and is there a school-zone premium baked into asking?
- The area grade is low — what's the realistic commute time and amenity access for the typical tenant pool here? Any planned neighborhood developments (good or bad) we should know about?
- What's the average days-on-market for RENTAL listings here right now (not sales)? A rising rental-DOM trend means longer vacancies and softer asking-rent achievability than the comps imply.
- What's the recent tenant-quality profile in this submarket — average credit score on applications, eviction rate, late-payment / NSF rate, and stable-employment percentage? A property-management company in the area should have these aggregated.
- How much new for-sale + rental construction is in the pipeline within 1–3 miles? Heavy new supply typically softens prices + rents 12–24 months out; constrained supply supports both.
Investment metrics
- 1% rule
- 0.69% ✗
- Cap rate
- 4.89%
- Cash-on-cash
- -5.02%
- DSCR
- 0.78
- GRM
- 12.0
CMA / ARV
- ARV (on-the-fly)
- $855,624
- Comps found
- 1
Show comp detail 1 sale within ~0.75 mi
| Address | Dist | Beds/Ba | Sqft | Sold | Price | $/sf | Match |
|---|---|---|---|---|---|---|---|
| 1114 Brinely Pl | 0.63mi | 5/3.0 | 2,385 (-14%) | 3mo | $735,000 | $308 | 43 |
Match score weights: distance 35% · size 25% · config 20% · recency 20%. Top-matched comps best support the ARV.
Projected returns pro-forma
10.0% appreciation · 0.85% rent growth · sell at horizon
- IRR
- 20.1%
- Equity multiple
- 2.63×
- Total profit
- $291,383
- Equity at exit
- $576,563
- IRR
- 18.0%
- Equity multiple
- 5.90×
- Total profit
- $878,110
- Equity at exit
- $1,243,379
Cash invested: $179,200 (down + closing). Projections, not guarantees.
Landlord ↔ Tenant lean methodology
- Overall (STATE)
- 87 Strongly Landlord-Friendly
- State Florida
- 87 Strongly Landlord-Friendly · R+3
- County
- — inherits STATE
- City
- — inherits STATE
ZIP-level market 33411
- Home prices YoY
- 1.9%
- Rents YoY
- 0.8%
- Active inventory
- 574
- Price-to-rent
- 12.0×
Monthly cashflow live
- Estimated rent
- $4,436 high interval (Pro) →
- Mortgage (P&I)
- −$3,356
- Tax from tax record
- −$375 /mo · $4,504/yr
- Insurance
- −$267
- HOA
- −$256
- Vacancy / Maint / Mgmt
- −$932
- Net cashflow
- $-750
Break-even live
UW: 25.0% down · 7.5% · 30yr · 1.5% tax · 5.0% vac · 8.0% maint · 8.0% mgmt
Financing live
Cash to close
- Down payment
- $160,000
- Closing costs
- $19,200
- Reserves months
- —
- Total cash needed
- —
Loan-product check · same deal, 3 products live
Conventional
25% down · 7.5% · 30yr
- Down + closing
- —
- Monthly P&I
- —
- Monthly cashflow
- —
- DSCR
- —
- Eligible?
- —
Personal DTI + credit; lowest rate.
DSCR
20% down · 8.5% · 30yr
- Down + closing
- —
- Monthly P&I
- —
- Monthly cashflow
- —
- DSCR
- —
- Eligible?
- —
No personal income docs; deal must DSCR.
Hard money
10% down · 12.0% · 12mo
- Down + closing
- —
- Monthly P&I
- —
- Monthly cashflow
- —
- DSCR
- —
- Eligible?
- —
Short-term bridge; refi at stabilization.
Rent comps 10 comps
| Address | Beds | Baths | Sqft | Rent | $/sqft | DOM | Units | Dist |
|---|---|---|---|---|---|---|---|---|
| 2418 Westmont Dr Royal Palm Beach, FL | 4.0 | 3.0 | 2361 | $4,950 | $2.10 | 3d | 1 | 0.07mi |
| 2064 Reston Cir Royal Palm Beach, FL | 4.0 | 2.5 | 2857 | $3,990 | $1.40 | 4d | 1 | 0.50mi |
| 2064 Reston Cir Royal Palm Beach, FL | 4.0 | 2.5 | 2857 | $3,990 | $1.40 | 24d | 1 | 0.50mi |
| 1724 Annandale Cir Royal Palm Beach, FL | 6.0 | 4.0 | 3974 | $6,490 | $1.63 | 24d | 1 | 0.72mi |
| 147 Alcazar St Royal Palm Beach, FL | 4.0 | 3.0 | 2182 | $3,950 | $1.81 | 4d | 1 | 0.82mi |
| 147 Sunflower Cir Royal Palm Beach, FL | 4.0 | 2.0 | 2000 | $4,300 | $2.15 | 19d | 1 | 0.93mi |
| 147 Sunflower Cir Royal Palm Beach, FL | 4.0 | 2.0 | 2000 | $4,100 | $2.05 | 1d | 1 | 0.93mi |
| 1104 Oakwater Dr Royal Palm Beach, FL | 4.0 | 2.5 | 2003 | $3,896 | $1.95 | 24d | 1 | 0.98mi |
| 1104 Oakwater Dr Royal Palm Beach, FL | 4.0 | 2.5 | 2003 | $3,896 | $1.95 | 21d | 1 | 0.98mi |
| 104 Oxford Ct Royal Palm Beach, FL | 4.0 | 3.0 | 2133 | $4,500 | $2.11 | 24d | 1 | 1.14mi |
HOA detail
- Monthly dues
- $256 · $3,072/yr
- Likely covers
- pool
Listing history 15 events
-
2026-06-18days on market $640,000 Active 62 DOM
-
2026-06-17days on market $640,000 Active 61 DOM
-
2026-06-16days on market $640,000 Active 60 DOM
-
2026-06-15days on market $640,000 Active 59 DOM
-
2026-06-13days on market $640,000 Active 57 DOM
-
2026-06-09days on market $640,000 Active 53 DOM
-
2026-06-08days on market $640,000 Active 52 DOM
-
2026-06-07days on market $640,000 Active 51 DOM
-
2026-06-04days on market $640,000 Active 48 DOM
-
2026-06-03days on market $640,000 Active 47 DOM
-
2026-06-02days on market $640,000 Active 46 DOM
-
2026-06-01days on market $640,000 Active 45 DOM
-
2026-05-31days on market $640,000 Active 44 DOM
-
2026-05-18price $640,000
-
2026-04-17$650,000 Active
ⓘ Source: listings_history table (triggers on properties + properties_extension) + one-shot
backfill from property_details.listing_events for pre-trigger history.
Tax reassessment forecast FL · Resets to sale price
- Current annual tax
- $4,504 · $375/mo
- Projected year-2 tax
- $5,312 · $443/mo
- Expected delta
- +$808/yr (+$67/mo · 18.0%)
ⓘ Screening estimate from a state-policy table — verify with the county assessor before closing.
Climate risk First Street
- Flood 1/10 Low FEMA zone X (unshaded) · 0% chance over 30 yrs
- Wildfire 4/10 Moderate
- Heat 10/10 Extreme 7 d/yr ≥107°F today · 25 d/yr by 30 yrs out
- Wind 10/10 Extreme 99% chance of damaging wind over 30 yrs
- Air quality 2/10 Low 0 unhealthy d/yr today · 1 by 30 yrs out
Nearby sold comps map
Loading sold comps map…
Walkable amenities ~0.75 mi
Loading nearby amenities…
Taxation est. · year 1
- Rental income
- $53,234
- − Mortgage interest
- −$35,850
- − Property taxes
- −$4,504
- − Insurance
- −$3,200
- − Repairs & maintenance
- −$4,259
- − Management
- −$4,259
- − HOA
- −$3,072
- − Depreciation
- −$18,618
- Taxable loss
- −$20,528
- Est. tax savings @ 24.0%
- +$4,927
- After-tax cash flow
- $-4,069/yr
For passive investors: Depreciation is non-cash, so a rental often shows a tax loss while cash-flowing — sheltering income. Rental losses are passive: they offset passive income freely, and up to $25,000/yr can offset ordinary (W-2) income if you actively participate and your MAGI is under $100k (phasing out to $0 by $150k); unused losses carry forward. On sale, claimed depreciation is recaptured at up to 25%, and gains may owe capital-gains tax (a 1031 exchange can defer both). Figures are a year-1 estimate at your 24.0% rate — not tax advice; consult a CPA.
Schools (NCES district)
- District
- Palm Beach
- NCES district ID
- 1201500
- Math proficiency
- 46% ▼ -16.00%
- Reading proficiency
- 53% ▼ -4.00%
- Median HH income
- $53,943
- Composite
- 42.72/100
- National rank
- #3160
- State rank
- #34 of 73 in FL
Livability — Royal Palm Beach
- Score
- 79/100
- State rank
- #135
- US rank
- #2039
Category grades
Schools grade is shown separately in the Schools card above.
Census & demographics
- Census place
- Royal Palm Beach, FL
- County
- Palm Beach County · 1,438,312 people
- City population
- 75,299
- Metro
- Miami-Fort Lauderdale-Pompano Beach, FL
- Population (ZIP)
- 76,863
- Household income
- $92,591
- Rent vs Own
- Severe rent burden
- 1870.0
Population outlook (Palm Beach County) Hauer SSP2
- Today (2025)
- 1,637,487 people
- By 2030
- 1,743,255 · +6.5%
- By 2040
- 1,948,712 · +19.0%
- By 2050
- 2,132,979 · +30.3%
- By 2075
- 2,530,027 · +54.5%
- By 2100
- 2,706,979 · +65.3%
Race, ethnicity, and origin ACS 2023
- Neighborhood character
- Diverse neighborhood (Simpson 0.70)
- Race & ethnicity
- White 44% Hispanic / Latino 24% Black 23% Two or more races 16% Asian 5%
- Hispanic origin (detail)
- Mexican 2% Puerto Rican 5% Cuban 4% Dominican 2%
- Common ancestry
- Hispanic 6% Romanian 2% Italian 1%
- Foreign-born
- 26% · Canada, Jamaica, China
- Languages at home
- 73% English-only · Spanish 17% French/Haitian/Cajun 4% Other Indo-European 2%
Political lean MEDSL · Palm Beach
- 2024 margin
- Toss-up / Even · D 50.0% · R 49.2%
- 2008→2024 swing
- -22.1pp toward R · 2008: 22.9pp · 2024: 0.8pp
- All cycles
- 2024: D+0.8 2020: D+12.8 2016: D+15.3 2012: D+17.0 2008: D+22.9
Not yet ingested
- Civics
- —
Market trends
- HPI YoY
- ▲ 17.04%
- Current HPI
- 903.78
- Rent YoY
- ▲ 0.85%
- Metro
- Miami-Fort Lauderdale-Pompano Beach, FL
- State GDP YoY
- ▲ 3.28%
- F500 in state
- 36
Industry mix (Fortune 500 HQ in FL)
| Industry | F500 HQs | Revenue |
|---|---|---|
| Industrial Technology | 2 | $29B |
|
||
| Insurance | 2 | $17B |
|
||
| Retail | 1 | $60B |
|
||
| Technology Distribution | 1 | $58B |
|
||
| Homebuilding | 1 | $35B |
|
||
| Technology Manufacturing | 1 | $35B |
|
||
Price history
-1.5% since first listed2 events — show timeline
- 2026-05-18 Price Changed $640,000 Beaches MLS
- 2026-04-17 Listed $650,000 Beaches MLS
Property tax history
+0.1%/yrLatest (2025): $4,504 · +3.2% YoY. Source: county tax records.
Cash-flow waterfall
monthlySold comps — $/sqft
last 12 mo · ≤1 miLoading sold comps…