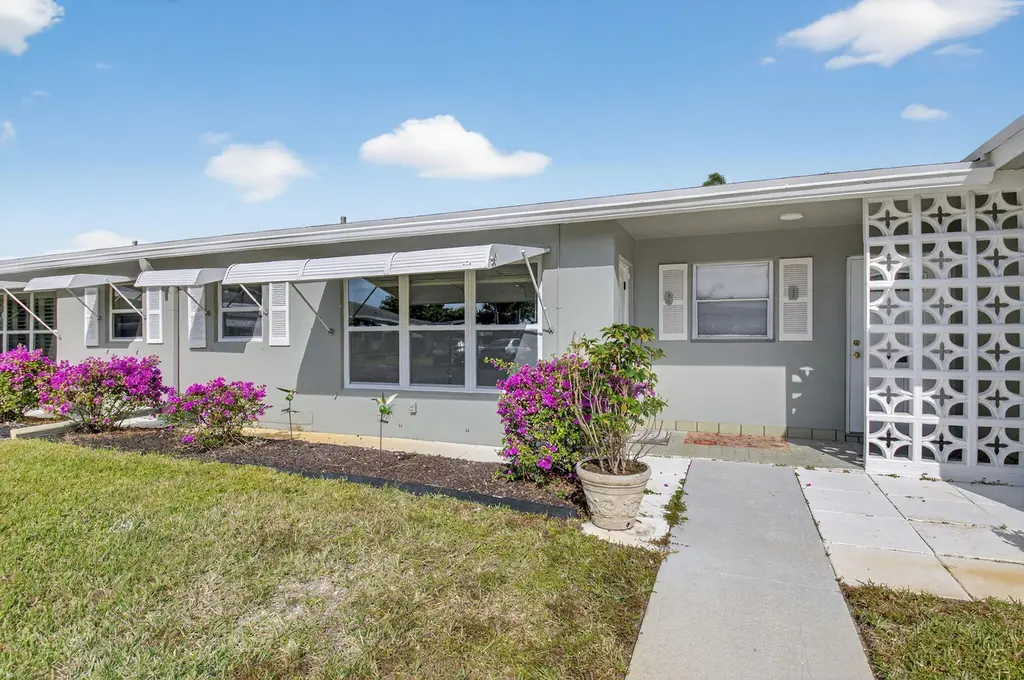
760 High Point Blvd N Unit C · Delray Beach, FL
Flood risk 1/10 · Minimal
- FEMA flood zone
- X (unshaded)
- Chance of flooding over 30 yrs
- 0.0%
- Est. flood insurance / yr
- $507 – $1,088
Fire risk 1/10 · Minimal
- Est. fire insurance / yr
- $947 – $1,759
Heat risk 10/10 · Severe
- Hot days now (above 106°F)
- 7 days/yr
- Hot days in 30 yrs
- 28 days/yr
Wind risk 10/10 · Severe
- Chance of severe wind over 30 yrs
- 99.0%
Air-quality risk 2/10 · Minimal
- Unhealthy air days now
- 1 days/yr
- Unhealthy air days in 30 yrs
- 2 days/yr
Risk factors via First Street. Map © Google.
Why this score? — see what drove the C+ grade
The composite is a weighted blend of 9 inputs, each scored 0–100. Each bar is that input's sub-score; the figure is the points it added to the 100-point composite (weight × sub-score).
- Cash flow +23.5/30.0
- 1% rule +8.8/10.0
- DSCR +7.6/10.0
- ARV discount +7.5/15.0
- Schools +4.3/10.0
- Livability +3.9/5.0
- Rent growth +3.0/5.0
- Condition / age +2.5/5.0
- Appreciation +0.0/10.0
$159,900
🖨 Deal sheet (PDF) 📄 Offer letter ✓ Due diligence
Listing remarks
All Offers Due by End of Day Monday 6/22. Seller Choosing offer 6/23. Reduced for quick sale, bring offers. Best Bang for the Buck in High Point! Investor Friendly allowed to Rent! Fully renovated! All New! The fit and finish is done to perfection! Light and Bright large One bedroom in High Point! This is not updated, This home is completely renovated! Neutral Modern colors and finishes allowing you a move in ready experience to fit any style! LARGE EXPANDED KITCHEN, Luxury Vinyl flooring throughout (Tile Bathrooms), Impact Windows, New Electrical Box, New 40 Gal Water heater, Washer and Dryer, Newer A/C! This home has it all! The location of High Point in Delray is unmatched for the price.
Key facts
- Fully renovated
- New electrical box
- Impact windows
Tags
Property features AI
Finance
- Other: Senior community; Pets not allowed
- HOA & community: Monthly HOA with amenities including clubhouse, community room, pool (heated), shuffleboard court, on-site manager, laundry and management services; HOA fee paid monthly
Exterior
- Parking: Assigned parking; Guest parking; 2 parking spaces
- Utilities: Public water; Public sewer; Electricity connected
- Home design: Condominium; One story; Updated/remodeled condition; North-facing
- Construction: Built with stucco and concrete block (CBS)
- Exterior features: No waterfront; Shingle roof
Interior
- Kitchen: Electric range; Microwave; Dishwasher; Refrigerator; Electric water heater
- Bedrooms: 2 bedrooms on the main level
- Flooring: Tile; Vinyl; Wood
- Bathrooms: 1 full bathroom; 1 half bathroom
- Heating & cooling: Central heating; Central air; Ceiling fans
- Interior features: Walk-in closets; Storm windows
- Laundry & utility: In-unit laundry with washer hookup; Electric dryer hookup
Neighborhood map
What this means for you Summary
Snapshot
- This is a 1-bed/1.5-bath condo listed at $160k.
Deal economics
- At list price, monthly cash flow is $298 ($4k/yr) — positive.
- The deal already cash-flows at list — no discount required.
- Meets the 1% rule at list price ($2k rent vs $160k).
- Recommended offer: $155k (3.0% below list) — sets the bar for market timing.
- Cap rate 8.5% vs local median 4.3% in Delray Beach — top-decile yield for the area; either an underpriced asset or a hidden risk that comps aren't pricing in. Stress-test before assuming the spread holds.
Location & tenants
- Location reads 77/100 on livability (#202 in FL, #3,160 nationally) — a middle-class / working-renter tenant base. Strengths: housing A+, health & safety A+, commute A-; Watch: cost of living C-, crime D-, amenities F.
- Palm Beach (suburban): math 46% / reading 53% proficiency, ranked #34 of 73 in FL (top 47%) — families likely to look elsewhere, expect single-tenant / working-renter base with shorter leases.
- Zoned schools: Crosspointe Elementary School (math 36% / reading 45%, grade F, #1,471 of 2,144 statewide, top 69%, 652 students, 75% FRL); Carver Middle School (math 22% / reading 34%, grade F, #486 of 571 statewide, top 86%, 732 students, 73% FRL); Atlantic High School (math 28% / reading 52%, grade F, #296 of 667 statewide, top 45%, 1,889 students, 59% FRL) — zoned schools average 69% FRL vs 52% district-wide (17 pts higher); higher-poverty schools than district average — tighter screening recommended.
- Zoned-school proficiency averages 36% at this address vs 50% district-wide (-13 pts) — the specific schools serving this property underperform the Palm Beach average; the district grade overstates school quality for this exact location.
- Market conditions: Rents rising (+1.8%/yr); 359 active listings in the ZIP; 40 comparable units currently listed for rent nearby; rentals at typical pace (median 27d on market — plan ~3-4 weeks tenant-placement turnaround); solid renter incomes; 3,974 units permitted in Palm Beach County in 2024 (1,012 in 5+ unit buildings).
Forward outlook
- Local home prices are declining (-3.0%/yr); year-one equity from $1k of loan paydown is wiped out by about $5k of value loss. Plan a longer hold.
- Palm Beach County population projected at +30% by 2050 — long-run rental-demand tailwind backs the buy-and-hold thesis.
Negotiation context
- It's been on market 52 days — a 3% lower offer ($155k) is reasonable based on typical stale-listing flexibility.
- 8 sale attempts since 9y ago; this cycle's ask has dropped $10k (6%) from the opening price — seller is motivated, your offer sets the floor, not the list.
- Current owner paid $90k; list at $160k implies a 78% gain — meaningful room to come down on a strong offer.
Risks & watch-outs
- Watch-outs: HOA is 22% of rent.
- Climate carrying-cost: severe wind risk, 99% chance of damaging wind over 30y; extreme-heat days projected 7→28/yr by 2055 (HVAC capex compounding) — expect insurance premiums to compound above CPI over the hold.
Questions for the listing agent
- It's been on market 52 days. Have you received any prior offers? Is the seller open to a 3% concession, seller financing, or rate buy-down credit?
- Built in 1973 — when were the roof, HVAC, electrical panel, plumbing, and water heater last replaced?
- What does the HOA fee cover, when was the last increase, and are there any pending special assessments or reserve-fund shortfalls?
- Any open or pending special assessments — roof, HVAC, plumbing, elevator, façade? What's the per-unit balance and payoff schedule, and is the seller paying it off at close or rolling it to the buyer?
- Is there a deadline driving the sale (1031 exchange, divorce, estate, relocation)? That informs how much negotiation room exists.
- Schools are B-rated — typically a magnet for longer-tenancy family renters. What's the average tenant stay here, and is there a school-zone premium baked into asking?
- Crime grade is D in this area — have there been break-ins, vandalism, or insurance claims at this property in the last 3 years? What carrier currently insures it and at what premium?
- What's the average days-on-market for RENTAL listings here right now (not sales)? A rising rental-DOM trend means longer vacancies and softer asking-rent achievability than the comps imply.
- What's the recent tenant-quality profile in this submarket — average credit score on applications, eviction rate, late-payment / NSF rate, and stable-employment percentage? A property-management company in the area should have these aggregated.
- How much new apartment / multifamily construction is in the pipeline within 1–3 miles? Heavy new supply (>2% of stock underway) typically softens rents 12–24 months out; light construction supports rent growth.
Investment metrics
- 1% rule
- 1.38% ✓
- Cap rate
- 8.53%
- Cash-on-cash
- 8.00%
- DSCR
- 1.36
- GRM
- 6.0
CMA / ARV
No comps found within radius.
Projected returns pro-forma
-3.0% appreciation · 1.83% rent growth · sell at horizon
- IRR
- -5.6%
- Equity multiple
- 0.79×
- Total profit
- $-9,232
- Equity at exit
- $23,842
- IRR
- 2.4%
- Equity multiple
- 1.16×
- Total profit
- $7,119
- Equity at exit
- $13,825
Cash invested: $44,772 (down + closing). Projections, not guarantees.
Landlord ↔ Tenant lean methodology
- Overall (STATE)
- 87 Strongly Landlord-Friendly
- State Florida
- 87 Strongly Landlord-Friendly · R+3
- County
- — inherits STATE
- City
- — inherits STATE
ZIP-level market 33445
- Rents YoY
- 1.8%
- Active inventory
- 359
- Price-to-rent
- 6.0×
Monthly cashflow live
- Estimated rent
- $2,209 high interval (Pro) →
- Mortgage (P&I)
- −$839
- Tax from tax record
- −$46 /mo · $547/yr
- Insurance
- −$67
- HOA
- −$496
- Vacancy / Maint / Mgmt
- −$464
- Net cashflow
- $298
Break-even live
Sensitivity live
| Price | -10% $389 | -5% $344 | +0% $298 | +5% $253 | +10% $208 |
|---|---|---|---|---|---|
| Rent | -10% $124 | -5% $211 | +0% $298 | +5% $386 | +10% $473 |
| Rate | -1.0pp $379 | -0.5pp $339 | base $298 | +0.5pp $257 | +1.0pp $215 |
UW: 25.0% down · 7.5% · 30yr · 1.5% tax · 5.0% vac · 8.0% maint · 8.0% mgmt
Financing live
Cash to close
- Down payment
- $39,975
- Closing costs
- $4,797
- Reserves months
- —
- Total cash needed
- —
Loan-product check · same deal, 3 products live
Conventional
25% down · 7.5% · 30yr
- Down + closing
- —
- Monthly P&I
- —
- Monthly cashflow
- —
- DSCR
- —
- Eligible?
- —
Personal DTI + credit; lowest rate.
DSCR
20% down · 8.5% · 30yr
- Down + closing
- —
- Monthly P&I
- —
- Monthly cashflow
- —
- DSCR
- —
- Eligible?
- —
No personal income docs; deal must DSCR.
Hard money
10% down · 12.0% · 12mo
- Down + closing
- —
- Monthly P&I
- —
- Monthly cashflow
- —
- DSCR
- —
- Eligible?
- —
Short-term bridge; refi at stabilization.
Rent comps 40 comps
| Address | Beds | Baths | Sqft | Rent | $/sqft | DOM | Units | Dist |
|---|---|---|---|---|---|---|---|---|
| 775 North Dr Unit A Delray Beach, FL | 2.0 | 2.0 | 1175 | $2,000 | $1.70 | 13d | 1 | 0.07mi |
| 775 North Dr Unit A Delray Beach, FL | 2.0 | 2.0 | 1175 | $2,000 | $1.70 | 1d | 1 | 0.07mi |
| 707 High Point Blvd N Unit C Delray Beach, FL | 1.0 | 1.5 | 994 | $1,600 | $1.61 | 26d | 1 | 0.09mi |
| 512 High Point Dr Unit C Delray Beach, FL | 1.0 | 2.0 | 994 | $2,100 | $2.11 | 21d | 1 | 0.22mi |
| 1155 South Drive Cir Unit A Delray Beach, FL | 2.0 | 2.0 | 1080 | $2,195 | $2.03 | 26d | 1 | 0.30mi |
| 1152 Circle Dr Unit D Delray Beach, FL | 2.0 | 2.0 | 1200 | $2,000 | $1.67 | 14d | 1 | 0.30mi |
| 1152 Circle Dr Unit D Delray Beach, FL | 2.0 | 2.0 | 1200 | $2,000 | $1.67 | 26d | 1 | 0.30mi |
| 405 High Point Blvd Unit C Delray Beach, FL | 1.0 | 1.5 | 994 | $1,500 | $1.51 | 26d | 1 | 0.31mi |
| 1142 Circle Ter W Unit C Delray Beach, FL | 1.0 | 1.5 | 1080 | $1,700 | $1.57 | 5d | 1 | 0.32mi |
| 227 Coral Trace Ln Unit 227 Delray Beach, FL | 2.0 | 2.0 | 1376 | $3,100 | $2.25 | 26d | 1 | 0.35mi |
| 2480 S Coral Trace Cir Delray Beach, FL | 2.0 | 2.0 | 1379 | $2,900 | $2.10 | 9d | 1 | 0.35mi |
| 2622 NW 7th Ct Delray Beach, FL | 2.0 | 2.5 | 1384 | $2,750 | $1.99 | 26d | 1 | 0.48mi |
| 212 High Point Ter W Unit C Delray Beach, FL | 1.0 | 1.5 | 1122 | $2,000 | $1.78 | 24d | 1 | 0.49mi |
| 1252 Club Dr W Unit D Delray Beach, FL | 2.0 | 2.0 | 1137 | $2,100 | $1.85 | 26d | 1 | 0.52mi |
| 1252 Club Dr W Unit D Delray Beach, FL | 2.0 | 2.0 | 1137 | $2,100 | $1.85 | 7d | 1 | 0.52mi |
| 797 NW 32nd Ave Delray Beach, FL | 2.0 | 2.0 | 1480 | $2,800 | $1.89 | 19d | 1 | 0.54mi |
| 797 NW 32nd Ave Delray Beach, FL | 2.0 | 2.0 | 1480 | $2,800 | $1.89 | 26d | 1 | 0.54mi |
| 872 NW 29th Ave Unit A Delray Beach, FL | 2.0 | 2.0 | 1188 | $2,700 | $2.27 | 26d | 1 | 0.58mi |
| 500 N Congress Ave Delray Beach, FL | 2.0–3.0 | 1.0–2.0 | 989 | $2,295 | $2.32 | 1d | 6 | 0.64mi |
| 125 Via D Este Delray Beach, FL | 1.0–3.0 | 1.0–2.0 | 1156 | $2,450 | $2.12 | 1d | 14 | 0.65mi |
| 4515 NW 3rd Ct Unit C Delray Beach, FL | 1.0 | 2.0 | 1080 | $1,900 | $1.76 | 26d | 1 | 0.66mi |
| 2095 W Atlantic Ave Delray Beach, FL | 3.0 | 1.0–2.0 | 1012 | $2,825 | $2.79 | 1d | 10 | 0.69mi |
| 305 SW 28th Ave Delray Beach, FL | 2.0 | 2.0 | 1369 | $4,300 | $3.14 | 16d | 1 | 0.74mi |
| 354 SW 28th Ave Delray Beach, FL | 2.0 | 2.0 | 1369 | $5,450 | $3.98 | 26d | 1 | 0.76mi |
| 2915 NW 12th St Unit D Delray Beach, FL | 2.0 | 2.0 | 1499 | $3,200 | $2.13 | 9d | 1 | 0.76mi |
| 2583 NW 13th St Delray Beach, FL | 2.0 | 2.0 | 1466 | $2,600 | $1.77 | 19d | 1 | 0.83mi |
| 4510 NW 2nd St Unit A Delray Beach, FL | 2.0 | 2.0 | 1080 | $1,800 | $1.67 | 26d | 1 | 0.84mi |
| 1720 Depot Ave Delray Beach, FL | 2.0 | 2.0 | 1199 | $2,874 | $2.40 | 16d | 1 | 0.85mi |
| 1720 Depot Ave Delray Beach, FL | 2.0 | 2.0 | 1189 | $2,650 | $2.23 | 26d | 1 | 0.85mi |
| 4080 Sea Grape Cir Delray Beach, FL | — | 2.0 | 1418 | $3,650 | $2.57 | 1d | 1 | 0.88mi |
| 13487 Barwick Rd Unit B Delray Beach, FL | 2.0 | 1.5 | 1092 | $3,600 | $3.30 | 1d | 1 | 0.95mi |
| 4477 NW 3rd Dr Delray Beach, FL | 2.0 | 1.5 | 1109 | $2,550 | $2.30 | 26d | 1 | 0.99mi |
| 210 NW 13th Ave Delray Beach, FL | 2.0 | 1.0 | 800 | $2,200 | $2.75 | 26d | 1 | 1.08mi |
| 1440 NW 20th Ave #104 Delray Beach, FL | 2.0 | 2.0 | 1335 | $2,650 | $1.99 | 16d | 1 | 1.10mi |
| 5265 NW 3rd St Unit C Delray Beach, FL | 1.0 | 1.5 | 1080 | $2,200 | $2.04 | 26d | 1 | 1.13mi |
| 1441 NW 19th Ter #201 Delray Beach, FL | 2.0 | 2.0 | 1148 | $2,250 | $1.96 | 26d | 1 | 1.15mi |
| 1860 NW 13th St #201 Delray Beach, FL | 2.0 | 2.0 | 1335 | $2,800 | $2.10 | 26d | 1 | 1.18mi |
| 1520 NW 19th Ter #203 Delray Beach, FL | 2.0 | 2.0 | 1335 | $2,200 | $1.65 | 26d | 1 | 1.18mi |
| 1551 NW 20th Ave #102 Delray Beach, FL | 2.0 | 2.0 | 1148 | $1,995 | $1.74 | 26d | 1 | 1.18mi |
| 5030 Lakefront Blvd Unit D Delray Beach, FL | 2.0 | 2.0 | 1287 | $1,700 | $1.32 | 26d | 1 | 1.20mi |
HOA detail condo
- Monthly dues
- $496 · $5,952/yr
- Likely covers
- waterelectric
- Assessments
- None detected in remarks — confirm with the listing agent.
Listing history 37 events
-
2026-06-21days on market $159,900 Active 52 DOM
-
2026-06-18days on market $159,900 Active 49 DOM
-
2026-06-17days on market $159,900 Active 48 DOM
-
2026-06-16days on market $159,900 Active 47 DOM
-
2026-06-15days on market $159,900 Active 46 DOM
-
2026-06-13days on market $159,900 Active 44 DOM
-
2026-06-10remarks 699-char remark
-
2026-06-10price $159,900 Active 40 DOM
-
2026-06-09days on market $169,900 Active 40 DOM
-
2026-06-08days on market $169,900 Active 39 DOM
-
2026-06-07days on market $169,900 Active 38 DOM
-
2026-06-04days on market $169,900 Active 35 DOM
-
2026-06-03days on market $169,900 Active 34 DOM
-
2026-05-31days on market $169,900 Active 33 DOM
-
2026-04-28$169,900 Active
-
2026-03-11historical
-
2026-02-17$185,000 Active
-
2026-02-16historical
-
2026-01-27price $185,000
-
2025-12-24$194,500 Active
-
2025-11-13soldstatus $90,000
-
2018-09-14soldstatus $69,900
-
2018-08-30soldstatus $69,900 Closed
-
2018-08-18status Pending
-
2018-07-18historical Active Under Contract
-
2018-05-21status Active
-
2018-05-18status Active
-
2018-05-18historical
-
2018-05-04historical Active Under Contract
-
2018-05-04status Active
-
2018-05-04historical Active Under Contract
-
2018-04-26$69,900 Active
-
2018-04-17historical
-
2017-10-27price $72,000
-
2017-04-21$74,000 Active
-
2006-09-20soldstatus $100,000
-
1990-09-21soldstatus $33,000
ⓘ Source: listings_history table (triggers on properties + properties_extension) + one-shot
backfill from property_details.listing_events for pre-trigger history.
Tax reassessment forecast FL · Resets to sale price
- Current annual tax
- $547 · $46/mo
- Projected year-2 tax
- $1,327 · $111/mo
- Expected delta
- +$780/yr (+$65/mo · 142.5%)
ⓘ Screening estimate from a state-policy table — verify with the county assessor before closing.
Climate risk First Street
- Flood 1/10 Low FEMA zone X (unshaded) · 0% chance over 30 yrs
- Wildfire 1/10 Low
- Heat 10/10 Extreme 7 d/yr ≥106°F today · 28 d/yr by 30 yrs out
- Wind 10/10 Extreme 99% chance of damaging wind over 30 yrs
- Air quality 2/10 Low 1 unhealthy d/yr today · 2 by 30 yrs out
Nearby sold comps map
Loading sold comps map…
Walkable amenities ~0.75 mi
Loading nearby amenities…
Taxation est. · year 1
- Rental income
- $26,509
- − Mortgage interest
- −$8,957
- − Property taxes
- −$547
- − Insurance
- −$800
- − Repairs & maintenance
- −$2,121
- − Management
- −$2,121
- − HOA
- −$5,952
- − Depreciation
- −$4,652
- Taxable income
- $1,360
- Est. tax owed @ 24.0%
- −$326
- After-tax cash flow
- $3,254/yr
For passive investors: Depreciation is non-cash, so a rental often shows a tax loss while cash-flowing — sheltering income. Rental losses are passive: they offset passive income freely, and up to $25,000/yr can offset ordinary (W-2) income if you actively participate and your MAGI is under $100k (phasing out to $0 by $150k); unused losses carry forward. On sale, claimed depreciation is recaptured at up to 25%, and gains may owe capital-gains tax (a 1031 exchange can defer both). Figures are a year-1 estimate at your 24.0% rate — not tax advice; consult a CPA.
Schools (NCES district)
- District
- Palm Beach
- NCES district ID
- 1201500
- Math proficiency
- 46% ▼ -16.00%
- Reading proficiency
- 53% ▼ -4.00%
- Median HH income
- $53,943
- Composite
- 42.72/100
- National rank
- #3160
- State rank
- #34 of 73 in FL
Livability — Delray Beach
- Score
- 77/100
- State rank
- #202
- US rank
- #3160
Category grades
Schools grade is shown separately in the Schools card above.
Census & demographics
- Census place
- Delray Beach, FL
- County
- Palm Beach County · 1,438,312 people
- City population
- 123,167
- Metro
- Miami-Fort Lauderdale-Pompano Beach, FL
- Population (ZIP)
- 33,122
- Household income
- $78,163
- Rent vs Own
- Severe rent burden
- 1649.0
Population outlook (Palm Beach County) Hauer SSP2
- Today (2025)
- 1,637,487 people
- By 2030
- 1,743,255 · +6.5%
- By 2040
- 1,948,712 · +19.0%
- By 2050
- 2,132,979 · +30.3%
- By 2075
- 2,530,027 · +54.5%
- By 2100
- 2,706,979 · +65.3%
Race, ethnicity, and origin ACS 2023
- Neighborhood character
- Diverse neighborhood (Simpson 0.62)
- Race & ethnicity
- White 55% Black 24% Hispanic / Latino 11% Two or more races 11% Asian 4%
- Hispanic origin (detail)
- Puerto Rican 3% Cuban 2%
- Common ancestry
- Hispanic 14% Romanian 3% Scotch-Irish 3%
- Foreign-born
- 27% · Canada, Jamaica, Dominican Republic
- Languages at home
- 66% English-only · French/Haitian/Cajun 18% Spanish 9% Other Indo-European 4%
Political lean MEDSL · Palm Beach
- 2024 margin
- Toss-up / Even · D 50.0% · R 49.2%
- 2008→2024 swing
- -22.1pp toward R · 2008: 22.9pp · 2024: 0.8pp
- All cycles
- 2024: D+0.8 2020: D+12.8 2016: D+15.3 2012: D+17.0 2008: D+22.9
Not yet ingested
- Civics
- —
Market trends
- HPI YoY
- ▼ -258.16%
- Current HPI
- 349.5505
- Rent YoY
- ▲ 1.83%
- Metro
- Miami-Fort Lauderdale-Pompano Beach, FL
- State GDP YoY
- ▲ 3.28%
- F500 in state
- 36
Industry mix (Fortune 500 HQ in FL)
| Industry | F500 HQs | Revenue |
|---|---|---|
| Industrial Technology | 2 | $29B |
|
||
| Insurance | 2 | $17B |
|
||
| Retail | 1 | $60B |
|
||
| Technology Distribution | 1 | $58B |
|
||
| Homebuilding | 1 | $35B |
|
||
| Technology Manufacturing | 1 | $35B |
|
||
Price history
+414.8% since first listed23 events — show timeline
- 2026-04-28 Listed $169,900 Beaches MLS
- 2026-03-11 Listing Removed — Beaches MLS
- 2026-02-17 Listed $185,000 Beaches MLS
- 2026-02-16 Listing Removed — Beaches MLS
- 2026-01-27 Price Changed $185,000 Beaches MLS
- 2025-12-24 Listed $194,500 Beaches MLS
- 2025-11-13 Sold (Public Records) $90,000 Public Records
- 2018-09-14 Sold (Public Records) $69,900 Public Records
- 2018-08-30 Sold (MLS) $69,900 Beaches MLS
- 2018-08-18 Pending — Beaches MLS
- 2018-07-18 Contingent — Beaches MLS
- 2018-05-21 Relisted — Beaches MLS
- 2018-05-18 Relisted — Beaches MLS
- 2018-05-18 Listing Removed — Beaches MLS
- 2018-05-04 Contingent — Beaches MLS
- 2018-05-04 Relisted — Beaches MLS
- 2018-05-04 Contingent — Beaches MLS
- 2018-04-26 Listed $69,900 Beaches MLS
- 2018-04-17 Listing Removed — Beaches MLS
- 2017-10-27 Price Changed $72,000 Beaches MLS
- 2017-04-21 Listed $74,000 Beaches MLS
- 2006-09-20 Sold (Public Records) $100,000 Public Records
- 1990-09-21 Sold (Public Records) $33,000 Public Records
Property tax history
+8.2%/yrLatest (2025): $547 · -19.1% YoY. Source: county tax records.
Cash-flow waterfall
monthlySold comps — $/sqft
last 12 mo · ≤1 miLoading sold comps…