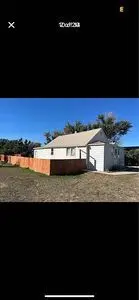
209 1st St W · Richey, MT
Flood risk 1/10 · Minimal
- FEMA flood zone
- —
- Chance of flooding over 30 yrs
- 0.0%
- Est. flood insurance / yr
- —
Fire risk 3/10 · Minor
- Est. fire insurance / yr
- $918 – $1,706
Heat risk 2/10 · Minimal
- Hot days now (above 96°F)
- 7 days/yr
- Hot days in 30 yrs
- 13 days/yr
Wind risk 2/10 · Minimal
- Chance of severe wind over 30 yrs
- —
Air-quality risk 3/10 · Minor
- Unhealthy air days now
- 2 days/yr
- Unhealthy air days in 30 yrs
- 2 days/yr
Risk factors via First Street. Map © Google.
Why this score? — see what drove the C- grade
The composite is a weighted blend of 9 inputs, each scored 0–100. Each bar is that input's sub-score; the figure is the points it added to the 100-point composite (weight × sub-score).
- Cash flow +18.5/30.0
- ARV discount +7.5/15.0
- Appreciation +6.3/10.0
- DSCR +5.8/10.0
- 1% rule +4.9/10.0
- Schools +3.7/10.0
- Livability +3.6/5.0
- Rent growth +2.5/5.0
- Condition / age +1.0/5.0
$125,000
🖨 Deal sheet 📄 Offer letter ✓ Due diligence
Key facts
- Freezer pantry room
- Large dining room
- Large kitchen
Tags
Neighborhood map
What this means for you Summary
Snapshot
- This is a 3-bed/2.0-bath other listed at $125k. Condition is rated poor.
Deal economics
- At list price, monthly cash flow is $118 ($1k/yr) — positive.
- The deal already cash-flows at list — no discount required.
- To meet the 1% rule (rent ≥ 1% of price), the offer needs to be $124k (0.5% below list).
- Recommended offer: $123k (1.5% below list) — sets the bar for market timing.
Location & tenants
- Location reads 71/100 on livability (#64 in MT) — a middle-class / working-renter tenant base. Strengths: cost of living A+, housing A+, schools A-; Watch: health & safety D, crime D-, amenities F.
- Richey Elementary (rural): math 21% / reading 60% proficiency, ranked #135 of 339 in MT (top 40%) — families likely to look elsewhere, expect single-tenant / working-renter base with shorter leases.
- Market conditions: 1 active listings in the ZIP.
Forward outlook
- In year one you build about $4k of equity ($864 loan paydown + $3k appreciation (2.7% local appreciation)).
- Dawson County population projected at +40% by 2050 — long-run rental-demand tailwind backs the buy-and-hold thesis.
- At projected returns (2.7% appreciation + 3.0% rent growth), your $35k cash investment doubles in ~6 years — after that, you're playing with house money.
- By year 8, paydown + projected appreciation supports a ~$31k cash-out refi (75% LTV) — recoverable capital for the next deal without selling this one.
Negotiation context
- It's been on market 23 days — a 2% lower offer ($123k) is reasonable based on typical stale-listing flexibility.
Risks & watch-outs
- Watch-outs: built in 1929 — expect roof / HVAC / electrical / plumbing capex.
Questions for the listing agent
- Have any recent inspections been done? Can we get a copy of the seller's disclosures and any deferred-maintenance estimates?
- Built in 1929 — when were the roof, HVAC, electrical panel, plumbing, and water heater last replaced?
- Is there a deadline driving the sale (1031 exchange, divorce, estate, relocation)? That informs how much negotiation room exists.
- Schools are A-rated — typically a magnet for longer-tenancy family renters. What's the average tenant stay here, and is there a school-zone premium baked into asking?
- Crime grade is D in this area — have there been break-ins, vandalism, or insurance claims at this property in the last 3 years? What carrier currently insures it and at what premium?
- What's the average days-on-market for RENTAL listings here right now (not sales)? A rising rental-DOM trend means longer vacancies and softer asking-rent achievability than the comps imply.
- What's the recent tenant-quality profile in this submarket — average credit score on applications, eviction rate, late-payment / NSF rate, and stable-employment percentage? A property-management company in the area should have these aggregated.
- How much new for-sale + rental construction is in the pipeline within 1–3 miles? Heavy new supply typically softens prices + rents 12–24 months out; constrained supply supports both.
Investment metrics
- 1% rule
- 0.99% ✗
- Cap rate
- 7.43%
- Cash-on-cash
- 4.05%
- DSCR
- 1.18
- GRM
- 8.4
CMA / ARV
No comps found within radius.
Projected returns pro-forma
2.66% appreciation · 3.0% rent growth · sell at horizon
- IRR
- 10.4%
- Equity multiple
- 1.58×
- Total profit
- $20,398
- Equity at exit
- $53,854
- IRR
- 12.9%
- Equity multiple
- 2.85×
- Total profit
- $64,891
- Equity at exit
- $81,213
Cash invested: $35,000 (down + closing). Projections, not guarantees.
Landlord ↔ Tenant lean methodology
- Overall (STATE)
- 82 Strongly Landlord-Friendly
- State Montana
- 82 Strongly Landlord-Friendly · R+11
- County
- — inherits STATE
- City
- — inherits STATE
ZIP-level market 59259
- Home prices YoY
- 1.4%
- Active inventory
- 1
- Price-to-rent
- 8.4×
Monthly cashflow live
- Estimated rent
- $1,243 medium interval (Pro) →
- Mortgage (P&I)
- −$656
- Tax est. 1.5%
- −$156 /mo · $1,875/yr
- Insurance
- −$52
- HOA
- −$0
- Vacancy / Maint / Mgmt
- −$261
- Net cashflow
- $118
Break-even live
UW: 25.0% down · 7.5% · 30yr · 1.5% tax · 5.0% vac · 8.0% maint · 8.0% mgmt
Financing live
Cash to close
- Down payment
- $31,250
- Closing costs
- $3,750
- Reserves months
- —
- Total cash needed
- —
Loan-product check · same deal, 3 products live
Conventional
25% down · 7.5% · 30yr
- Down + closing
- —
- Monthly P&I
- —
- Monthly cashflow
- —
- DSCR
- —
- Eligible?
- —
Personal DTI + credit; lowest rate.
DSCR
20% down · 8.5% · 30yr
- Down + closing
- —
- Monthly P&I
- —
- Monthly cashflow
- —
- DSCR
- —
- Eligible?
- —
No personal income docs; deal must DSCR.
Hard money
10% down · 12.0% · 12mo
- Down + closing
- —
- Monthly P&I
- —
- Monthly cashflow
- —
- DSCR
- —
- Eligible?
- —
Short-term bridge; refi at stabilization.
Listing history 15 events
-
2026-06-18days on market $125,000 Active 23 DOM
-
2026-06-17days on market $125,000 Active 22 DOM
-
2026-06-16days on market $125,000 Active 21 DOM
-
2026-06-15days on market $125,000 Active 20 DOM
-
2026-06-13days on market $125,000 Active 18 DOM
-
2026-06-12days on market $125,000 Active 17 DOM
-
2026-06-09days on market $125,000 Active 14 DOM
-
2026-06-08days on market $125,000 Active 13 DOM
-
2026-06-07days on market $125,000 Active 12 DOM
-
2026-06-05days on market $125,000 Active 10 DOM
-
2026-06-04days on market $125,000 Active 8 DOM
-
2026-06-02days on market $125,000 Active 7 DOM
-
2026-06-01days on market $125,000 Active 6 DOM
-
2026-05-31days on market $125,000 Active 5 DOM
-
2026-05-26$125,000 Active
ⓘ Source: listings_history table (triggers on properties + properties_extension) + one-shot
backfill from property_details.listing_events for pre-trigger history.
Climate risk First Street
- Flood 1/10 Low 0% chance over 30 yrs
- Wildfire 3/10 Moderate
- Heat 2/10 Low 7 d/yr ≥96°F today · 13 d/yr by 30 yrs out
- Wind 2/10 Low
- Air quality 3/10 Moderate 2 unhealthy d/yr today · 2 by 30 yrs out
Nearby sold comps map
Loading sold comps map…
Walkable amenities ~0.75 mi
Loading nearby amenities…
Taxation est. · year 1
- Rental income
- $14,918
- − Mortgage interest
- −$7,002
- − Property taxes
- −$1,875
- − Insurance
- −$625
- − Repairs & maintenance
- −$1,193
- − Management
- −$1,193
- − Depreciation
- −$3,636
- Taxable loss
- −$607
- Est. tax savings @ 24.0%
- +$146
- After-tax cash flow
- $1,565/yr
For passive investors: Depreciation is non-cash, so a rental often shows a tax loss while cash-flowing — sheltering income. Rental losses are passive: they offset passive income freely, and up to $25,000/yr can offset ordinary (W-2) income if you actively participate and your MAGI is under $100k (phasing out to $0 by $150k); unused losses carry forward. On sale, claimed depreciation is recaptured at up to 25%, and gains may owe capital-gains tax (a 1031 exchange can defer both). Figures are a year-1 estimate at your 24.0% rate — not tax advice; consult a CPA.
Condition & rehab AI · 2 photos
This property requires extensive repairs and maintenance, including a new roof, exterior painting, and landscaping. Significant improvements would be needed to increase its resale or rental value.
Repairs flagged
- Major roof — Signs of potential leaks and wear.
- Major exterior siding — Peeling paint and siding indicate significant damage.
- Major interior walls/paint — The exterior condition suggests the interior may also be in poor condition.
- Major landscaping — Overgrown and in need of trimming and maintenance.
Value-add opportunities
- Both roof replacement — A new roof would significantly improve the home's appearance and functionality.
- Both exterior painting — New paint would improve the home's curb appeal and potentially increase its value.
- Both landscaping — A well-maintained yard would enhance the home's appeal and potentially increase its value.
- Both interior painting and repairs — A fresh coat of paint and repairs to interior walls would improve the home's condition and value.
Renovation cost estimate screening
| Repair item | Severity | Est. cost |
|---|---|---|
| roof · Signs of potential leaks and wear. | Major | $15,000–50,000 |
| exterior siding · Peeling paint and siding indicate significant damage. | Major | $15,000–50,000 |
| interior walls/paint · The exterior condition suggests the interior may also be in poor condition. | Major | $15,000–50,000 |
| landscaping · Overgrown and in need of trimming and maintenance. | Major | $15,000–50,000 |
| Total estimated repair cost · 4 items | $60,000–200,000 |
Value-add ROI direction
- Both roof replacement — A new roof would significantly improve the home's appearance and functionality. ↑
- Both exterior painting — New paint would improve the home's curb appeal and potentially increase its value. ↑
- Both landscaping — A well-maintained yard would enhance the home's appeal and potentially increase its value. ↑
- Both interior painting and repairs — A fresh coat of paint and repairs to interior walls would improve the home's condition and value. ↑
ⓘ Cost ranges are severity-bucket heuristics (US national rule-of-thumb). Get contractor quotes + a written scope before underwriting a rehab budget.
Schools (NCES district)
- District
- Richey Elementary
- NCES district ID
- 3022370
- Math proficiency
- 21% ▲ 21.00%
- Reading proficiency
- 60% ▬ 0.00%
- Median HH income
- $50,001
- Composite
- 37.24/100
- National rank
- #8980
- State rank
- #135 of 339 in MT
Livability — Richey
- Score
- 71/100
- State rank
- #64
- US rank
- #6754
Category grades
Schools grade is shown separately in the Schools card above.
Census & demographics
- Census place
- Richey, MT
- Population (ZIP)
- 324
Population outlook (Dawson County) Hauer SSP2
- Today (2025)
- 11,008 people
- By 2030
- 11,795 · +7.1%
- By 2040
- 13,471 · +22.4%
- By 2050
- 15,363 · +39.6%
- By 2075
- 20,473 · +86.0%
- By 2100
- 23,528 · +113.7%
Race, ethnicity, and origin ACS 2023
- Neighborhood character
- Predominantly White (90%)
- Race & ethnicity
- White 90% Two or more races 8% Hispanic / Latino 1%
- Common ancestry
- Portuguese 17% Italian 2% Lithuanian 2%
- Foreign-born
- 3% · Canada, China
- Languages at home
- 97% English-only · German/W. Germanic 1% Tagalog/Filipino 1%
Political lean MEDSL · Dawson
- 2024 margin
- Solid R (+58.9) · D 19.3% · R 78.2% · Other 2.5%
- 2008→2024 swing
- -35.3pp toward R · 2008: -23.6pp · 2024: -58.9pp
- All cycles
- 2024: R+58.9 2020: R+57.8 2016: R+58.5 2012: R+40.9 2008: R+23.6
Not yet ingested
- Civics
- —
Market trends
- HPI YoY
- ▲ 2.66%
- Current HPI
- 188.0282
- Rent YoY
- —
- Metro
- —
- State GDP YoY
- ▲ 3.41%
- F500 in state
- 2
Industry mix (Fortune 500 HQ in MT)
| Industry | F500 HQs | Revenue |
|---|---|---|
| Technology / Analytics | 1 | $2B |
|
||
Price history
1 event — show timeline
- 2026-05-26 Listed $125,000 FSBO.com
Cash-flow waterfall
monthlySold comps — $/sqft
last 12 mo · ≤1 miLoading sold comps…