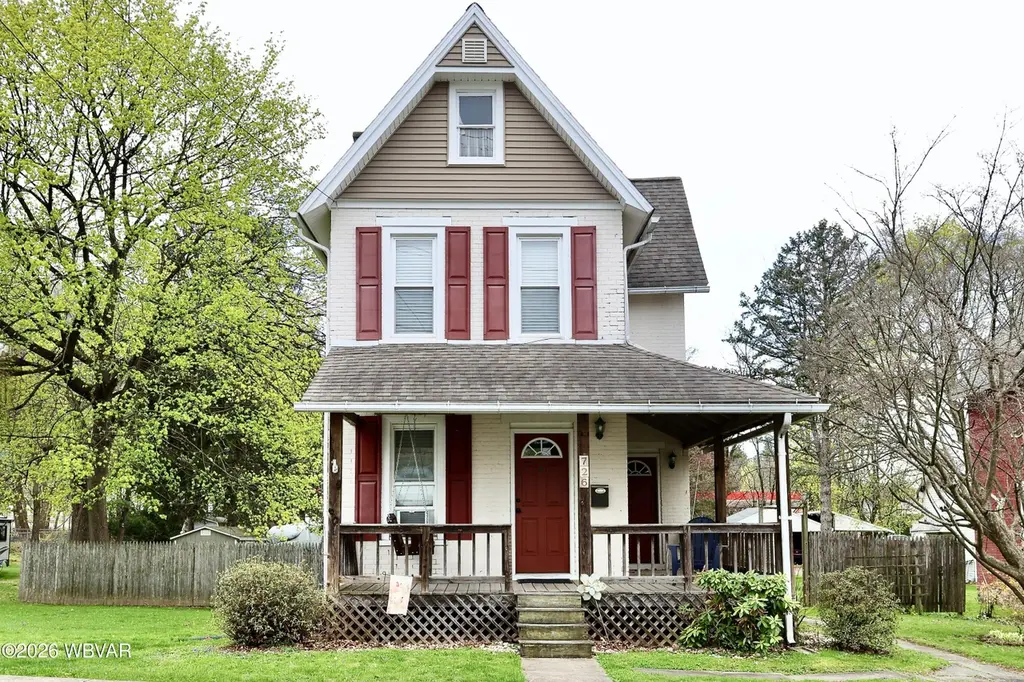
726 Main St · South Williamsport, PA
Flood risk 8/10 · Major
- FEMA flood zone
- X (unshaded)
- Chance of flooding over 30 yrs
- 0.99%
- Est. flood insurance / yr
- $473 – $860
Fire risk 3/10 · Minor
- Est. fire insurance / yr
- $511 – $949
Heat risk 4/10 · Minor
- Hot days now (above 93°F)
- 7 days/yr
- Hot days in 30 yrs
- 15 days/yr
Wind risk 2/10 · Minimal
- Chance of severe wind over 30 yrs
- 1.0%
Air-quality risk 2/10 · Minimal
- Unhealthy air days now
- 0 days/yr
- Unhealthy air days in 30 yrs
- 1 days/yr
Risk factors via First Street. Map © Google.
Why this score? — see what drove the D+ grade
The composite is a weighted blend of 9 inputs, each scored 0–100. Each bar is that input's sub-score; the figure is the points it added to the 100-point composite (weight × sub-score).
- Cash flow +19.2/30.0
- DSCR +6.0/10.0
- ARV discount +5.0/15.0
- 1% rule +4.9/10.0
- Livability +4.3/5.0
- Schools +3.5/10.0
- Rent growth +2.5/5.0
- Condition / age +2.5/5.0
- Appreciation +0.0/10.0
$200,000
🖨 Deal sheet (PDF) 📄 Offer letter ✓ Due diligence
Listing remarks MLS
If you are looking for an affordable home in South Williamsport - come and check this one out! Laundry and 3/4 bathroom on the first floor for convenience. Three bedrooms and a full bath on the second floor. Large lot almost half an acre! Nice covered porch to hang out on. Schedule your showing today!
Key facts
- Covered porch
- Large lot
- 0.57 acre lot
Tags
Neighborhood map
What this means for you Summary
Snapshot
- This is a 3-bed/1.0-bath single-family listed at $200k.
Deal economics
- At list price, monthly cash flow is $159 ($2k/yr) — positive.
- The deal already cash-flows at list — no discount required.
- To meet the 1% rule (rent ≥ 1% of price), the offer needs to be $198k (1.2% below list).
- Recommended offer: $188k (6.0% below list) — sets the bar for market timing.
- Cap rate 7.6% vs local median 4.9% in South Williamsport — top-decile yield for the area; either an underpriced asset or a hidden risk that comps aren't pricing in. Stress-test before assuming the spread holds.
Location & tenants
- Location reads 86/100 on livability (#58 in PA, #400 nationally) — a professional / high-income tenant draw. Strengths: crime A+, commute A+, cost of living A+; Watch: amenities F.
- South Williamsport Area SD (suburban): math 29% / reading 52% proficiency, ranked #350 of 539 in PA (top 65%) — families likely to look elsewhere, expect single-tenant / working-renter base with shorter leases.
- Zoned schools: Central El Sch (math 27% / reading 52%, grade F, #947 of 1,518 statewide, top 65%, 440 students, 51% FRL); Rommelt El Sch (math 27% / reading 52%, grade F, #268 of 512 statewide, top 53%, 177 students, 58% FRL); South Williamsport Area Jshs (math 31% / reading 52%, grade F, #249 of 437 statewide, top 57%, 503 students, 44% FRL) — zoned schools average 51% FRL vs 30% district-wide (21 pts higher); higher-poverty schools than district average — tighter screening recommended.
- Market conditions: 35 active listings in the ZIP; 2 comparable units currently listed for rent nearby; 73 units permitted in Lycoming County in 2024 (15 in 5+ unit buildings).
Forward outlook
- Local home prices are declining (-3.0%/yr); year-one equity from $1k of loan paydown is wiped out by about $6k of value loss. Plan a longer hold.
- Lycoming County population projected to shrink 10% by 2050 — rents likely to lag national; underwrite the cash flow, not the appreciation.
Negotiation context
- It's been on market 65 days — a 6% lower offer ($188k) is reasonable based on typical stale-listing flexibility.
- 3 sale attempts since 11y ago with the ask held roughly flat each time — persistent listings suggest the price (not the market) is what's stuck; bring a comps-based counter.
Risks & watch-outs
- Watch-outs: flood insurance adds $56/mo; built in 1901 — expect roof / HVAC / electrical / plumbing capex.
- Climate carrying-cost: severe flood risk — expect insurance premiums to compound above CPI over the hold.
Questions for the listing agent
- It's been on market 65 days. Have you received any prior offers? Is the seller open to a 6% concession, seller financing, or rate buy-down credit?
- Built in 1901 — when were the roof, HVAC, electrical panel, plumbing, and water heater last replaced?
- What's the actual annual flood-insurance premium (NFIP or private), and is the property in a SFHA with mandatory coverage?
- Why hasn't it sold? Are there any deal-killer items the seller is aware of (foundation, flood, title, zoning, code violations)?
- Is there a deadline driving the sale (1031 exchange, divorce, estate, relocation)? That informs how much negotiation room exists.
- Schools are B-rated — typically a magnet for longer-tenancy family renters. What's the average tenant stay here, and is there a school-zone premium baked into asking?
- The area grade is low — what's the realistic commute time and amenity access for the typical tenant pool here? Any planned neighborhood developments (good or bad) we should know about?
- What's the average days-on-market for RENTAL listings here right now (not sales)? A rising rental-DOM trend means longer vacancies and softer asking-rent achievability than the comps imply.
- What's the recent tenant-quality profile in this submarket — average credit score on applications, eviction rate, late-payment / NSF rate, and stable-employment percentage? A property-management company in the area should have these aggregated.
- How much new for-sale + rental construction is in the pipeline within 1–3 miles? Heavy new supply typically softens prices + rents 12–24 months out; constrained supply supports both.
Investment metrics
- 1% rule
- 0.99% ✗
- Cap rate
- 7.58%
- Cash-on-cash
- 4.59%
- DSCR
- 1.20
- GRM
- 8.4
CMA / ARV
- ARV (median comp)
- $189,388
- List price
- $200,000
- Delta
- 5.60%
- Verdict
- FAIR
- Comps
- 20 within 1.0 mi
Show comp detail 12 sales within ~0.75 mi
| Address | Dist | Beds/Ba | Sqft | Sold | Price | $/sf | Match |
|---|---|---|---|---|---|---|---|
| 349 Bastian Ave | 0.17mi | 3/1.0 | 1,475 (-7%) | 5mo | $197,000 | $134 | 76 |
| 513 Fairmont Ave | 0.28mi | 3/2.0 | 1,540 (-3%) | 3mo | $265,000 | $172 | 75 |
| 834 Main St | 0.08mi | 3/1.0 | 1,504 (-6%) | 19mo | $121,617 | $81 | 71 |
| 377 Main St | 0.33mi | 3/2.0 | 1,510 (-5%) | 9mo | $220,000 | $146 | 65 |
| 204 W Central Ave | 0.43mi | 3/1.5 | 1,697 (+7%) | 5mo | $185,000 | $109 | 62 |
| 231 Curtin St | 0.58mi | 3/1.0 | 1,468 (-8%) | 4mo | $169,900 | $116 | 57 |
| 534 Childs Dr | 0.37mi | 3/2.0 | 1,420 (-11%) | 13mo | $300,000 | $211 | 50 |
| 492 Winthrop St | 0.67mi | 3/1.5 | 1,508 (-5%) | 15mo | $239,000 | $158 | 46 |
| 415 W Central Ave | 0.52mi | 2/1.5 (-1) | 1,410 (-11%) | 14mo | $211,325 | $150 | 38 |
| 337 Winthrop St | 0.72mi | 3/2.0 | 1,500 (-6%) | 17mo | $140,000 | $93 | 38 |
| 352 Bayard St | 0.68mi | 3/2.0 | 1,824 (+15%) | 10mo | $255,000 | $140 | 31 |
| 346 W Southern Ave | 0.61mi | 3/2.5 | 1,445 (-9%) | 23mo | $230,000 | $159 | 31 |
Match score weights: distance 35% · size 25% · config 20% · recency 20%. Top-matched comps best support the ARV.
Projected returns pro-forma
-3.0% appreciation · 3.0% rent growth · sell at horizon
- IRR
- -10.9%
- Equity multiple
- 0.60×
- Total profit
- $-22,256
- Equity at exit
- $29,821
- IRR
- -1.6%
- Equity multiple
- 0.89×
- Total profit
- $-6,189
- Equity at exit
- $17,292
Cash invested: $56,000 (down + closing). Projections, not guarantees.
Landlord ↔ Tenant lean methodology
- Overall (STATE)
- 62 Landlord-Friendly
- State Pennsylvania
- 62 Landlord-Friendly · EVEN
- County
- — inherits STATE
- City
- — inherits STATE
ZIP-level market 17702
- Active inventory
- 35
- Price-to-rent
- 8.4×
Monthly cashflow live
- Estimated rent
- $1,977 medium interval (Pro) →
- Mortgage (P&I)
- −$1,049
- Tax from tax record
- −$215 /mo · $2,584/yr
- Insurance
- −$83
- Flood insurance flood zone
- −$56 /mo · $666/yr
- HOA
- −$0
- Vacancy / Maint / Mgmt
- −$415
- Net cashflow
- $159
Break-even live
Sensitivity live
| Price | -10% $272 | -5% $215 | +0% $159 | +5% $102 | +10% $46 |
|---|---|---|---|---|---|
| Rent | -10% $3 | -5% $81 | +0% $159 | +5% $237 | +10% $315 |
| Rate | -1.0pp $259 | -0.5pp $210 | base $159 | +0.5pp $107 | +1.0pp $54 |
UW: 25.0% down · 7.5% · 30yr · 1.5% tax · 5.0% vac · 8.0% maint · 8.0% mgmt
Financing live
Cash to close
- Down payment
- $50,000
- Closing costs
- $6,000
- Reserves months
- —
- Total cash needed
- —
Loan-product check · same deal, 3 products live
Conventional
25% down · 7.5% · 30yr
- Down + closing
- —
- Monthly P&I
- —
- Monthly cashflow
- —
- DSCR
- —
- Eligible?
- —
Personal DTI + credit; lowest rate.
DSCR
20% down · 8.5% · 30yr
- Down + closing
- —
- Monthly P&I
- —
- Monthly cashflow
- —
- DSCR
- —
- Eligible?
- —
No personal income docs; deal must DSCR.
Hard money
10% down · 12.0% · 12mo
- Down + closing
- —
- Monthly P&I
- —
- Monthly cashflow
- —
- DSCR
- —
- Eligible?
- —
Short-term bridge; refi at stabilization.
Rent comps 2 comps
| Address | Beds | Baths | Sqft | Rent | $/sqft | DOM | Units | Dist |
|---|---|---|---|---|---|---|---|---|
| 948 Main St South Williamsport, PA | 1.0–3.0 | 1.0–2.0 | 894 | $1,780 | $1.99 | 16d | 4 | 0.28mi |
| 215 E 3rd St Unit 3D Williamsport, PA | 2.0 | 1.0 | 1300 | $2,500 | $1.92 | 45d | 1 | 1.09mi |
Listing history 23 events
-
2026-06-21days on market $200,000 Active 65 DOM
-
2026-06-19days on market $200,000 Active 63 DOM
-
2026-06-18days on market $200,000 Active 62 DOM
-
2026-06-17days on market $200,000 Active 61 DOM
-
2026-06-16days on market $200,000 Active 60 DOM
-
2026-06-15days on market $200,000 Active 59 DOM
-
2026-06-14days on market $200,000 Active 57 DOM
-
2026-06-12days on market $200,000 Active 56 DOM
-
2026-06-09days on market $200,000 Active 53 DOM
-
2026-06-08days on market $200,000 Active 52 DOM
-
2026-06-07days on market $200,000 Active 51 DOM
-
2026-06-03days on market $200,000 Active 47 DOM
-
2026-06-02days on market $200,000 Active 46 DOM
-
2026-06-01days on market $200,000 Active 45 DOM
-
2026-05-31days on market $200,000 Active 44 DOM
-
2026-05-30days on market $200,000 Active 43 DOM
-
2026-04-15$200,000 Active 304-char remark
Show marketing remark (304 chars)
If you are looking for an affordable home in South Williamsport - come and check this one out! Laundry and 3/4 bathroom on the first floor for convenience. Three bedrooms and a full bath on the second floor. Large lot almost half an acre! Nice covered porch to hang out on. Schedule your showing today!
-
2022-03-23soldstatus $175,000
-
2022-03-04soldstatus 427-char remark
Show marketing remark (427 chars)
Don't miss your opportunity to take advantage of buyers cold feet! You will fall in love with this move in ready, South Williamsport home. This adorable updated brick home features spacious bedrooms, updated bathrooms, replacement windows and a newer roof! Relax and enjoy the seasons from the wrap around porch, rear deck or large backyard, perfect for yard games and entertaining year round. Plus a $1000 flooring credit!
-
2021-09-09$175,000 427-char remark
Show marketing remark (427 chars)
Don't miss your opportunity to take advantage of buyers cold feet! You will fall in love with this move in ready, South Williamsport home. This adorable updated brick home features spacious bedrooms, updated bathrooms, replacement windows and a newer roof! Relax and enjoy the seasons from the wrap around porch, rear deck or large backyard, perfect for yard games and entertaining year round. Plus a $1000 flooring credit!
-
2015-09-08soldstatus $139,900
-
2015-09-04soldstatus
-
2015-07-02$139,900
ⓘ Source: listings_history table (triggers on properties + properties_extension) + one-shot
backfill from property_details.listing_events for pre-trigger history.
Tax reassessment forecast PA · Partial reset (capped growth)
- Current annual tax
- $2,584 · $215/mo
- Projected year-2 tax
- $2,872 · $239/mo
- Expected delta
- +$288/yr (+$24/mo · 11.2%)
ⓘ Screening estimate from a state-policy table — verify with the county assessor before closing.
Climate risk First Street
- Flood 8/10 Severe FEMA zone X (unshaded) · 99% chance over 30 yrs
- Wildfire 3/10 Moderate
- Heat 4/10 Moderate 7 d/yr ≥93°F today · 15 d/yr by 30 yrs out
- Wind 2/10 Low 100% chance of damaging wind over 30 yrs
- Air quality 2/10 Low 0 unhealthy d/yr today · 1 by 30 yrs out
Nearby sold comps map
Loading sold comps map…
Walkable amenities ~0.75 mi
Loading nearby amenities…
Taxation est. · year 1
- Rental income
- $23,723
- − Mortgage interest
- −$11,203
- − Property taxes
- −$2,584
- − Insurance
- −$1,666
- − Repairs & maintenance
- −$1,898
- − Management
- −$1,898
- − Depreciation
- −$5,818
- Taxable loss
- −$1,344
- Est. tax savings @ 24.0%
- +$323
- After-tax cash flow
- $2,227/yr
For passive investors: Depreciation is non-cash, so a rental often shows a tax loss while cash-flowing — sheltering income. Rental losses are passive: they offset passive income freely, and up to $25,000/yr can offset ordinary (W-2) income if you actively participate and your MAGI is under $100k (phasing out to $0 by $150k); unused losses carry forward. On sale, claimed depreciation is recaptured at up to 25%, and gains may owe capital-gains tax (a 1031 exchange can defer both). Figures are a year-1 estimate at your 24.0% rate — not tax advice; consult a CPA.
Schools (NCES district)
- District
- South Williamsport Area SD
- NCES district ID
- 4222140
- Math proficiency
- 29% ▼ -13.00%
- Reading proficiency
- 52% ▼ -12.00%
- Median HH income
- $46,740
- Composite
- 34.5/100
- National rank
- #5181
- State rank
- #350 of 539 in PA
Livability — South Williamsport
- Score
- 86/100
- State rank
- #58
- US rank
- #400
Category grades
Schools grade is shown separately in the Schools card above.
Census & demographics
- Census place
- South Williamsport, PA
- Population (ZIP)
- 10,506
Population outlook (Lycoming County) Hauer SSP2
- Today (2025)
- 114,164 people
- By 2030
- 112,221 · -1.7%
- By 2040
- 107,613 · -5.7%
- By 2050
- 102,950 · -9.8%
- By 2075
- 92,987 · -18.5%
- By 2100
- 80,924 · -29.1%
Race, ethnicity, and origin ACS 2023
- Neighborhood character
- Predominantly White (94%)
- Race & ethnicity
- White 94% Two or more races 3% Asian 1% Hispanic / Latino 1% Black 1%
- Common ancestry
- Romanian 4% Lithuanian 3% Iranian 2%
- Foreign-born
- 2% · Canada
- Languages at home
- 98% English-only · German/W. Germanic 1%
Political lean MEDSL · Lycoming
- 2024 margin
- Solid R (+41.5) · D 28.8% · R 70.3%
- 2008→2024 swing
- -17.3pp toward R · 2008: -24.2pp · 2024: -41.5pp
- All cycles
- 2024: R+41.5 2020: R+41.3 2016: R+44.8 2012: R+33.3 2008: R+24.2
Not yet ingested
- Civics
- —
Market trends
- HPI YoY
- ▼ -123.59%
- Current HPI
- 216.0615
- Rent YoY
- —
- Metro
- —
- State GDP YoY
- ▲ 1.68%
- F500 in state
- 34
Industry mix (Fortune 500 HQ in PA)
| Industry | F500 HQs | Revenue |
|---|---|---|
| Healthcare | 2 | $309B |
|
||
| Insurance | 2 | $27B |
|
||
| Telecommunications / Media | 1 | $124B |
|
||
| Industrial Distribution | 1 | $22B |
|
||
| Financial Services | 1 | $20B |
|
||
| Chemicals / Materials | 1 | $18B |
|
||
Price history
+43.0% since first listed7 events — show timeline
- 2026-04-15 Listed $200,000 WBVAR
- 2022-03-23 Sold (Public Records) $175,000 Public Records
- 2022-03-04 Sold (MLS) — WBVAR
- 2021-09-09 Listed $175,000 WBVAR
- 2015-09-08 Sold (Public Records) $139,900 Public Records
- 2015-09-04 Sold (MLS) — WBVAR
- 2015-07-02 Listed $139,900 WBVAR
Property tax history
+2.5%/yrLatest (2026): $2,584 · +2.4% YoY. Source: county tax records.
Cash-flow waterfall
monthlySold comps — $/sqft
last 12 mo · ≤1 miLoading sold comps…