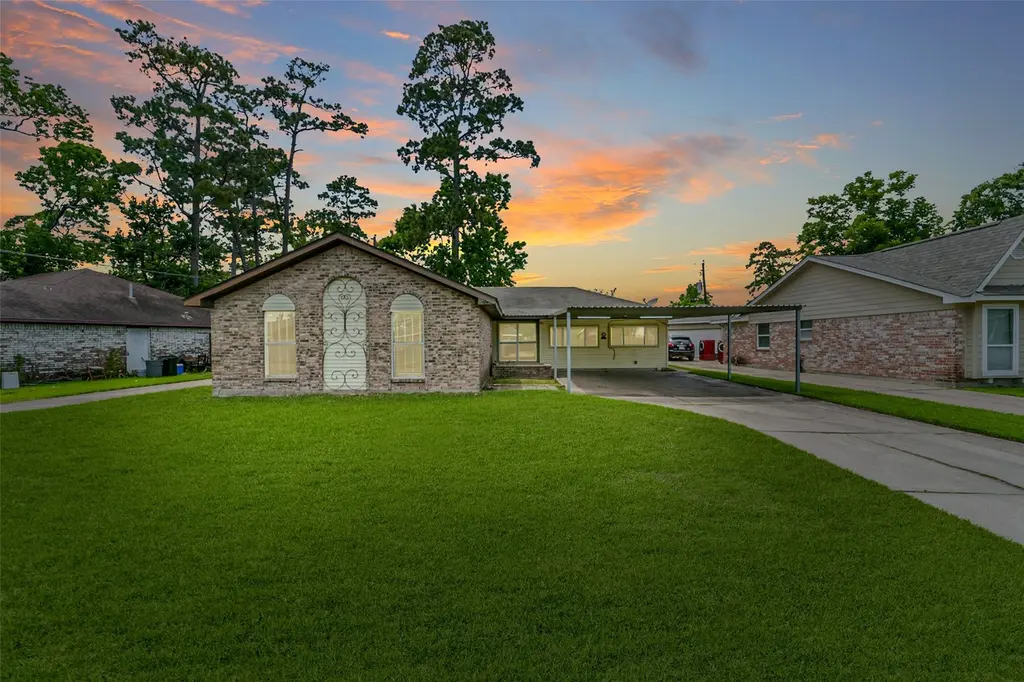
7903 Parkglen Dr · Houston, TX
Flood risk 8/10 · Major
- FEMA flood zone
- X (shaded)
- Chance of flooding over 30 yrs
- 0.99%
- Est. flood insurance / yr
- $507 – $1,088
Fire risk 2/10 · Minimal
- Est. fire insurance / yr
- $1,222 – $2,270
Heat risk 9/10 · Severe
- Hot days now (above 110°F)
- 7 days/yr
- Hot days in 30 yrs
- 25 days/yr
Wind risk 9/10 · Severe
- Chance of severe wind over 30 yrs
- 99.0%
Air-quality risk 2/10 · Minimal
- Unhealthy air days now
- 2 days/yr
- Unhealthy air days in 30 yrs
- 2 days/yr
Risk factors via First Street. Map © Google.
Why this score? — see what drove the C- grade
The composite is a weighted blend of 9 inputs, each scored 0–100. Each bar is that input's sub-score; the figure is the points it added to the 100-point composite (weight × sub-score).
- ARV discount +14.8/15.0
- Cash flow +14.2/30.0
- 1% rule +4.8/10.0
- Appreciation +4.4/10.0
- DSCR +4.3/10.0
- Livability +3.7/5.0
- Condition / age +2.5/5.0
- Schools +2.0/10.0
- Rent growth +1.7/5.0
$220,000
🖨 Deal sheet (PDF) 📄 Offer letter ✓ Due diligence
Listing remarks
Welcome home to this charming 4-bedroom, 2-bathroom property featuring fresh interior paint and beautiful laminate flooring throughout. The kitchen features stylish Silestone countertops, providing ample workspace for cooking and entertaining. A garage conversion provides a spacious den/flex room perfect for a second living area, game room, home office, or media space. Outside, enjoy the covered back patio overlooking the fully fenced backyard, perfect for relaxing or hosting gatherings. The property also features an additional driveway on the side of the home with a convenient drive-thru gate, offering extra parking and easy access for trailers, boats, or recreational vehicles. A storage s
Key facts
- Laminate flooring
- Garage conversion
- Covered back patio
Tags
Property features AI
Finance
- HOA & community: Royalwood HOA with $50 annual fee
Exterior
- Parking: Attached carport; Additional parking; Converted garage; Driveway; 2-space carport
- Security: Smoke detector(s)
- Utilities: Public water; Public sewer
- Home design: Residential property; Full ownership; Slab foundation; Built in 1970; 1,761 total building area; Concrete road surface
- Construction: Brick and wood siding construction; Composition roof
- Exterior features: Covered patio; Patio; Deck; Storage shed(s); Fenced back yard
Interior
- Kitchen: Dishwasher; Free-standing range; Gas oven; Gas range; Microwave; Oven; Disposal
- Bedrooms: Primary bedroom (first floor); Bedroom (first floor) — 11x10; Bedroom (first floor) — 10x10; Bedroom (first floor) — 11x10
- Flooring: Laminate flooring
- Bathrooms: 2 full bathrooms
- Heating & cooling: Central heating (gas); Central air (electric)
- Interior features: Kitchen/family room combo; Kitchen/dining combo; Solid surface counters; Tub/shower; Vaulted ceilings; Window treatments; Ceiling fans
- Laundry & utility: Washer hookup; Electric dryer hookup; Utility room (first floor) — 6x11
Neighborhood map
What this means for you Summary
Snapshot
- This is a 4-bed/2.0-bath single-family listed at $220k.
Deal economics
- At list price, monthly cash flow is $-29 ($-353/yr) — negative.
- To cash-flow at today's rent, offer at most $215k (2.4% below list).
- To meet the 1% rule (rent ≥ 1% of price), the offer needs to be $215k (2.4% below list).
- Recommended offer: $215k (2.4% below list) — sets the bar for 1% rule.
- Cap rate 6.5% vs local median 3.2% in Houston — top-decile yield for the area; either an underpriced asset or a hidden risk that comps aren't pricing in. Stress-test before assuming the spread holds.
Location & tenants
- Location reads 74/100 on livability (#184 in TX, #4,771 nationally) — a middle-class / working-renter tenant base. Strengths: amenities A+, cost of living A+, housing A+; Watch: crime F.
- Sheldon ISD (suburban): math 19% / reading 25% proficiency, ranked #746 of 826 in TX (top 90%) — low school quality limits family demand, transient renter base, plan for 1-2y turnover; 72% free/reduced lunch — lower-income household profile, screen leases tightly.
- Zoned schools: Royalwood El (math 33% / reading 33%, grade F, #2,208 of 4,322 statewide, top 52%, 554 students, 89% FRL); C E King Middle (math 13% / reading 24%, grade F, #1,478 of 1,662 statewide, top 90%, 1,311 students, 90% FRL); C E King H S (math 19% / reading 30%, grade F, #1,264 of 1,632 statewide, top 82%, 3,473 students, 82% FRL) — zoned schools average 87% FRL vs 72% district-wide (15 pts higher); higher-poverty schools than district average — tighter screening recommended.
- Market conditions: Rents falling (-3.3%/yr); 159 active listings in the ZIP; 11 comparable units currently listed for rent nearby; rentals leasing fast (median 4d on market — plan ~1-2 weeks tenant-placement turnaround); 29,883 units permitted in Harris County in 2024 (8,621 in 5+ unit buildings).
- This rent runs 41% of the median local income ($63k/yr) — at the standard rent-burdened threshold; future hikes will face affordability resistance.
Forward outlook
- Local home prices are declining (-1.2%/yr); year-one equity from $2k of loan paydown is wiped out by about $3k of value loss. Plan a longer hold.
- Harris County population projected at +47% by 2050 — long-run rental-demand tailwind backs the buy-and-hold thesis.
Negotiation context
- Only 12 days on market — expect competitive offers; lowballing is unlikely to land.
Risks & watch-outs
- Watch-outs: flood insurance adds $66/mo.
- Climate carrying-cost: severe flood risk; severe wind risk, 99% chance of damaging wind over 30y; extreme-heat days projected 7→25/yr by 2055 (HVAC capex compounding) — expect insurance premiums to compound above CPI over the hold.
Questions for the listing agent
- What do current leases actually rent for vs. the listed asking? Can we see a recent rent roll and the last 12 months of T-12 income?
- Built in 1970 — when were the roof, HVAC, electrical panel, plumbing, and water heater last replaced?
- What's the actual annual flood-insurance premium (NFIP or private), and is the property in a SFHA with mandatory coverage?
- What does the HOA fee cover, when was the last increase, and are there any pending special assessments or reserve-fund shortfalls?
- Is there a deadline driving the sale (1031 exchange, divorce, estate, relocation)? That informs how much negotiation room exists.
- Schools are D-rated, which usually means shorter tenancies and higher turnover. Who's the typical renter profile here, and what's been the actual vacancy rate?
- Crime grade is F in this area — have there been break-ins, vandalism, or insurance claims at this property in the last 3 years? What carrier currently insures it and at what premium?
- What's the average days-on-market for RENTAL listings here right now (not sales)? A rising rental-DOM trend means longer vacancies and softer asking-rent achievability than the comps imply.
- What's the recent tenant-quality profile in this submarket — average credit score on applications, eviction rate, late-payment / NSF rate, and stable-employment percentage? A property-management company in the area should have these aggregated.
- How much new for-sale + rental construction is in the pipeline within 1–3 miles? Heavy new supply typically softens prices + rents 12–24 months out; constrained supply supports both.
Investment metrics
- 1% rule
- 0.98% ✗
- Cap rate
- 6.49%
- Cash-on-cash
- 0.72%
- DSCR
- 1.03
- GRM
- 8.5
CMA / ARV
- ARV (on-the-fly)
- $262,389
- Comps found
- 12
Show comp detail 12 sales within ~0.75 mi
| Address | Dist | Beds/Ba | Sqft | Sold | Price | $/sf | Match |
|---|---|---|---|---|---|---|---|
| 13327 Forest Knoll Dr | 0.12mi | 4/2.5 | 1,747 (-1%) | 9mo | $249,000 | $143 | 83 |
| 13307 Forest Knoll Dr | 0.16mi | 3/2.0 (-1) | 1,591 (-10%) | 9mo | $169,500 | $107 | 64 |
| 13402 Treshill Ct | 0.31mi | 3/2.0 (-1) | 1,586 (-10%) | 0mo | $239,900 | $151 | 64 |
| 13434 Treshill Ct | 0.34mi | 3/2.0 (-1) | 1,586 (-10%) | 0mo | $235,000 | $148 | 63 |
| 13542 Kinsman Rd | 0.44mi | 4/3.0 | 1,919 (+9%) | 1mo | $279,900 | $146 | 60 |
| 13219 Dennis Way Ln | 0.63mi | 3/2.0 (-1) | 1,654 (-6%) | 4mo | $260,000 | $157 | 52 |
| 8511 Doskocil Dr | 0.68mi | 3/2.0 (-1) | 1,654 (-6%) | 2mo | $246,900 | $149 | 52 |
| 13503 Harefield Hollow Trl | 0.54mi | 3/2.0 (-1) | 1,586 (-10%) | 8mo | $249,786 | $157 | 47 |
| 8503 Doskocil Dr | 0.67mi | 3/2.5 (-1) | 1,687 (-4%) | 14mo | $252,000 | $149 | 43 |
| 13518 Wembley Heights Dr | 0.63mi | 4/3.0 | 1,950 (+11%) | 10mo | $279,900 | $144 | 40 |
| 7922 Sheree St | 0.67mi | 3/2.0 (-1) | 1,536 (-13%) | 4mo | $244,900 | $159 | 39 |
| 8555 Chaletford Dr | 0.71mi | 3/2.5 (-1) | 1,687 (-4%) | 18mo | $250,000 | $148 | 38 |
Match score weights: distance 35% · size 25% · config 20% · recency 20%. Top-matched comps best support the ARV.
Projected returns pro-forma
-1.2% appreciation · 0.0% rent growth · sell at horizon
- IRR
- -10.4%
- Equity multiple
- 0.57×
- Total profit
- $-26,595
- Equity at exit
- $50,958
- IRR
- -6.8%
- Equity multiple
- 0.46×
- Total profit
- $-33,397
- Equity at exit
- $51,700
Cash invested: $61,600 (down + closing). Projections, not guarantees.
Landlord ↔ Tenant lean methodology
- Overall (STATE)
- 87 Strongly Landlord-Friendly
- State Texas
- 87 Strongly Landlord-Friendly · R+5
- County
- — inherits STATE
- City
- — inherits STATE
ZIP-level market 77049
- Home prices YoY
- -0.5%
- Rents YoY
- -3.3%
- Active inventory
- 159
- Price-to-rent
- 8.5×
Monthly cashflow live
- Estimated rent
- $2,148 high interval (Pro) →
- Mortgage (P&I)
- −$1,154
- Tax from tax record
- −$410 /mo · $4,925/yr
- Insurance
- −$92
- Flood insurance flood zone
- −$66 /mo · $798/yr
- HOA
- −$4
- Vacancy / Maint / Mgmt
- −$451
- Net cashflow
- $-29
Break-even live
Sensitivity live
| Price | -10% $95 | -5% $33 | +0% $-29 | +5% $-92 | +10% $-154 |
|---|---|---|---|---|---|
| Rent | -10% $-199 | -5% $-114 | +0% $-29 | +5% $55 | +10% $140 |
| Rate | -1.0pp $81 | -0.5pp $26 | base $-29 | +0.5pp $-86 | +1.0pp $-144 |
UW: 25.0% down · 7.5% · 30yr · 1.5% tax · 5.0% vac · 8.0% maint · 8.0% mgmt
Financing live
Cash to close
- Down payment
- $55,000
- Closing costs
- $6,600
- Reserves months
- —
- Total cash needed
- —
Loan-product check · same deal, 3 products live
Conventional
25% down · 7.5% · 30yr
- Down + closing
- —
- Monthly P&I
- —
- Monthly cashflow
- —
- DSCR
- —
- Eligible?
- —
Personal DTI + credit; lowest rate.
DSCR
20% down · 8.5% · 30yr
- Down + closing
- —
- Monthly P&I
- —
- Monthly cashflow
- —
- DSCR
- —
- Eligible?
- —
No personal income docs; deal must DSCR.
Hard money
10% down · 12.0% · 12mo
- Down + closing
- —
- Monthly P&I
- —
- Monthly cashflow
- —
- DSCR
- —
- Eligible?
- —
Short-term bridge; refi at stabilization.
Rent comps 11 comps
| Address | Beds | Baths | Sqft | Rent | $/sqft | DOM | Units | Dist |
|---|---|---|---|---|---|---|---|---|
| 7749 Royalwood Dr Houston, TX | 3.0–4.0 | 2.0–2.5 | 1870 | $2,375 | $1.27 | 0d | 1 | 0.25mi |
| 7100 Uvalde Rd Houston, TX | 1.0–3.0 | 1.0–2.0 | 1066 | $2,229 | $2.09 | 0d | 16 | 0.99mi |
| 7934 Round Rock Dr Houston, TX | 3.0 | 2.0 | 1986 | $2,100 | $1.06 | 45d | 1 | 0.99mi |
| 13150 Cutler Ridge Ln Houston, TX | 4.0 | 2.5 | 2264 | $2,195 | $0.97 | 7d | 1 | 1.12mi |
| 13030 Sandhill Park Ln Houston, TX | 4.0 | 2.0 | 2402 | $2,120 | $0.88 | 3d | 1 | 1.32mi |
| 14718 Black Rail Dr Houston, TX | 4.0 | 3.0 | 2150 | $2,900 | $1.35 | 45d | 1 | 1.35mi |
| 15330 Liberty River Dr Unit 15363 Houston, TX | 3.0 | 2.0 | 1512 | $1,825 | $1.21 | 45d | 1 | 1.40mi |
| 15330 Liberty River Dr Unit 3174 Houston, TX | 3.0 | 2.0 | 1512 | $1,825 | $1.21 | 0d | 1 | 1.40mi |
| 15330 Liberty River Dr Unit 3112 Houston, TX | 3.0 | 2.0 | 1512 | $1,774 | $1.17 | 0d | 1 | 1.40mi |
| 14630 Edenglen Dr Houston, TX | 3.0 | 2.0 | 1231 | $1,500 | $1.22 | 26d | 1 | 1.47mi |
| 14630 Edenglen Dr Houston, TX | 3.0 | 2.0 | 1231 | $1,500 | $1.22 | 0d | 1 | 1.47mi |
HOA detail
- Monthly dues
- $4 · $48/yr
Listing history 8 events
-
2026-06-15days on market $220,000 Pending 12 DOM
-
2026-06-13days on market $220,000 Pending 10 DOM
-
2026-06-09days on market $220,000 Pending 6 DOM
-
2026-06-08days on market $220,000 Pending 5 DOM
-
2026-06-08status $220,000 Pending 4 DOM
-
2026-06-07days on market $220,000 Active 4 DOM
-
2026-06-04remarks 699-char remark
-
2026-06-04$220,000 Active 1 DOM
ⓘ Source: listings_history table (triggers on properties + properties_extension) + one-shot
backfill from property_details.listing_events for pre-trigger history.
Tax reassessment forecast TX · Resets to sale price
- Current annual tax
- $4,925 · $410/mo
- Projected year-2 tax
- $4,925 · $410/mo
- Expected delta
- $0/yr ($0/mo · 0.0%)
ⓘ Screening estimate from a state-policy table — verify with the county assessor before closing.
Climate risk First Street
- Flood 8/10 Severe FEMA zone X (shaded) · 99% chance over 30 yrs
- Wildfire 2/10 Low
- Heat 9/10 Extreme 7 d/yr ≥110°F today · 25 d/yr by 30 yrs out
- Wind 9/10 Extreme 99% chance of damaging wind over 30 yrs
- Air quality 2/10 Low 2 unhealthy d/yr today · 2 by 30 yrs out
Nearby sold comps map
Loading sold comps map…
Walkable amenities ~0.75 mi
Loading nearby amenities…
Taxation est. · year 1
- Rental income
- $25,774
- − Mortgage interest
- −$12,323
- − Property taxes
- −$4,925
- − Insurance
- −$1,898
- − Repairs & maintenance
- −$2,062
- − Management
- −$2,062
- − HOA
- −$48
- − Depreciation
- −$6,400
- Taxable loss
- −$3,944
- Est. tax savings @ 24.0%
- +$947
- After-tax cash flow
- $593/yr
For passive investors: Depreciation is non-cash, so a rental often shows a tax loss while cash-flowing — sheltering income. Rental losses are passive: they offset passive income freely, and up to $25,000/yr can offset ordinary (W-2) income if you actively participate and your MAGI is under $100k (phasing out to $0 by $150k); unused losses carry forward. On sale, claimed depreciation is recaptured at up to 25%, and gains may owe capital-gains tax (a 1031 exchange can defer both). Figures are a year-1 estimate at your 24.0% rate — not tax advice; consult a CPA.
Schools (NCES district)
- District
- Sheldon ISD
- NCES district ID
- 4839990
- Math proficiency
- 19% ▼ -18.00%
- Reading proficiency
- 25% ▼ -10.00%
- Median HH income
- $49,443
- Composite
- 19.5/100
- National rank
- #8772
- State rank
- #746 of 826 in TX
Livability — Houston
- Score
- 74/100
- State rank
- #184
- US rank
- #4771
Category grades
Schools grade is shown separately in the Schools card above.
Census & demographics
- County
- Harris County · 4,702,590 people
- City population
- 3,226,434
- Metro
- Houston-The Woodlands-Sugar Land, TX
- Population (ZIP)
- 40,418
- Household income
- $62,971
- Rent vs Own
- Severe rent burden
- 993.0
Population outlook (Harris County) Hauer SSP2
- Today (2025)
- 5,571,493 people
- By 2030
- 6,089,821 · +9.3%
- By 2040
- 7,142,806 · +28.2%
- By 2050
- 8,185,864 · +46.9%
- By 2075
- 10,574,329 · +89.8%
- By 2100
- 12,109,958 · +117.4%
Race, ethnicity, and origin ACS 2023
- Neighborhood character
- Predominantly Hispanic (66%)
- Race & ethnicity
- Hispanic / Latino 66% Two or more races 32% Black 19% White 10% Asian 3%
- Hispanic origin (detail)
- Mexican 55%
- Common ancestry
- Lithuanian 1%
- Foreign-born
- 26% · Canada, China, Vietnam
- Languages at home
- 43% English-only · Spanish 54% Other Asian/Pacific 1% Chinese 1%
Political lean MEDSL · Harris
- 2024 margin
- Lean D (+5.5) · D 52.0% · R 46.4% · Other 1.6%
- 2008→2024 swing
- +3.9pp toward D · 2008: 1.6pp · 2024: 5.5pp
- All cycles
- 2024: D+5.5 2020: D+13.3 2016: D+12.4 2012: D+0.1 2008: D+1.6
Not yet ingested
- Civics
- —
Market trends
- HPI YoY
- ▼ -1.20%
- Current HPI
- 248.1111
- Rent YoY
- ▼ -3.31%
- Metro
- Houston-The Woodlands-Sugar Land, TX
- State GDP YoY
- ▲ 3.95%
- F500 in state
- 110
Industry mix (Fortune 500 HQ in TX)
| Industry | F500 HQs | Revenue |
|---|---|---|
| Energy | 16 | $1,198B |
|
||
| Technology | 5 | $198B |
|
||
| Engineering / Construction | 4 | $72B |
|
||
| Energy Services | 3 | $60B |
|
||
| Utilities | 3 | $41B |
|
||
| Healthcare | 2 | $330B |
|
||
Price history
2 events — show timeline
- 2026-06-03 Listed $220,000 HARMLS
- 1988-01-02 Sold (Public Records) — Public Records
Property tax history
+4.2%/yrLatest (2025): $4,925 · +11.2% YoY. Source: county tax records.
Cash-flow waterfall
monthlySold comps — $/sqft
last 12 mo · ≤1 miLoading sold comps…