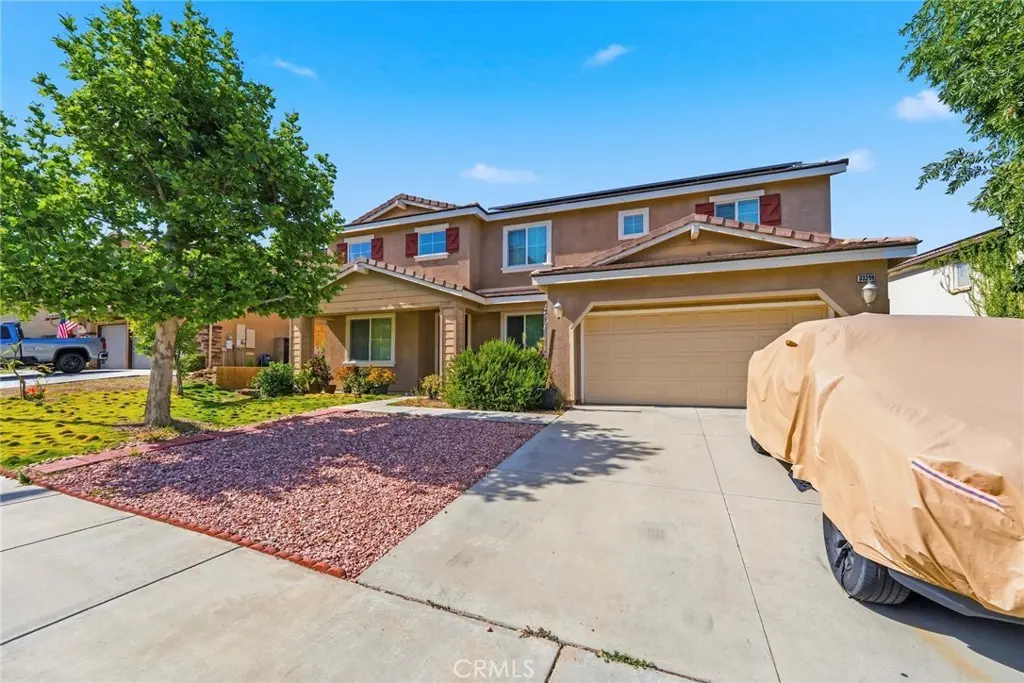
33249 Chert · Wildomar, CA
Flood risk 4/10 · Minor
- FEMA flood zone
- X (shaded)
- Chance of flooding over 30 yrs
- 0.22%
- Est. flood insurance / yr
- $507 – $1,088
Fire risk 10/10 · Severe
- Est. fire insurance / yr
- $659 – $1,223
Heat risk 6/10 · Moderate
- Hot days now (above 101°F)
- 7 days/yr
- Hot days in 30 yrs
- 19 days/yr
Wind risk 1/10 · Minimal
- Chance of severe wind over 30 yrs
- —
Air-quality risk 5/10 · Moderate
- Unhealthy air days now
- 7 days/yr
- Unhealthy air days in 30 yrs
- 9 days/yr
Risk factors via First Street. Map © Google.
Why this score? — see what drove the B- grade
The composite is a weighted blend of 9 inputs, each scored 0–100. Each bar is that input's sub-score; the figure is the points it added to the 100-point composite (weight × sub-score).
- Cash flow +28.1/30.0
- ARV discount +11.0/15.0
- DSCR +10.0/10.0
- 1% rule +8.0/10.0
- Schools +3.7/10.0
- Livability +2.7/5.0
- Condition / age +2.5/5.0
- Rent growth +2.0/5.0
- Appreciation +0.0/10.0
$645,000
🖨 Deal sheet 📄 Offer letter ✓ Due diligence
Listing remarks MLS
Price drop. .. .Price drop. .Stop and look no more. .. This home offers you everything you need. Featuring a 5 bedroom and 3 bath with one of the rooms located downstairs and a upstairs room being used as a loft. Kitchen has a walk in pantry. Open floor plan . Possibilities are endless. Property is over 3300 of living space with open floor plan perfect home for entertaining. Property sits on over a 8200 sq ft lot with a 2 car garage.
Key facts
- 8,276 sq ft lot
- 2 garage spots
- Built 2007
Neighborhood map
What this means for you Summary
Snapshot
- This is a 5-bed/3.0-bath single-family listed at $645k.
Deal economics
- At list price, monthly cash flow is $2k ($24k/yr) — positive.
- The deal already cash-flows at list — no discount required.
- Meets the 1% rule at list price ($8k rent vs $645k).
- Recommended offer: $606k (6.0% below list) — sets the bar for market timing.
- Cap rate 10.1% vs local median 3.3% in Wildomar — top-decile yield for the area; either an underpriced asset or a hidden risk that comps aren't pricing in. Stress-test before assuming the spread holds.
Location & tenants
- Location reads 53/100 on livability (#951 in CA) — a working-class tenant base; expect higher turnover. Strengths: crime A+, housing A+, employment B+; Watch: schools D, health & safety D, amenities F.
- Lake Elsinore Unified (suburban): math 34% / reading 49% proficiency, ranked #210 of 517 in CA (top 41%) — families likely to look elsewhere, expect single-tenant / working-renter base with shorter leases.
- Market conditions: Rents soft (-2.1%/yr); 145 active listings in the ZIP; 3 comparable units currently listed for rent nearby; rentals at typical pace (median 22d on market — plan ~3-4 weeks tenant-placement turnaround); solid renter incomes; 9,195 units permitted in Riverside County in 2024 (1,512 in 5+ unit buildings).
- At $8,384/mo this rent would consume 95% of the median local household income ($106k/yr) (locally 429% of renters already pay >50% of income on rent) — very limited rent-growth headroom before tenants either downsize or default.
Forward outlook
- Local home prices are declining (-3.0%/yr); year-one equity from $4k of loan paydown is wiped out by about $19k of value loss. Plan a longer hold.
- Riverside County population projected at +22% by 2050 — long-run rental-demand tailwind backs the buy-and-hold thesis.
Negotiation context
- It's been on market 61 days — a 6% lower offer ($606k) is reasonable based on typical stale-listing flexibility.
- 5 sale attempts since 18y ago; this cycle's ask has dropped $50k (7%) from the opening price — seller is motivated, your offer sets the floor, not the list.
Risks & watch-outs
- Climate carrying-cost: severe wildfire risk; extreme-heat days projected 7→19/yr by 2055 (HVAC capex compounding) — expect insurance premiums to compound above CPI over the hold.
Questions for the listing agent
- It's been on market 61 days. Have you received any prior offers? Is the seller open to a 6% concession, seller financing, or rate buy-down credit?
- What does the HOA fee cover, when was the last increase, and are there any pending special assessments or reserve-fund shortfalls?
- Why hasn't it sold? Are there any deal-killer items the seller is aware of (foundation, flood, title, zoning, code violations)?
- Is there a deadline driving the sale (1031 exchange, divorce, estate, relocation)? That informs how much negotiation room exists.
- Schools are D-rated, which usually means shorter tenancies and higher turnover. Who's the typical renter profile here, and what's been the actual vacancy rate?
- What's the average days-on-market for RENTAL listings here right now (not sales)? A rising rental-DOM trend means longer vacancies and softer asking-rent achievability than the comps imply.
- What's the recent tenant-quality profile in this submarket — average credit score on applications, eviction rate, late-payment / NSF rate, and stable-employment percentage? A property-management company in the area should have these aggregated.
- How much new for-sale + rental construction is in the pipeline within 1–3 miles? Heavy new supply typically softens prices + rents 12–24 months out; constrained supply supports both.
Investment metrics
- 1% rule
- 1.30% ✓
- Cap rate
- 10.06%
- Cash-on-cash
- 13.46%
- DSCR
- 1.60
- GRM
- 6.4
CMA / ARV
- ARV (median comp)
- $699,446
- List price
- $645,000
- Delta
- -7.78%
- Verdict
- FAIR
- Comps
- 20 within 1.0 mi
Show comp detail 12 sales within ~0.75 mi
| Address | Dist | Beds/Ba | Sqft | Sold | Price | $/sf | Match |
|---|---|---|---|---|---|---|---|
| 21565 Pumice | 0.10mi | 5/3.0 | 3,314 (0%) | 1mo | $770,000 | $232 | 95 |
| 21567 Coral Rock Ln | 0.05mi | 5/3.0 | 3,314 (0%) | 5mo | $630,000 | $190 | 94 |
| 21649 Pumice | 0.09mi | 5/3.0 | 2,816 (-15%) | 0mo | $765,000 | $272 | 70 |
| 32789 Starlight St | 0.41mi | 5/3.0 | 3,124 (-6%) | 3mo | $696,800 | $223 | 69 |
| 21827 ATHEA Way | 0.33mi | 4/3.0 (-1) | 3,124 (-6%) | 3mo | $705,000 | $226 | 68 |
| 36275 Firelight | 0.58mi | 5/3.0 | 3,462 (+4%) | 3mo | $780,000 | $225 | 63 |
| 33317 Cameo Ln | 0.17mi | 5/3.0 | 2,816 (-15%) | 6mo | $675,000 | $240 | 62 |
| 21444 Coral Rock | 0.18mi | 5/3.0 | 2,816 (-15%) | 7mo | $630,000 | $224 | 61 |
| 36300 Firelight Cir | 0.59mi | 4/3.0 (-1) | 3,053 (-8%) | 3mo | $715,000 | $234 | 52 |
| 21735 Amaryllis Ct | 0.66mi | 6/4.0 (+1) | 3,200 (-3%) | 4mo | $785,000 | $245 | 51 |
| 36316 Beacon Light Way | 0.71mi | 4/3.0 (-1) | 3,053 (-8%) | 2mo | $740,000 | $242 | 47 |
| 33220 Wilson | 0.56mi | 4/3.0 (-1) | 3,657 (+10%) | 6mo | $812,000 | $222 | 46 |
Match score weights: distance 35% · size 25% · config 20% · recency 20%. Top-matched comps best support the ARV.
Projected returns pro-forma
-3.0% appreciation · 0.0% rent growth · sell at horizon
- IRR
- 0.0%
- Equity multiple
- 1.00×
- Total profit
- $106
- Equity at exit
- $96,172
- IRR
- 6.2%
- Equity multiple
- 1.40×
- Total profit
- $72,089
- Equity at exit
- $55,768
Cash invested: $180,600 (down + closing). Projections, not guarantees.
Landlord ↔ Tenant lean methodology
- Overall (STATE)
- 18 Strongly Tenant-Friendly
- State California
- 18 Strongly Tenant-Friendly · D+13
- County
- — inherits STATE
- City
- — inherits STATE
ZIP-level market 92595
- Home prices YoY
- -23.8%
- Rents YoY
- -2.1%
- Active inventory
- 145
- Price-to-rent
- 6.4×
Monthly cashflow live
- Estimated rent
- $8,384 medium interval (Pro) →
- Mortgage (P&I)
- −$3,382
- Tax from tax record
- −$864 /mo · $10,365/yr
- Insurance
- −$269
- HOA
- −$83
- Vacancy / Maint / Mgmt
- −$1,761
- Net cashflow
- $2,025
Break-even live
UW: 25.0% down · 7.5% · 30yr · 1.5% tax · 5.0% vac · 8.0% maint · 8.0% mgmt
Financing live
Cash to close
- Down payment
- $161,250
- Closing costs
- $19,350
- Reserves months
- —
- Total cash needed
- —
Loan-product check · same deal, 3 products live
Conventional
25% down · 7.5% · 30yr
- Down + closing
- —
- Monthly P&I
- —
- Monthly cashflow
- —
- DSCR
- —
- Eligible?
- —
Personal DTI + credit; lowest rate.
DSCR
20% down · 8.5% · 30yr
- Down + closing
- —
- Monthly P&I
- —
- Monthly cashflow
- —
- DSCR
- —
- Eligible?
- —
No personal income docs; deal must DSCR.
Hard money
10% down · 12.0% · 12mo
- Down + closing
- —
- Monthly P&I
- —
- Monthly cashflow
- —
- DSCR
- —
- Eligible?
- —
Short-term bridge; refi at stabilization.
Rent comps 3 comps
| Address | Beds | Baths | Sqft | Rent | $/sqft | DOM | Units | Dist |
|---|---|---|---|---|---|---|---|---|
| 22053 Highland St Wildomar, CA | 5.0 | 3.5 | 4376 | $17,000 | $3.88 | 5d | 1 | 0.60mi |
| 36413 Wandering Rill St Wildomar, CA | 5.0 | 4.0 | 4018 | $5,000 | $1.24 | 44d | 1 | 1.02mi |
| 36124 Madora Dr Wildomar, CA | 4.0 | 3.0 | 2844 | $3,475 | $1.22 | 22d | 1 | 1.21mi |
HOA detail
- Monthly dues
- $83 · $996/yr
Listing history 31 events
-
2026-06-18days on market $645,000 Active 61 DOM
-
2026-06-17days on market $645,000 Active 60 DOM
-
2026-06-16days on market $645,000 Active 59 DOM
-
2026-06-15days on market $645,000 Active 58 DOM
-
2026-06-13days on market $645,000 Active 56 DOM
-
2026-06-13days on market $645,000 Active 55 DOM
-
2026-06-09days on market $645,000 Active 52 DOM
-
2026-06-08days on market $645,000 Active 51 DOM
-
2026-06-07days on market $645,000 Active 50 DOM
-
2026-06-04days on market $645,000 Active 47 DOM
-
2026-06-03days on market $645,000 Active 46 DOM
-
2026-06-02days on market $645,000 Active 45 DOM
-
2026-06-01days on market $645,000 Active 44 DOM
-
2026-05-31days on market $645,000 Active 43 DOM
-
2026-04-29price $645,000 437-char remark
Show marketing remark (437 chars)
Price drop. .. .Price drop. .Stop and look no more. .. This home offers you everything you need. Featuring a 5 bedroom and 3 bath with one of the rooms located downstairs and a upstairs room being used as a loft. Kitchen has a walk in pantry. Open floor plan . Possibilities are endless. Property is over 3300 of living space with open floor plan perfect home for entertaining. Property sits on over a 8200 sq ft lot with a 2 car garage.
-
2026-04-18$695,000 Active 437-char remark
Show marketing remark (437 chars)
Price drop. .. .Price drop. .Stop and look no more. .. This home offers you everything you need. Featuring a 5 bedroom and 3 bath with one of the rooms located downstairs and a upstairs room being used as a loft. Kitchen has a walk in pantry. Open floor plan . Possibilities are endless. Property is over 3300 of living space with open floor plan perfect home for entertaining. Property sits on over a 8200 sq ft lot with a 2 car garage.
-
2026-04-14historical $695,000 437-char remark
Show marketing remark (437 chars)
Price drop. .. .Price drop. .Stop and look no more. .. This home offers you everything you need. Featuring a 5 bedroom and 3 bath with one of the rooms located downstairs and a upstairs room being used as a loft. Kitchen has a walk in pantry. Open floor plan . Possibilities are endless. Property is over 3300 of living space with open floor plan perfect home for entertaining. Property sits on over a 8200 sq ft lot with a 2 car garage.
-
2026-03-18historical
-
2026-01-04price $699,999
-
2025-09-18$715,000 Active
-
2024-06-05soldstatus $691,000
-
2024-03-14soldstatus $680,000 Closed Sale
-
2024-03-14soldstatus $680,000
-
2024-02-11status Pending Sale
-
2024-02-03status Active
-
2024-01-13historical $679,000
-
2010-01-14soldstatus $240,000
-
2010-01-13soldstatus $240,000 Closed
-
2008-08-07status
-
2008-08-01historical
-
2008-06-28$300,000
ⓘ Source: listings_history table (triggers on properties + properties_extension) + one-shot
backfill from property_details.listing_events for pre-trigger history.
Tax reassessment forecast CA · Resets to sale price
- Current annual tax
- $10,365 · $864/mo
- Projected year-2 tax
- $10,365 · $864/mo
- Expected delta
- $0/yr ($0/mo · 0.0%)
ⓘ Screening estimate from a state-policy table — verify with the county assessor before closing.
Climate risk First Street
- Flood 4/10 Moderate FEMA zone X (shaded) · 22% chance over 30 yrs
- Wildfire 10/10 Extreme
- Heat 6/10 Major 7 d/yr ≥101°F today · 19 d/yr by 30 yrs out
- Wind 1/10 Low
- Air quality 5/10 Major 7 unhealthy d/yr today · 9 by 30 yrs out
Nearby sold comps map
Loading sold comps map…
Walkable amenities ~0.75 mi
Loading nearby amenities…
Taxation est. · year 1
- Rental income
- $100,604
- − Mortgage interest
- −$36,130
- − Property taxes
- −$10,365
- − Insurance
- −$3,225
- − Repairs & maintenance
- −$8,048
- − Management
- −$8,048
- − HOA
- −$996
- − Depreciation
- −$18,764
- Taxable income
- $15,027
- Est. tax owed @ 24.0%
- −$3,607
- After-tax cash flow
- $20,695/yr
For passive investors: Depreciation is non-cash, so a rental often shows a tax loss while cash-flowing — sheltering income. Rental losses are passive: they offset passive income freely, and up to $25,000/yr can offset ordinary (W-2) income if you actively participate and your MAGI is under $100k (phasing out to $0 by $150k); unused losses carry forward. On sale, claimed depreciation is recaptured at up to 25%, and gains may owe capital-gains tax (a 1031 exchange can defer both). Figures are a year-1 estimate at your 24.0% rate — not tax advice; consult a CPA.
Schools (NCES district)
- District
- Lake Elsinore Unified
- NCES district ID
- 0600027
- Math proficiency
- 34% ▲ 5.00%
- Reading proficiency
- 49% ▲ 8.00%
- Median HH income
- $63,829
- Composite
- 37.01/100
- National rank
- #4518
- State rank
- #210 of 517 in CA
Livability — Wildomar
- Score
- 53/100
- State rank
- #951
- US rank
- #24427
Category grades
Schools grade is shown separately in the Schools card above.
Census & demographics
- Census place
- Wildomar, CA
- County
- Riverside County · 2,287,001 people
- City population
- 34,438
- Metro
- Riverside-San Bernardino-Ontario, CA
- Population (ZIP)
- 34,438
- Household income
- $106,047
- Rent vs Own
- Severe rent burden
- 429.0
Population outlook (Riverside County) Hauer SSP2
- Today (2025)
- 2,664,475 people
- By 2030
- 2,802,692 · +5.2%
- By 2040
- 3,050,904 · +14.5%
- By 2050
- 3,256,783 · +22.2%
- By 2075
- 3,655,058 · +37.2%
- By 2100
- 3,766,594 · +41.4%
Race, ethnicity, and origin ACS 2023
- Neighborhood character
- Diverse neighborhood (Simpson 0.66)
- Race & ethnicity
- White 42% Hispanic / Latino 41% Two or more races 18% Asian 5% Black 3%
- Hispanic origin (detail)
- Mexican 33%
- Common ancestry
- Slovak 2% Lithuanian 1% Romanian 1%
- Foreign-born
- 17% · Canada, Vietnam, China
- Languages at home
- 69% English-only · Spanish 25% Tagalog/Filipino 1% Vietnamese 1%
Political lean MEDSL · Riverside
- 2024 margin
- Toss-up / Even · D 48.0% · R 49.3% · Other 2.6%
- 2008→2024 swing
- -3.6pp toward R · 2008: 2.3pp · 2024: -1.3pp
- All cycles
- 2024: R+1.3 2020: D+8.0 2016: D+4.3 2012: R+0.4 2008: D+2.3
Not yet ingested
- Civics
- —
Market trends
- HPI YoY
- ▼ -110.47%
- Current HPI
- 354.397
- Rent YoY
- ▼ -2.12%
- Metro
- Riverside-San Bernardino-Ontario, CA
- State GDP YoY
- ▲ 3.21%
- F500 in state
- 116
Industry mix (Fortune 500 HQ in CA)
| Industry | F500 HQs | Revenue |
|---|---|---|
| Technology | 27 | $1,492B |
|
||
| Financial Services | 3 | $174B |
|
||
| Retail | 3 | $44B |
|
||
| Insurance | 3 | $26B |
|
||
| Media / Entertainment | 2 | $115B |
|
||
| Pharmaceuticals / Biotech | 2 | $62B |
|
||
Price history
+115.0% since first listed17 events — show timeline
- 2026-04-29 Price Changed $645,000 CRMLS
- 2026-04-18 Listed $695,000 CRMLS
- 2026-04-14 Coming Soon $695,000 CRMLS
- 2026-03-18 Listing Removed — CRMLS
- 2026-01-04 Price Changed $699,999 CRMLS
- 2025-09-18 Listed $715,000 CRMLS
- 2024-06-05 Sold (Public Records) $691,000 Public Records
- 2024-03-14 Sold (Public Records) $680,000 Public Records
- 2024-03-14 Sold (MLS) $680,000 CRMLS
- 2024-02-11 Pending — CRMLS
- 2024-02-03 Relisted — CRMLS
- 2024-01-13 Coming Soon $679,000 CRMLS
- 2010-01-14 Sold (Public Records) $240,000 Public Records
- 2010-01-13 Sold (MLS) $240,000 CRMLS
- 2008-08-07 Relisted — CRMLS
- 2008-08-01 Listing Removed — CRMLS
- 2008-06-28 Listed $300,000 CRMLS
Property tax history
+3.7%/yrLatest (2025): $10,365 · +75.1% YoY. Source: county tax records.
Cash-flow waterfall
monthlySold comps — $/sqft
last 12 mo · ≤1 miLoading sold comps…