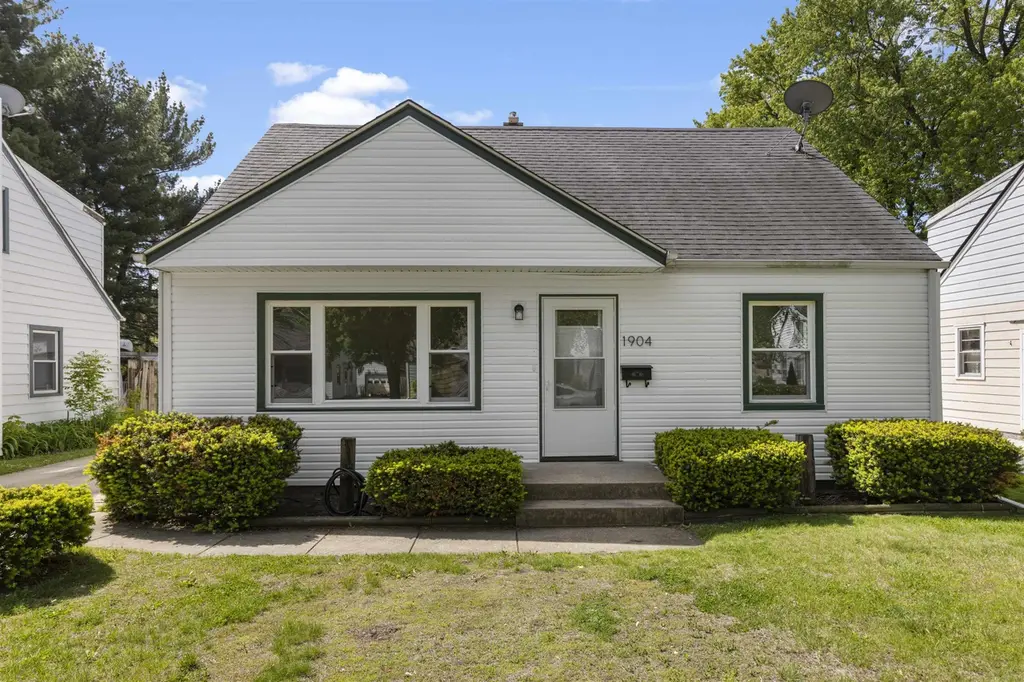
1904 W Pearl Ave · Rockford, IL
Flood risk 1/10 · Minimal
- FEMA flood zone
- X (unshaded)
- Chance of flooding over 30 yrs
- 0.0%
- Est. flood insurance / yr
- $473 – $860
Fire risk 1/10 · Minimal
- Est. fire insurance / yr
- $804 – $1,492
Heat risk 2/10 · Minimal
- Hot days now (above 102°F)
- 7 days/yr
- Hot days in 30 yrs
- 15 days/yr
Wind risk 2/10 · Minimal
- Chance of severe wind over 30 yrs
- —
Air-quality risk 2/10 · Minimal
- Unhealthy air days now
- 1 days/yr
- Unhealthy air days in 30 yrs
- 2 days/yr
Risk factors via First Street. Map © Google.
Why this score? — see what drove the D grade
The composite is a weighted blend of 9 inputs, each scored 0–100. Each bar is that input's sub-score; the figure is the points it added to the 100-point composite (weight × sub-score).
- Cash flow +14.4/30.0
- ARV discount +9.0/15.0
- Rent growth +4.5/5.0
- DSCR +4.4/10.0
- 1% rule +3.1/10.0
- Livability +3.1/5.0
- Condition / age +2.5/5.0
- Schools +1.2/10.0
- Appreciation +0.0/10.0
$207,500
🖨 Deal sheet (PDF) 📄 Offer letter ✓ Due diligence
Listing remarks
Welcome home to 1904 W Pearl Avenue, a fully renovated and turn-key single-family residence situated in a quiet neighborhood on the north end of Rockford. Spanning a thoughtful 1.5-story layout, this spacious home offers four comfortable bedrooms—conveniently split with two on the main floor and two upstairs—alongside two beautifully updated bathrooms. Every inch of this property has been completely transformed, showcasing pristine luxury laminate flooring and plush new carpeting throughout, freshly painted neutral walls, and large vinyl windows that flood the home with natural light. The heart of the home features a spectacular, modern kitchen equipped with stunning marble-look
Key facts
- Fully renovated
- Fully fenced-in yard
- New ductwork
Tags
Property features AI
Exterior
- Parking: Detached garage (1.5 car)
- Utilities: Public water; Public sewer
- Home design: Single-family house; Single-story
- Construction: Finished below-grade area
- Exterior features: Shingle roof; 0.15-acre lot
Interior
- Kitchen: Gas cooktop
- Bathrooms: Two full bathrooms; One main-level bathroom
- Heating & cooling: Forced air heating (natural gas); Central air conditioning
- Interior features: Finished full basement; Gas water heater
- Laundry & utility: Washer; Dryer
Neighborhood map
What this means for you Summary
Snapshot
- This is a 4-bed/2.0-bath single-family listed at $208k.
Deal economics
- At list price, monthly cash flow is $43 ($516/yr) — positive.
- The deal already cash-flows at list — no discount required.
- To meet the 1% rule (rent ≥ 1% of price), the offer needs to be $169k (18.8% below list).
- Recommended offer: $169k (18.8% below list) — sets the bar for 1% rule.
Location & tenants
- Location reads 62/100 on livability (#876 in IL) — a middle-class / working-renter tenant base. Strengths: cost of living A+, housing A+, health & safety A+; Watch: crime F, amenities F, commute F.
- Rockford SD 205 (urban): math 12% / reading 16% proficiency, ranked #533 of 620 in IL (top 86%) — low school quality limits family demand, transient renter base, plan for 1-2y turnover; 73% free/reduced lunch — lower-income household profile, screen leases tightly.
- Zoned schools: West View Elem School (math 2% / reading 2%, grade F, #1,927 of 2,056 statewide, top 100%, 420 students, 0% FRL); West Middle School (math 3% / reading 11%, grade F, #627 of 665 statewide, top 95%, 849 students, 0% FRL); Auburn High School (math 26% / reading 32%, grade F, #210 of 693 statewide, top 30%, 1,936 students, 0% FRL) — zoned schools average 0% FRL vs 73% district-wide (73 pts lower); this property's tenant base skews higher-income than the district average.
- Market conditions: Rents rising fast (+8.1%/yr); 105 active listings in the ZIP; 1 comparable units currently listed for rent nearby; 285 units permitted in Winnebago County in 2024 (0 in 5+ unit buildings).
- This rent runs 40% of the median local income ($51k/yr) — at the standard rent-burdened threshold; future hikes will face affordability resistance.
Forward outlook
- Local home prices are declining (-3.0%/yr); year-one equity from $1k of loan paydown is wiped out by about $6k of value loss. Plan a longer hold.
- Winnebago County population projected at -20% by 2050 — secular population decline; favor cash flow + early exit over multi-decade hold.
Negotiation context
- Only 7 days on market — expect competitive offers; lowballing is unlikely to land.
Risks & watch-outs
- Watch-outs: built in 1957 — expect roof / HVAC / electrical / plumbing capex.
Questions for the listing agent
- Built in 1957 — when were the roof, HVAC, electrical panel, plumbing, and water heater last replaced?
- Is there a deadline driving the sale (1031 exchange, divorce, estate, relocation)? That informs how much negotiation room exists.
- Schools are F-rated, which usually means shorter tenancies and higher turnover. Who's the typical renter profile here, and what's been the actual vacancy rate?
- Crime grade is F in this area — have there been break-ins, vandalism, or insurance claims at this property in the last 3 years? What carrier currently insures it and at what premium?
- The area grade is low — what's the realistic commute time and amenity access for the typical tenant pool here? Any planned neighborhood developments (good or bad) we should know about?
- What's the average days-on-market for RENTAL listings here right now (not sales)? A rising rental-DOM trend means longer vacancies and softer asking-rent achievability than the comps imply.
- What's the recent tenant-quality profile in this submarket — average credit score on applications, eviction rate, late-payment / NSF rate, and stable-employment percentage? A property-management company in the area should have these aggregated.
- How much new for-sale + rental construction is in the pipeline within 1–3 miles? Heavy new supply typically softens prices + rents 12–24 months out; constrained supply supports both.
Investment metrics
- 1% rule
- 0.81% ✗
- Cap rate
- 6.54%
- Cash-on-cash
- 0.89%
- DSCR
- 1.04
- GRM
- 10.3
CMA / ARV
- ARV (on-the-fly)
- $214,544
- Comps found
- 12
Show comp detail 12 sales within ~0.75 mi
| Address | Dist | Beds/Ba | Sqft | Sold | Price | $/sf | Match |
|---|---|---|---|---|---|---|---|
| 1904 W Pearl Ave | 0.00mi | 4/2.0 | 2,024 (0%) | 0mo | $210,000 | $104 | 100 |
| 1812 Crestwood Ave | 0.07mi | 4/1.5 | 2,039 (+1%) | 7mo | $169,900 | $83 | 88 |
| 1928 Paradise Blvd | 0.20mi | 3/2.0 (-1) | 1,974 (-2%) | 4mo | $135,000 | $68 | 78 |
| 1704 Wedel Ave | 0.25mi | 3/1.0 (-1) | 1,948 (-4%) | 0mo | $239,000 | $123 | 73 |
| 1626 Constitution Pl | 0.36mi | 3/2.0 (-1) | 1,842 (-9%) | 2mo | $195,000 | $106 | 62 |
| 3507 Grouse Ct | 0.31mi | 3/2.0 (-1) | 2,195 (+8%) | 6mo | $226,000 | $103 | 61 |
| 3502 Teal Ln | 0.50mi | 3/1.5 (-1) | 1,958 (-3%) | 5mo | $209,900 | $107 | 60 |
| 1823 Sauber Ave | 0.41mi | 3/1.0 (-1) | 1,850 (-9%) | 3mo | $123,000 | $66 | 55 |
| 1514 Belmont Blvd | 0.36mi | 4/1.5 | 1,769 (-13%) | 7mo | $210,000 | $119 | 54 |
| 1630 River Bluff Blvd | 0.41mi | 3/2.5 (-1) | 2,256 (+12%) | 5mo | $240,000 | $106 | 50 |
| 3535 Latham St | 0.54mi | 3/1.0 (-1) | 1,811 (-10%) | 1mo | $207,000 | $114 | 47 |
| 1420 Notre Dame Rd | 0.65mi | 3/2.0 (-1) | 1,782 (-12%) | 2mo | $190,000 | $107 | 43 |
Match score weights: distance 35% · size 25% · config 20% · recency 20%. Top-matched comps best support the ARV.
Projected returns pro-forma
-3.0% appreciation · 8.0% rent growth · sell at horizon
- IRR
- -10.0%
- Equity multiple
- 0.62×
- Total profit
- $-22,045
- Equity at exit
- $30,939
- IRR
- 4.8%
- Equity multiple
- 1.42×
- Total profit
- $24,601
- Equity at exit
- $17,941
Cash invested: $58,100 (down + closing). Projections, not guarantees.
Landlord ↔ Tenant lean methodology
- Overall (STATE)
- 43 Moderately Tenant-Leaning
- State Illinois
- 43 Moderately Tenant-Leaning · D+7
- County
- — inherits STATE
- City
- — inherits STATE
ZIP-level market 61103
- Home prices YoY
- -27.3%
- Rents YoY
- 8.1%
- Active inventory
- 105
- Price-to-rent
- 10.3×
Monthly cashflow live
- Estimated rent
- $1,685 medium interval (Pro) →
- Mortgage (P&I)
- −$1,088
- Tax from tax record
- −$114 /mo · $1,364/yr
- Insurance
- −$86
- HOA
- −$0
- Vacancy / Maint / Mgmt
- −$354
- Net cashflow
- $43
Break-even live
Sensitivity live
| Price | -10% $160 | -5% $102 | +0% $43 | +5% $-16 | +10% $-74 |
|---|---|---|---|---|---|
| Rent | -10% $-90 | -5% $-24 | +0% $43 | +5% $110 | +10% $176 |
| Rate | -1.0pp $147 | -0.5pp $96 | base $43 | +0.5pp $-11 | +1.0pp $-65 |
UW: 25.0% down · 7.5% · 30yr · 1.5% tax · 5.0% vac · 8.0% maint · 8.0% mgmt
Financing live
Cash to close
- Down payment
- $51,875
- Closing costs
- $6,225
- Reserves months
- —
- Total cash needed
- —
Loan-product check · same deal, 3 products live
Conventional
25% down · 7.5% · 30yr
- Down + closing
- —
- Monthly P&I
- —
- Monthly cashflow
- —
- DSCR
- —
- Eligible?
- —
Personal DTI + credit; lowest rate.
DSCR
20% down · 8.5% · 30yr
- Down + closing
- —
- Monthly P&I
- —
- Monthly cashflow
- —
- DSCR
- —
- Eligible?
- —
No personal income docs; deal must DSCR.
Hard money
10% down · 12.0% · 12mo
- Down + closing
- —
- Monthly P&I
- —
- Monthly cashflow
- —
- DSCR
- —
- Eligible?
- —
Short-term bridge; refi at stabilization.
Rent comps 1 comps
| Address | Beds | Baths | Sqft | Rent | $/sqft | DOM | Units | Dist |
|---|---|---|---|---|---|---|---|---|
| 3422 Fremont St Rockford, IL | 3.0 | 2.0 | 1700 | $1,975 | $1.16 | 14d | 1 | 0.50mi |
Listing history 1 events
-
2026-05-16$207,500 Active
ⓘ Source: listings_history table (triggers on properties + properties_extension) + one-shot
backfill from property_details.listing_events for pre-trigger history.
Tax reassessment forecast IL · Partial reset (capped growth)
- Current annual tax
- $1,364 · $114/mo
- Projected year-2 tax
- $3,037 · $253/mo
- Expected delta
- +$1,673/yr (+$139/mo · 122.7%)
ⓘ Screening estimate from a state-policy table — verify with the county assessor before closing.
Climate risk First Street
- Flood 1/10 Low FEMA zone X (unshaded) · 0% chance over 30 yrs
- Wildfire 1/10 Low
- Heat 2/10 Low 7 d/yr ≥102°F today · 15 d/yr by 30 yrs out
- Wind 2/10 Low
- Air quality 2/10 Low 1 unhealthy d/yr today · 2 by 30 yrs out
Nearby sold comps map
Loading sold comps map…
Walkable amenities ~0.75 mi
Loading nearby amenities…
Taxation est. · year 1
- Rental income
- $20,222
- − Mortgage interest
- −$11,623
- − Property taxes
- −$1,364
- − Insurance
- −$1,038
- − Repairs & maintenance
- −$1,618
- − Management
- −$1,618
- − Depreciation
- −$6,036
- Taxable loss
- −$3,075
- Est. tax savings @ 24.0%
- +$738
- After-tax cash flow
- $1,254/yr
For passive investors: Depreciation is non-cash, so a rental often shows a tax loss while cash-flowing — sheltering income. Rental losses are passive: they offset passive income freely, and up to $25,000/yr can offset ordinary (W-2) income if you actively participate and your MAGI is under $100k (phasing out to $0 by $150k); unused losses carry forward. On sale, claimed depreciation is recaptured at up to 25%, and gains may owe capital-gains tax (a 1031 exchange can defer both). Figures are a year-1 estimate at your 24.0% rate — not tax advice; consult a CPA.
Schools (NCES district)
- District
- Rockford SD 205
- NCES district ID
- 1734510
- Math proficiency
- 12% ▼ -2.00%
- Reading proficiency
- 16% ▼ -3.00%
- Median HH income
- $42,533
- Composite
- 12.21/100
- National rank
- #9649
- State rank
- #533 of 620 in IL
Livability — Rockford
- Score
- 62/100
- State rank
- #876
- US rank
- #17035
Category grades
Schools grade is shown separately in the Schools card above.
Census & demographics
- Census place
- Rockford, IL
- County
- Winnebago County · 147,297 people
- City population
- 147,297
- Metro
- Rockford, IL
- Population (ZIP)
- 22,869
- Household income
- $51,161
- Rent vs Own
- Severe rent burden
- 1402.0
Population outlook (Winnebago County) Hauer SSP2
- Today (2025)
- 271,080 people
- By 2030
- 260,684 · -3.8%
- By 2040
- 238,405 · -12.1%
- By 2050
- 216,129 · -20.3%
- By 2075
- 172,882 · -36.2%
- By 2100
- 135,336 · -50.1%
Race, ethnicity, and origin ACS 2023
- Neighborhood character
- Diverse neighborhood (Simpson 0.61)
- Race & ethnicity
- White 56% Black 25% Two or more races 13% Hispanic / Latino 12%
- Hispanic origin (detail)
- Mexican 10%
- Common ancestry
- Romanian 3% Portuguese 2% Italian 2%
- Foreign-born
- 7% · Canada
- Languages at home
- 88% English-only · Spanish 9% Russian/Polish/Slavic 1%
Political lean MEDSL · Winnebago
- 2024 margin
- Toss-up / Even · D 49.5% · R 49.0% · Other 1.5%
- 2008→2024 swing
- -12.2pp toward R · 2008: 12.8pp · 2024: 0.6pp
- All cycles
- 2024: D+0.6 2020: D+2.5 2016: R+1.2 2012: D+5.7 2008: D+12.8
Not yet ingested
- Civics
- —
Market trends
- HPI YoY
- ▼ -81.02%
- Current HPI
- 215.8559
- Rent YoY
- ▲ 8.11%
- Metro
- Rockford, IL
- State GDP YoY
- ▲ 1.59%
- F500 in state
- 60
Industry mix (Fortune 500 HQ in IL)
| Industry | F500 HQs | Revenue |
|---|---|---|
| Insurance | 4 | $201B |
|
||
| Consumer Goods | 4 | $87B |
|
||
| Industrial Machinery | 3 | $64B |
|
||
| Healthcare | 2 | $55B |
|
||
| Retail / Pharmacy | 1 | $148B |
|
||
| Agriculture / Food | 1 | $86B |
|
||
Price history
1 event — show timeline
- 2026-05-16 Listed $207,500 NWIAR
Property tax history
-4.3%/yrLatest (2024): $1,364 · -8.7% YoY. Source: county tax records.
Cash-flow waterfall
monthlySold comps — $/sqft
last 12 mo · ≤1 miLoading sold comps…