1261 Upper Valley Falls Rd Rd · Valley Falls, SC
Flood risk 1/10 · Minimal
- FEMA flood zone
- X (unshaded)
- Chance of flooding over 30 yrs
- 0.0%
- Est. flood insurance / yr
- $507 – $1,088
Fire risk 4/10 · Minor
- Est. fire insurance / yr
- $783 – $1,453
Heat risk 6/10 · Moderate
- Hot days now (above 104°F)
- 7 days/yr
- Hot days in 30 yrs
- 17 days/yr
Wind risk 2/10 · Minimal
- Chance of severe wind over 30 yrs
- 1.0%
Air-quality risk 4/10 · Minor
- Unhealthy air days now
- 4 days/yr
- Unhealthy air days in 30 yrs
- 4 days/yr
Risk factors via First Street. Map © Google.
Why this score? — see what drove the D+ grade
The composite is a weighted blend of 9 inputs, each scored 0–100. Each bar is that input's sub-score; the figure is the points it added to the 100-point composite (weight × sub-score).
- Cash flow +20.6/30.0
- DSCR +6.6/10.0
- 1% rule +4.5/10.0
- Schools +4.5/10.0
- Livability +3.5/5.0
- ARV discount +3.0/15.0
- Rent growth +2.7/5.0
- Condition / age +2.5/5.0
- Appreciation +0.0/10.0
$159,900
🖨 Deal sheet 📄 Offer letter ✓ Due diligence
Listing remarks
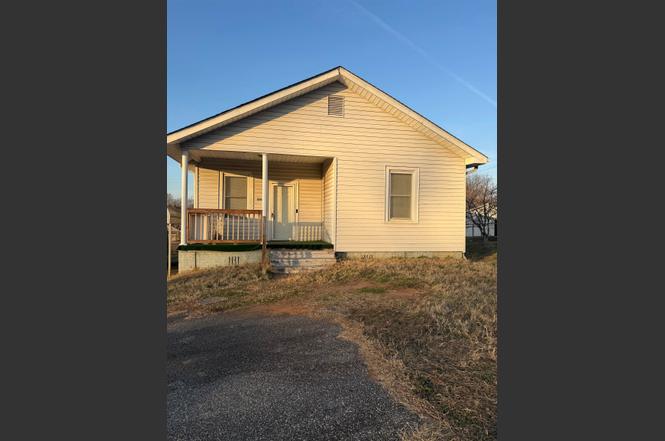
If you’re searching for an affordable home or fixer-upper in Boiling Springs, South Carolina with strong investment potential, 1261 Upper Valley Falls Rd, Boiling Springs SC 29316 is a property worth exploring. This 2-bedroom, 1-bath home offers 892 square feet of functional living space with a layout that is easy to personalize, making it ideal for investors, first-time buyers, or anyone looking to build equity through renovation. The living area features a cozy fireplace that adds charm and character, while the updated bathroom provides a valuable head start on improvements. Outside, the home sits on a fenced yard with a deck for outdoor living and entertaining, a two-car carport fo
Key facts
- Fenced yard
- Two-car carport
- Cozy fireplace
Tags
Property features AI
Finance
- Financial info: Annual tax amount approximately $1,029
Exterior
- Parking: Attached or detached 2-car garage
- Home design: Single-family residence; Residential property; One story
- Construction: Vinyl siding construction
- Exterior features: Vinyl siding; Lot approximately 0.33 acres; Subdivision: Valley Falls Rd
Interior
- Bathrooms: 1 full bathroom
- Interior features: One-level living
Neighborhood map
What this means for you Summary
Snapshot
- This is a 2-bed/1.0-bath single-family listed at $160k.
Deal economics
- At list price, monthly cash flow is $214 ($3k/yr) — positive.
- The deal already cash-flows at list — no discount required.
- To meet the 1% rule (rent ≥ 1% of price), the offer needs to be $153k (4.6% below list).
- Recommended offer: $146k (9.0% below list) — sets the bar for market timing.
- Cap rate 7.9% vs local median 3.9% in Valley Falls — top-decile yield for the area; either an underpriced asset or a hidden risk that comps aren't pricing in. Stress-test before assuming the spread holds.
Location & tenants
- Location reads 69/100 on livability (#72 in SC) — a middle-class / working-renter tenant base. Strengths: cost of living A+, housing A-; Watch: crime C-, amenities F, employment D-.
- Spartanburg 02 (suburban): math 49% / reading 56% proficiency, ranked #6 of 80 in SC (top 8%) — acceptable for families but not a draw, mixed tenant base, ~2y average lease.
- Zoned schools: James H. Hendrix Elementary (math 55% / reading 45%, grade D+, #163 of 597 statewide, top 28%, 694 students, 89% FRL); Boiling Springs Middle (math 39% / reading 50%, grade D, #52 of 229 statewide, top 23%, 1,068 students, 70% FRL); Boiling Springs High (math 62% / reading 88%, grade A-, #37 of 196 statewide, top 18%, 2,671 students, 60% FRL) — zoned schools average 73% FRL vs 44% district-wide (28 pts higher); higher-poverty schools than district average — tighter screening recommended.
- Market conditions: Rents flat; 460 active listings in the ZIP; 4 comparable units currently listed for rent nearby; rentals at typical pace (median 21d on market — plan ~3-4 weeks tenant-placement turnaround); 3,129 units permitted in Spartanburg County in 2024 (40 in 5+ unit buildings).
Forward outlook
- Local home prices are declining (-3.0%/yr); year-one equity from $1k of loan paydown is wiped out by about $5k of value loss. Plan a longer hold.
- Spartanburg County population projected at +18% by 2050 — long-run rental-demand tailwind backs the buy-and-hold thesis.
Negotiation context
- It's been on market 117 days — a 9% lower offer ($146k) is reasonable based on typical stale-listing flexibility.
- 2 sale attempts since 3y ago with the ask held roughly flat each time — persistent listings suggest the price (not the market) is what's stuck; bring a comps-based counter.
Risks & watch-outs
- Watch-outs: built in 1926 — expect roof / HVAC / electrical / plumbing capex.
- Climate carrying-cost: extreme-heat days projected 7→17/yr by 2055 (HVAC capex compounding) — expect insurance premiums to compound above CPI over the hold.
Questions for the listing agent
- It's been on market 117 days. Have you received any prior offers? Is the seller open to a 9% concession, seller financing, or rate buy-down credit?
- Built in 1926 — when were the roof, HVAC, electrical panel, plumbing, and water heater last replaced?
- Why hasn't it sold? Are there any deal-killer items the seller is aware of (foundation, flood, title, zoning, code violations)?
- Is there a deadline driving the sale (1031 exchange, divorce, estate, relocation)? That informs how much negotiation room exists.
- Schools are F-rated, which usually means shorter tenancies and higher turnover. Who's the typical renter profile here, and what's been the actual vacancy rate?
- The area grade is low — what's the realistic commute time and amenity access for the typical tenant pool here? Any planned neighborhood developments (good or bad) we should know about?
- What's the average days-on-market for RENTAL listings here right now (not sales)? A rising rental-DOM trend means longer vacancies and softer asking-rent achievability than the comps imply.
- What's the recent tenant-quality profile in this submarket — average credit score on applications, eviction rate, late-payment / NSF rate, and stable-employment percentage? A property-management company in the area should have these aggregated.
- How much new for-sale + rental construction is in the pipeline within 1–3 miles? Heavy new supply typically softens prices + rents 12–24 months out; constrained supply supports both.
Investment metrics
- 1% rule
- 0.95% ✗
- Cap rate
- 7.90%
- Cash-on-cash
- 5.74%
- DSCR
- 1.26
- GRM
- 8.7
CMA / ARV
- ARV (on-the-fly)
- $145,396
- Comps found
- 4
Show comp detail 4 sales within ~0.75 mi
| Address | Dist | Beds/Ba | Sqft | Sold | Price | $/sf | Match |
|---|---|---|---|---|---|---|---|
| 1261 Upper Valley Falls Rd Rd | 0.00mi | 2/1.0 | 892 (0%) | 1mo | $161,000 | $180 | 99 |
| 8231 Second St | 0.04mi | 2/1.0 | 946 (+6%) | 20mo | $130,000 | $137 | 72 |
| 8145 Hill St | 0.46mi | 2/1.0 | 860 (-4%) | 6mo | $68,000 | $79 | 67 |
| 8173 9th St | 0.47mi | 1/1.0 (-1) | 765 (-14%) | 13mo | $125,000 | $163 | 39 |
Match score weights: distance 35% · size 25% · config 20% · recency 20%. Top-matched comps best support the ARV.
Projected returns pro-forma
-3.0% appreciation · 0.69% rent growth · sell at horizon
- IRR
- -9.9%
- Equity multiple
- 0.65×
- Total profit
- $-15,780
- Equity at exit
- $23,842
- IRR
- -3.7%
- Equity multiple
- 0.78×
- Total profit
- $-9,942
- Equity at exit
- $13,825
Cash invested: $44,772 (down + closing). Projections, not guarantees.
Landlord ↔ Tenant lean methodology
- Overall (STATE)
- 90 Strongly Landlord-Friendly
- State South Carolina
- 90 Strongly Landlord-Friendly · R+6
- County
- — inherits STATE
- City
- — inherits STATE
ZIP-level market 29316
- Home prices YoY
- -18.9%
- Rents YoY
- 0.7%
- Active inventory
- 460
- Price-to-rent
- 8.7×
Monthly cashflow live
- Estimated rent
- $1,526 medium interval (Pro) →
- Mortgage (P&I)
- −$839
- Tax from tax record
- −$86 /mo · $1,030/yr
- Insurance
- −$67
- HOA
- −$0
- Vacancy / Maint / Mgmt
- −$320
- Net cashflow
- $214
Break-even live
UW: 25.0% down · 7.5% · 30yr · 1.5% tax · 5.0% vac · 8.0% maint · 8.0% mgmt
Financing live
Cash to close
- Down payment
- $39,975
- Closing costs
- $4,797
- Reserves months
- —
- Total cash needed
- —
Loan-product check · same deal, 3 products live
Conventional
25% down · 7.5% · 30yr
- Down + closing
- —
- Monthly P&I
- —
- Monthly cashflow
- —
- DSCR
- —
- Eligible?
- —
Personal DTI + credit; lowest rate.
DSCR
20% down · 8.5% · 30yr
- Down + closing
- —
- Monthly P&I
- —
- Monthly cashflow
- —
- DSCR
- —
- Eligible?
- —
No personal income docs; deal must DSCR.
Hard money
10% down · 12.0% · 12mo
- Down + closing
- —
- Monthly P&I
- —
- Monthly cashflow
- —
- DSCR
- —
- Eligible?
- —
Short-term bridge; refi at stabilization.
Rent comps 4 comps
| Address | Beds | Baths | Sqft | Rent | $/sqft | DOM | Units | Dist |
|---|---|---|---|---|---|---|---|---|
| 14 Wedgefield Dr Boiling Springs, SC | 2.0 | 1.0 | 891 | $1,390 | $1.56 | 20d | 1 | 0.73mi |
| 602 Laconia Cir Spartanburg, SC | 2.0 | 2.0 | 826 | $1,988 | $2.41 | 20d | 5 | 1.11mi |
| 120 Perry Dr Boiling Springs, SC | 2.0 | 2.5 | 1025 | $1,499 | $1.46 | 20d | 1 | 1.11mi |
| 1000 Pinegate Dr Spartanburg, SC | 1.0–4.0 | 1.0–4.0 | 1097 | $1,200 | $1.09 | 20d | 10 | 1.19mi |
Listing history 10 events
-
2026-05-01status Pending
-
2026-03-16price $159,900
-
2026-02-10price $162,000
-
2026-01-13price $165,000
-
2026-01-03$167,500 Active
-
2023-07-14soldstatus $146,500
-
2023-02-06historical
-
2023-01-25price $130,000
-
2023-01-17soldstatus $60,000
-
2023-01-16$137,500 Active
ⓘ Source: listings_history table (triggers on properties + properties_extension) + one-shot
backfill from property_details.listing_events for pre-trigger history.
Tax reassessment forecast SC · Resets to sale price
- Current annual tax
- $1,030 · $86/mo
- Projected year-2 tax
- $1,030 · $86/mo
- Expected delta
- $0/yr ($0/mo · 0.0%)
ⓘ Screening estimate from a state-policy table — verify with the county assessor before closing.
Climate risk First Street
- Flood 1/10 Low FEMA zone X (unshaded) · 0% chance over 30 yrs
- Wildfire 4/10 Moderate
- Heat 6/10 Major 7 d/yr ≥104°F today · 17 d/yr by 30 yrs out
- Wind 2/10 Low 100% chance of damaging wind over 30 yrs
- Air quality 4/10 Moderate 4 unhealthy d/yr today · 4 by 30 yrs out
Nearby sold comps map
Loading sold comps map…
Walkable amenities ~0.75 mi
Loading nearby amenities…
Taxation est. · year 1
- Rental income
- $18,307
- − Mortgage interest
- −$8,957
- − Property taxes
- −$1,030
- − Insurance
- −$800
- − Repairs & maintenance
- −$1,465
- − Management
- −$1,465
- − Depreciation
- −$4,652
- Taxable loss
- −$60
- Est. tax savings @ 24.0%
- +$14
- After-tax cash flow
- $2,585/yr
For passive investors: Depreciation is non-cash, so a rental often shows a tax loss while cash-flowing — sheltering income. Rental losses are passive: they offset passive income freely, and up to $25,000/yr can offset ordinary (W-2) income if you actively participate and your MAGI is under $100k (phasing out to $0 by $150k); unused losses carry forward. On sale, claimed depreciation is recaptured at up to 25%, and gains may owe capital-gains tax (a 1031 exchange can defer both). Figures are a year-1 estimate at your 24.0% rate — not tax advice; consult a CPA.
Schools (NCES district)
- District
- Spartanburg 02
- NCES district ID
- 4503510
- Math proficiency
- 49% ▼ -7.00%
- Reading proficiency
- 56% ▲ 2.00%
- Median HH income
- $49,591
- Composite
- 44.79/100
- National rank
- #2742
- State rank
- #6 of 80 in SC
Livability — Valley Falls
- Score
- 69/100
- State rank
- #72
- US rank
- #8644
Category grades
Schools grade is shown separately in the Schools card above.
Census & demographics
- Census place
- Valley Falls, SC
- County
- Spartanburg County · 258,607 people
- City population
- 28,009
- Metro
- Spartanburg, SC
- Population (ZIP)
- 33,104
- Household income
- $74,735
- Rent vs Own
- Severe rent burden
- 524.0
Population outlook (Spartanburg County) Hauer SSP2
- Today (2025)
- 325,495 people
- By 2030
- 338,800 · +4.1%
- By 2040
- 363,471 · +11.7%
- By 2050
- 384,156 · +18.0%
- By 2075
- 430,137 · +32.1%
- By 2100
- 442,733 · +36.0%
Race, ethnicity, and origin ACS 2023
- Neighborhood character
- Predominantly White (72%)
- Race & ethnicity
- White 72% Black 15% Two or more races 6% Hispanic / Latino 5% Asian 4%
- Hispanic origin (detail)
- Mexican 3%
- Common ancestry
- Slovak 3% Subsaharan African 3% Scotch-Irish 2%
- Foreign-born
- 11% · Canada, Jamaica
- Languages at home
- 84% English-only · Russian/Polish/Slavic 7% Spanish 5% Other Asian/Pacific 2%
Political lean MEDSL · Spartanburg
- 2024 margin
- Solid R (+33.6) · D 32.6% · R 66.2% · Other 1.2%
- 2008→2024 swing
- -12.0pp toward R · 2008: -21.6pp · 2024: -33.6pp
- All cycles
- 2024: R+33.6 2020: R+27.3 2016: R+30.0 2012: R+23.1 2008: R+21.6
Not yet ingested
- Civics
- —
Market trends
- HPI YoY
- ▼ -51.42%
- Current HPI
- 220.8438
- Rent YoY
- ▲ 0.69%
- Metro
- Spartanburg, SC
- State GDP YoY
- ▲ 4.51%
- F500 in state
- 2
Industry mix (Fortune 500 HQ in SC)
| Industry | F500 HQs | Revenue |
|---|---|---|
| Packaging | 1 | $7B |
|
||
Price history
+16.3% since first listed10 events — show timeline
- 2026-05-01 Pending — SPMLS
- 2026-03-16 Price Changed $159,900 SPMLS
- 2026-02-10 Price Changed $162,000 SPMLS
- 2026-01-13 Price Changed $165,000 SPMLS
- 2026-01-03 Listed $167,500 SPMLS
- 2023-07-14 Sold (Public Records) $146,500 Public Records
- 2023-02-06 Delisted — SPMLS
- 2023-01-25 Price Changed $130,000 SPMLS
- 2023-01-17 Sold (Public Records) $60,000 Public Records
- 2023-01-16 Listed $137,500 SPMLS
Property tax history
+9.2%/yrLatest (2025): $1,030 · +1.6% YoY. Source: county tax records.
Cash-flow waterfall
monthlySold comps — $/sqft
last 12 mo · ≤1 miLoading sold comps…