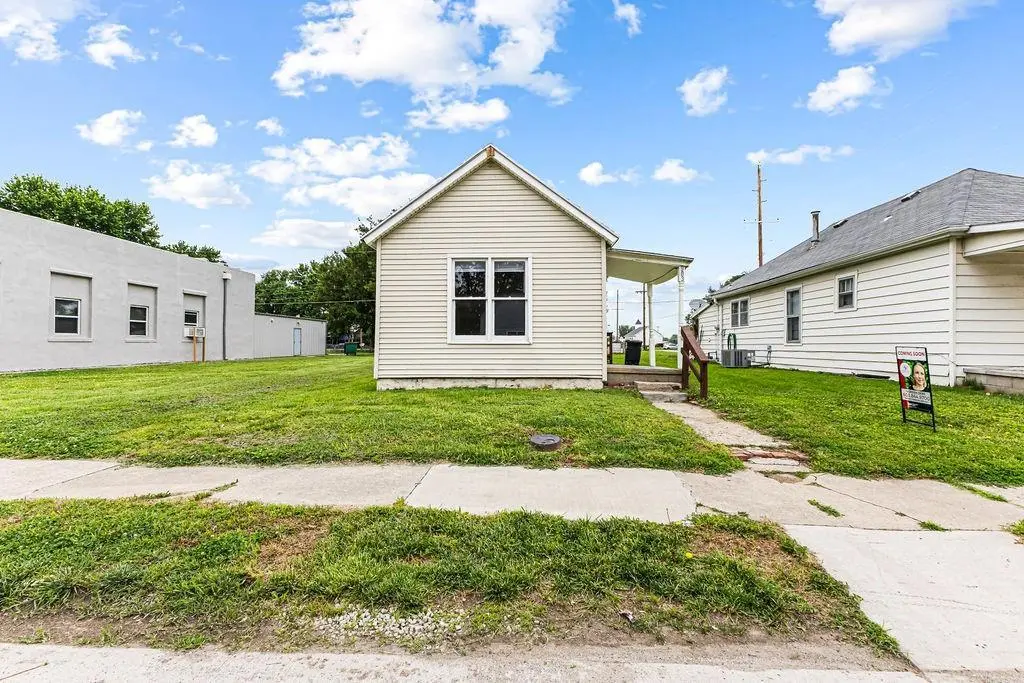
903 W Valley St · St. Joseph, MO
Flood risk 4/10 · Minor
- FEMA flood zone
- X (shaded)
- Chance of flooding over 30 yrs
- 0.24%
- Est. flood insurance / yr
- $473 – $860
Fire risk 1/10 · Minimal
- Est. fire insurance / yr
- $1,054 – $1,958
Heat risk 4/10 · Minor
- Hot days now (above 107°F)
- 7 days/yr
- Hot days in 30 yrs
- 16 days/yr
Wind risk 2/10 · Minimal
- Chance of severe wind over 30 yrs
- —
Air-quality risk 2/10 · Minimal
- Unhealthy air days now
- 0 days/yr
- Unhealthy air days in 30 yrs
- 1 days/yr
Risk factors via First Street. Map © Google.
Why this score? — see what drove the B grade
The composite is a weighted blend of 9 inputs, each scored 0–100. Each bar is that input's sub-score; the figure is the points it added to the 100-point composite (weight × sub-score).
- Cash flow +30.0/30.0
- ARV discount +15.0/15.0
- DSCR +10.0/10.0
- 1% rule +8.7/10.0
- Schools +2.8/10.0
- Rent growth +2.5/5.0
- Livability +2.5/5.0
- Condition / age +2.5/5.0
- Appreciation +0.0/10.0
$60,000
🖨 Deal sheet 📄 Offer letter ✓ Due diligence
Listing remarks MLS
Step inside this recently updated and freshly finished one-bedroom, one-bath home that’s move-in ready and full of charm. Whether you’re looking for the perfect starter home or a smart investment property, this residence checks all the boxes. Thoughtful updates bring a modern touch, while its manageable size makes upkeep simple. Don’t miss the chance to own a low-maintenance home with strong potential.
Key facts
- 3,920 sq ft lot
- Built 1902
- Listed 22 days
Property features AI
Finance
- Other: Lot approximately 3,920 square feet
- HOA & community: No association fees
Exterior
- Parking: Other parking
- Utilities: Public water; Public sewer
- Home design: Single-family residence; Residential property; Bungalow; Approximately 732 above-grade living area
- Construction: Vinyl siding; Composition roof
- Exterior features: City lot; Paved public road access; Not in a flood plain
Interior
- Kitchen: Eat-in kitchen
- Bedrooms: 1 bedroom (main floor)
- Flooring: Carpet; Laminate
- Bathrooms: 1 full bath
- Heating & cooling: Wall furnace heating; Window air conditioning unit(s)
- Interior features: Painted cabinets; Bungalow floor plan
- Laundry & utility: Laundry in bathroom on main level
Neighborhood map
What this means for you Summary
Snapshot
- This is a 1-bed/1.0-bath single-family listed at $60k.
Deal economics
- At list price, monthly cash flow is $283 ($3k/yr) — positive.
- The deal already cash-flows at list — no discount required.
- Meets the 1% rule at list price ($820 rent vs $60k).
- Recommended offer: $59k (1.5% below list) — sets the bar for market timing.
- Cap rate 12.0% vs local median 4.7% in St. Joseph — top-decile yield for the area; either an underpriced asset or a hidden risk that comps aren't pricing in. Stress-test before assuming the spread holds.
Location & tenants
- Location reads: area grade B — affects rentability + tenant quality, not the cash-flow math above.
- St. Joseph (urban): math 28% / reading 38% proficiency, ranked #241 of 324 in MO (top 74%) — families likely to look elsewhere, expect single-tenant / working-renter base with shorter leases.
- Zoned schools: Hosea Elem. (math 12% / reading 21%, grade F, #980 of 1,115 statewide, top 88%, 438 students, 99% FRL); Benton High (math 22% / reading 42%, grade F, #356 of 521 statewide, top 71%, 676 students, 44% FRL) — zoned schools average 72% FRL vs 53% district-wide (19 pts higher); higher-poverty schools than district average — tighter screening recommended.
- Market conditions: 54 active listings in the ZIP; 70 units permitted in Buchanan County in 2024 (0 in 5+ unit buildings).
Forward outlook
- Local home prices are declining (-3.0%/yr); year-one equity from $415 of loan paydown is wiped out by about $2k of value loss. Plan a longer hold.
- Buchanan County population projected to shrink 6% by 2050 — rents likely to lag national; underwrite the cash flow, not the appreciation.
- At projected returns (-3.0% appreciation + 3.0% rent growth), your $17k cash investment doubles in ~7 years — after that, you're playing with house money.
Negotiation context
- It's been on market 23 days — a 2% lower offer ($59k) is reasonable based on typical stale-listing flexibility.
- 4 sale attempts since 2y ago; this cycle's ask has dropped $5k (8%) from the opening price — seller is motivated, your offer sets the floor, not the list.
Risks & watch-outs
- Watch-outs: built in 1902 — expect roof / HVAC / electrical / plumbing capex.
Questions for the listing agent
- Built in 1902 — when were the roof, HVAC, electrical panel, plumbing, and water heater last replaced?
- Is there a deadline driving the sale (1031 exchange, divorce, estate, relocation)? That informs how much negotiation room exists.
- What's the average days-on-market for RENTAL listings here right now (not sales)? A rising rental-DOM trend means longer vacancies and softer asking-rent achievability than the comps imply.
- What's the recent tenant-quality profile in this submarket — average credit score on applications, eviction rate, late-payment / NSF rate, and stable-employment percentage? A property-management company in the area should have these aggregated.
- How much new for-sale + rental construction is in the pipeline within 1–3 miles? Heavy new supply typically softens prices + rents 12–24 months out; constrained supply supports both.
Investment metrics
- 1% rule
- 1.37% ✓
- Cap rate
- 11.95%
- Cash-on-cash
- 20.21%
- DSCR
- 1.90
- GRM
- 6.1
CMA / ARV
- ARV (on-the-fly)
- $93,696
- Comps found
- 12
Show comp detail 12 sales within ~0.75 mi
| Address | Dist | Beds/Ba | Sqft | Sold | Price | $/sf | Match |
|---|---|---|---|---|---|---|---|
| 903 W Valley St | 0.00mi | 1/1.0 | 732 (0%) | 7mo | $54,900 | $75 | 94 |
| 930 W Cliff St | 0.16mi | 2/1.0 (+1) | 700 (-4%) | 0mo | $109,900 | $157 | 80 |
| 6315 Washington St | 0.28mi | 2/1.0 (+1) | 740 (+1%) | 10mo | $95,000 | $128 | 72 |
| 6507 Sherman St | 0.23mi | 2/1.0 (+1) | 678 (-7%) | 1mo | $115,000 | $170 | 71 |
| 418 Massachusetts St | 0.48mi | 2/1.0 (+1) | 728 (-0%) | 2mo | $48,000 | $66 | 70 |
| 123 W Valley St | 0.49mi | 2/1.0 (+1) | 720 (-2%) | 1mo | $65,000 | $90 | 68 |
| 6311 Grant St | 0.22mi | 1/1.0 | 644 (-12%) | 4mo | $65,000 | $101 | 66 |
| 1712 Martha St | 0.61mi | 2/1.0 (+1) | 725 (-1%) | 1mo | $100,000 | $138 | 64 |
| 6322 Morris St | 0.61mi | 1/1.0 | 650 (-11%) | 1mo | $106,900 | $164 | 52 |
| 6321 Grant St | 0.23mi | 2/1.0 (+1) | 838 (+14%) | 10mo | $144,900 | $173 | 52 |
| 224 W Hyde Park Ave | 0.41mi | 2/1.0 (+1) | 840 (+15%) | 1mo | $68,000 | $81 | 50 |
| 206 Hammond St | 0.70mi | 2/1.0 (+1) | 834 (+14%) | 4mo | $107,000 | $128 | 36 |
Match score weights: distance 35% · size 25% · config 20% · recency 20%. Top-matched comps best support the ARV.
Projected returns pro-forma
-3.0% appreciation · 3.0% rent growth · sell at horizon
- IRR
- 12.4%
- Equity multiple
- 1.49×
- Total profit
- $8,282
- Equity at exit
- $8,946
- IRR
- 21.3%
- Equity multiple
- 2.81×
- Total profit
- $30,345
- Equity at exit
- $5,188
Cash invested: $16,800 (down + closing). Projections, not guarantees.
Landlord ↔ Tenant lean methodology
- Overall (STATE)
- 81 Strongly Landlord-Friendly
- State Missouri
- 81 Strongly Landlord-Friendly · R+10
- County
- — inherits STATE
- City
- — inherits STATE
ZIP-level market 64504
- Active inventory
- 54
- Price-to-rent
- 6.1×
Monthly cashflow live
- Estimated rent
- $820 medium interval (Pro) →
- Mortgage (P&I)
- −$315
- Tax from tax record
- −$25 /mo · $299/yr
- Insurance
- −$25
- HOA
- −$0
- Vacancy / Maint / Mgmt
- −$172
- Net cashflow
- $283
Break-even live
UW: 25.0% down · 7.5% · 30yr · 1.5% tax · 5.0% vac · 8.0% maint · 8.0% mgmt
Financing live
Cash to close
- Down payment
- $15,000
- Closing costs
- $1,800
- Reserves months
- —
- Total cash needed
- —
Loan-product check · same deal, 3 products live
Conventional
25% down · 7.5% · 30yr
- Down + closing
- —
- Monthly P&I
- —
- Monthly cashflow
- —
- DSCR
- —
- Eligible?
- —
Personal DTI + credit; lowest rate.
DSCR
20% down · 8.5% · 30yr
- Down + closing
- —
- Monthly P&I
- —
- Monthly cashflow
- —
- DSCR
- —
- Eligible?
- —
No personal income docs; deal must DSCR.
Hard money
10% down · 12.0% · 12mo
- Down + closing
- —
- Monthly P&I
- —
- Monthly cashflow
- —
- DSCR
- —
- Eligible?
- —
Short-term bridge; refi at stabilization.
Listing history 30 events
-
2026-06-19days on market $60,000 Active 23 DOM
-
2026-06-18days on market $60,000 Active 22 DOM
-
2026-06-17days on market $60,000 Active 21 DOM
-
2026-06-16days on market $60,000 Active 20 DOM
-
2026-06-15days on market $60,000 Active 19 DOM
-
2026-06-14days on market $60,000 Active 17 DOM
-
2026-06-12days on market $60,000 Active 16 DOM
-
2026-06-09days on market $60,000 Active 13 DOM
-
2026-06-08days on market $60,000 Active 12 DOM
-
2026-06-07days on market $60,000 Active 11 DOM
-
2026-06-03days on market $60,000 Active 7 DOM
-
2026-06-02days on market $60,000 Active 6 DOM
-
2026-06-01days on market $60,000 Active 5 DOM
-
2026-05-31days on market $60,000 Active 4 DOM
-
2026-05-30days on market $60,000 Active 3 DOM
-
2026-05-29status Active
-
2026-05-29price $60,000
-
2026-04-30historical
-
2026-04-30$65,000 Active
-
2026-04-05historical $65,000
-
2025-11-12soldstatus
-
2025-11-11soldstatus Closed 423-char remark
Show marketing remark (423 chars)
Step inside this recently updated and freshly finished one-bedroom, one-bath home that’s move-in ready and full of charm. Whether you’re looking for the perfect starter home or a smart investment property, this residence checks all the boxes. Thoughtful updates bring a modern touch, while its manageable size makes upkeep simple. Don’t miss the chance to own a low-maintenance home with strong potential.
-
2025-10-06historical Active Under Contract 423-char remark
Show marketing remark (423 chars)
Step inside this recently updated and freshly finished one-bedroom, one-bath home that’s move-in ready and full of charm. Whether you’re looking for the perfect starter home or a smart investment property, this residence checks all the boxes. Thoughtful updates bring a modern touch, while its manageable size makes upkeep simple. Don’t miss the chance to own a low-maintenance home with strong potential.
-
2025-09-30$54,900 Active 423-char remark
Show marketing remark (423 chars)
Step inside this recently updated and freshly finished one-bedroom, one-bath home that’s move-in ready and full of charm. Whether you’re looking for the perfect starter home or a smart investment property, this residence checks all the boxes. Thoughtful updates bring a modern touch, while its manageable size makes upkeep simple. Don’t miss the chance to own a low-maintenance home with strong potential.
-
2024-03-16historical $800
-
2024-03-13$800
-
2021-08-12soldstatus
-
2016-08-08soldstatus
-
2016-08-08soldstatus
-
1990-09-10soldstatus
ⓘ Source: listings_history table (triggers on properties + properties_extension) + one-shot
backfill from property_details.listing_events for pre-trigger history.
Tax reassessment forecast MO · Resets to sale price
- Current annual tax
- $299 · $25/mo
- Projected year-2 tax
- $582 · $48/mo
- Expected delta
- +$283/yr (+$24/mo · 94.8%)
ⓘ Screening estimate from a state-policy table — verify with the county assessor before closing.
Climate risk First Street
- Flood 4/10 Moderate FEMA zone X (shaded) · 24% chance over 30 yrs
- Wildfire 1/10 Low
- Heat 4/10 Moderate 7 d/yr ≥107°F today · 16 d/yr by 30 yrs out
- Wind 2/10 Low
- Air quality 2/10 Low 0 unhealthy d/yr today · 1 by 30 yrs out
Nearby sold comps map
Loading sold comps map…
Walkable amenities ~0.75 mi
Loading nearby amenities…
Taxation est. · year 1
- Rental income
- $9,836
- − Mortgage interest
- −$3,361
- − Property taxes
- −$299
- − Insurance
- −$300
- − Repairs & maintenance
- −$787
- − Management
- −$787
- − Depreciation
- −$1,745
- Taxable income
- $2,557
- Est. tax owed @ 24.0%
- −$614
- After-tax cash flow
- $2,782/yr
For passive investors: Depreciation is non-cash, so a rental often shows a tax loss while cash-flowing — sheltering income. Rental losses are passive: they offset passive income freely, and up to $25,000/yr can offset ordinary (W-2) income if you actively participate and your MAGI is under $100k (phasing out to $0 by $150k); unused losses carry forward. On sale, claimed depreciation is recaptured at up to 25%, and gains may owe capital-gains tax (a 1031 exchange can defer both). Figures are a year-1 estimate at your 24.0% rate — not tax advice; consult a CPA.
Schools (NCES district)
- District
- St. Joseph
- NCES district ID
- 2927060
- Math proficiency
- 28% ▼ -6.00%
- Reading proficiency
- 38% ▼ -1.00%
- Median HH income
- $43,007
- Composite
- 27.99/100
- National rank
- #6853
- State rank
- #241 of 324 in MO
Livability — St. Joseph
No livability data for this city. (Only ~50 U.S. cities are tracked.)
Census & demographics
- Census place
- St. Joseph, MO
- City population
- 44,382
- Population (ZIP)
- 10,286
Population outlook (Buchanan County) Hauer SSP2
- Today (2025)
- 89,041 people
- By 2030
- 88,401 · -0.7%
- By 2040
- 86,220 · -3.2%
- By 2050
- 83,603 · -6.1%
- By 2075
- 76,750 · -13.8%
- By 2100
- 67,623 · -24.1%
Race, ethnicity, and origin ACS 2023
- Neighborhood character
- Predominantly White (83%)
- Race & ethnicity
- White 83% Hispanic / Latino 9% Two or more races 7% Black 3% Native American 1%
- Hispanic origin (detail)
- Mexican 4% Cuban 2%
- Common ancestry
- Lithuanian 2% Romanian 2% Slovak 2%
- Foreign-born
- 4% · Canada
- Languages at home
- 94% English-only · Spanish 5%
Political lean MEDSL · Buchanan
- 2024 margin
- Strong R (+28.0) · D 35.2% · R 63.3% · Other 1.5%
- 2008→2024 swing
- -28.2pp toward R · 2008: 0.1pp · 2024: -28.0pp
- All cycles
- 2024: R+28.0 2020: R+24.6 2016: R+26.2 2012: R+8.7 2008: D+0.1
Not yet ingested
- Civics
- —
Market trends
- HPI YoY
- ▼ -100.84%
- Current HPI
- 149.9895
- Rent YoY
- —
- Metro
- —
- State GDP YoY
- ▲ 1.84%
- F500 in state
- 20
Industry mix (Fortune 500 HQ in MO)
| Industry | F500 HQs | Revenue |
|---|---|---|
| Healthcare | 1 | $163B |
|
||
| Insurance | 1 | $21B |
|
||
| Industrial Technology | 1 | $17B |
|
||
| Retail | 1 | $16B |
|
||
| Industrial Distribution | 1 | $10B |
|
||
| Utilities | 1 | $9B |
|
||
Price history
+9.3% since first listed15 events — show timeline
- 2026-05-29 Relisted — Heartland MLS as Distributed by MLS Grid
- 2026-05-29 Price Changed $60,000 Heartland MLS as Distributed by MLS Grid
- 2026-04-30 Listing Removed — Heartland MLS as Distributed by MLS Grid
- 2026-04-30 Listed $65,000 Heartland MLS as Distributed by MLS Grid
- 2026-04-05 Coming Soon $65,000 Heartland MLS as Distributed by MLS Grid
- 2025-11-12 Sold (Public Records) — Public Records
- 2025-11-11 Sold (MLS) — Heartland MLS as Distributed by MLS Grid
- 2025-10-06 Contingent — Heartland MLS as Distributed by MLS Grid
- 2025-09-30 Listed $54,900 Heartland MLS as Distributed by MLS Grid
- 2024-03-16 Rental Removed $800 APPFOLIO
- 2024-03-13 Listed for Rent $800 APPFOLIO
- 2021-08-12 Sold (Public Records) — Public Records
- 2016-08-08 Sold (Public Records) — Public Records
- 2016-08-08 Sold (Public Records) — Public Records
- 1990-09-10 Sold (Public Records) — Public Records
Property tax history
-3.1%/yrLatest (2025): $299 · +5.3% YoY. Source: county tax records.
Cash-flow waterfall
monthlySold comps — $/sqft
last 12 mo · ≤1 miLoading sold comps…