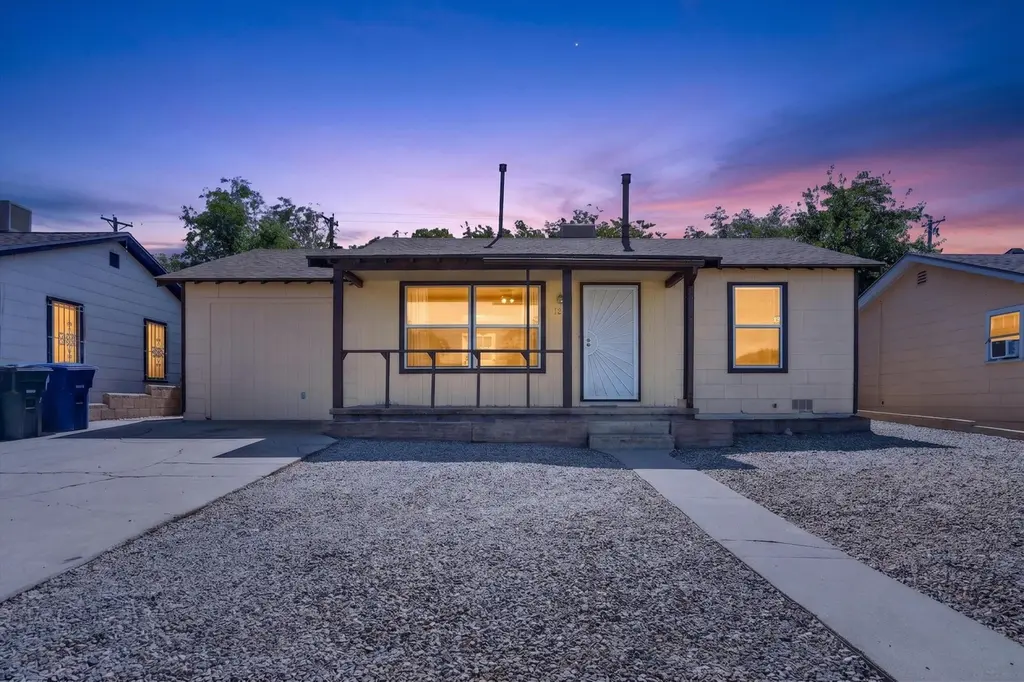
1308 Wilmoore Dr SE · Albuquerque, NM
Flood risk 1/10 · Minimal
- FEMA flood zone
- X (unshaded)
- Chance of flooding over 30 yrs
- 0.0%
- Est. flood insurance / yr
- $507 – $1,088
Fire risk 1/10 · Minimal
- Est. fire insurance / yr
- $706 – $1,312
Heat risk 5/10 · Moderate
- Hot days now (above 95°F)
- 6 days/yr
- Hot days in 30 yrs
- 15 days/yr
Wind risk 1/10 · Minimal
- Chance of severe wind over 30 yrs
- —
Air-quality risk 2/10 · Minimal
- Unhealthy air days now
- 1 days/yr
- Unhealthy air days in 30 yrs
- 3 days/yr
Risk factors via First Street. Map © Google.
Why this score? — see what drove the D grade
The composite is a weighted blend of 9 inputs, each scored 0–100. Each bar is that input's sub-score; the figure is the points it added to the 100-point composite (weight × sub-score).
- Cash flow +12.6/30.0
- ARV discount +7.5/15.0
- Schools +5.3/10.0
- DSCR +3.8/10.0
- Livability +3.6/5.0
- 1% rule +2.6/10.0
- Rent growth +2.6/5.0
- Condition / age +2.5/5.0
- Appreciation +0.0/10.0
$269,900
🖨 Deal sheet 📄 Offer letter ✓ Due diligence
Listing remarks
Rare opportunity to own a 4-bedroom home under $300K in UNM South. Refinished wood floors, fresh interior paint, abundant natural light, & a flexible floor plan create a warm, inviting feel. The primary suite features a kiva fireplace, wood viga ceiling, and direct patio access. Three of four bedrooms offer larger walk-in closets, while ceiling fans throughout enhance comfort. Wood floors in living areas/3BDRM's, tile in wet areas, and laminate wood-look flooring in the fourth bedroom. Covered front porch, rear patio, pantry, and exterior doors keyed alike. Approx. half a mile from University Stadium and minutes from UNM, Nob Hill, dining, parks, and entertainment. Character, space, an
Key facts
- Wood viga ceiling
- Flexible floor plan
- Kiva fireplace
Tags
Property features AI
Finance
- Other:
- Financial info:
- HOA & community:
Exterior
- Parking:
- Security:
- Utilities: Electricity connected; Natural gas connected; Public water; Public sewer
- Home design: Single-story home; Entry level: 1; Faces west; Resale property
- Construction: Built (year source: appraiser); Frame and stucco construction; Shingle roof; Permanent foundation
- Exterior features: Covered patio; Patio; Shed(s); Back yard fencing; Landscaped lot with few trees; City street frontage (paved)
Interior
- Kitchen: Dishwasher; Free‑standing gas range
- Bedrooms: Up to 4 bedrooms possible (main level noted)
- Flooring: Laminate; Tile; Wood
- Bathrooms: 2 full bathrooms
- Heating & cooling: Forced air heating (natural gas); Evaporative cooling
- Interior features: Beamed ceilings; Ceiling fan(s); Main level primary suite; Walk-in closet(s); Metal and wood window frames
- Laundry & utility: Electric dryer hookup
Neighborhood map
What this means for you Summary
Snapshot
- This is a 4-bed/2.0-bath other listed at $270k.
Deal economics
- At list price, monthly cash flow is $-35 ($-421/yr) — negative.
- To cash-flow at today's rent, offer at most $264k (2.3% below list).
- To meet the 1% rule (rent ≥ 1% of price), the offer needs to be $205k (24.1% below list).
- Recommended offer: $205k (24.1% below list) — sets the bar for 1% rule.
- Cap rate 6.1% vs local median 3.7% in Albuquerque — top-decile yield for the area; either an underpriced asset or a hidden risk that comps aren't pricing in. Stress-test before assuming the spread holds.
Location & tenants
- Location reads 72/100 on livability (#13 in NM) — a middle-class / working-renter tenant base. Strengths: amenities A+, commute A+, cost of living A+; Watch: schools D-, crime F.
- Albuquerque Public Schools (urban): math 51% / reading 75% proficiency, ranked #3 of 29 in NM (top 10%) — acceptable for families but not a draw, mixed tenant base, ~2y average lease; 60% free/reduced lunch — lower-income household profile, screen leases tightly.
- Market conditions: Rents flat; 183 active listings in the ZIP; 9 comparable units currently listed for rent nearby; rentals lingering (median 44d on market — plan ~5-8 weeks vacancy on turnover, expect pricing pressure); 67% of comp listings sitting > 30 days — soft ceiling on asking rent; 1,316 units permitted in Bernalillo County in 2024 (546 in 5+ unit buildings).
- At $2,047/mo this rent would consume 49% of the median local household income ($50k/yr) (locally 2859% of renters already pay >50% of income on rent) — very limited rent-growth headroom before tenants either downsize or default.
Forward outlook
- Local home prices are declining (-3.0%/yr); year-one equity from $2k of loan paydown is wiped out by about $8k of value loss. Plan a longer hold.
Negotiation context
- Only 2 days on market — expect competitive offers; lowballing is unlikely to land.
Risks & watch-outs
- Watch-outs: built in 1950 — expect roof / HVAC / electrical / plumbing capex.
- Climate carrying-cost: extreme-heat days projected 6→15/yr by 2055 (HVAC capex compounding) — expect insurance premiums to compound above CPI over the hold.
Questions for the listing agent
- What do current leases actually rent for vs. the listed asking? Can we see a recent rent roll and the last 12 months of T-12 income?
- Built in 1950 — when were the roof, HVAC, electrical panel, plumbing, and water heater last replaced?
- Is there a deadline driving the sale (1031 exchange, divorce, estate, relocation)? That informs how much negotiation room exists.
- Schools are D-rated, which usually means shorter tenancies and higher turnover. Who's the typical renter profile here, and what's been the actual vacancy rate?
- Crime grade is F in this area — have there been break-ins, vandalism, or insurance claims at this property in the last 3 years? What carrier currently insures it and at what premium?
- The area grade is low — what's the realistic commute time and amenity access for the typical tenant pool here? Any planned neighborhood developments (good or bad) we should know about?
- What's the average days-on-market for RENTAL listings here right now (not sales)? A rising rental-DOM trend means longer vacancies and softer asking-rent achievability than the comps imply.
- What's the recent tenant-quality profile in this submarket — average credit score on applications, eviction rate, late-payment / NSF rate, and stable-employment percentage? A property-management company in the area should have these aggregated.
- How much new for-sale + rental construction is in the pipeline within 1–3 miles? Heavy new supply typically softens prices + rents 12–24 months out; constrained supply supports both.
Investment metrics
- 1% rule
- 0.76% ✗
- Cap rate
- 6.14%
- Cash-on-cash
- -0.56%
- DSCR
- 0.98
- GRM
- 11.0
CMA / ARV
No comps found within radius.
Projected returns pro-forma
-3.0% appreciation · 0.5% rent growth · sell at horizon
- IRR
- -19.8%
- Equity multiple
- 0.32×
- Total profit
- $-51,093
- Equity at exit
- $40,243
- IRR
- -18.3%
- Equity multiple
- 0.11×
- Total profit
- $-67,383
- Equity at exit
- $23,336
Cash invested: $75,572 (down + closing). Projections, not guarantees.
Landlord ↔ Tenant lean methodology
- Overall (STATE)
- 55 Moderately Landlord-Leaning
- State New Mexico
- 55 Moderately Landlord-Leaning · D+3
- County
- — inherits STATE
- City
- — inherits STATE
ZIP-level market 87106
- Rents YoY
- 0.5%
- Active inventory
- 183
- Price-to-rent
- 11.0×
Monthly cashflow live
- Estimated rent
- $2,047 high interval (Pro) →
- Mortgage (P&I)
- −$1,415
- Tax from tax record
- −$125 /mo · $1,496/yr
- Insurance
- −$112
- HOA
- −$0
- Vacancy / Maint / Mgmt
- −$430
- Net cashflow
- $-35
Break-even live
UW: 25.0% down · 7.5% · 30yr · 1.5% tax · 5.0% vac · 8.0% maint · 8.0% mgmt
Financing live
Cash to close
- Down payment
- $67,475
- Closing costs
- $8,097
- Reserves months
- —
- Total cash needed
- —
Loan-product check · same deal, 3 products live
Conventional
25% down · 7.5% · 30yr
- Down + closing
- —
- Monthly P&I
- —
- Monthly cashflow
- —
- DSCR
- —
- Eligible?
- —
Personal DTI + credit; lowest rate.
DSCR
20% down · 8.5% · 30yr
- Down + closing
- —
- Monthly P&I
- —
- Monthly cashflow
- —
- DSCR
- —
- Eligible?
- —
No personal income docs; deal must DSCR.
Hard money
10% down · 12.0% · 12mo
- Down + closing
- —
- Monthly P&I
- —
- Monthly cashflow
- —
- DSCR
- —
- Eligible?
- —
Short-term bridge; refi at stabilization.
Rent comps 9 comps
| Address | Beds | Baths | Sqft | Rent | $/sqft | DOM | Units | Dist |
|---|---|---|---|---|---|---|---|---|
| 2124 Eton Ave SE Unit 1-F Albuquerque, NM | 3.0 | 2.0 | 1300 | $2,600 | $2.00 | 43d | 1 | 0.54mi |
| 2124 Eton Ave SE Albuquerque, NM | 3.0 | 2.0 | 1300 | $2,200 | $1.69 | 43d | 1 | 0.54mi |
| 3209 Burton Ave SE Unit 3219 1/2 Albuquerque, NM | 3.0 | 1.0 | 800 | $1,050 | $1.31 | 3d | 1 | 0.90mi |
| 2101 Elm St SE Apt A Albuquerque, NM | 3.0 | 1.5 | 1200 | $1,450 | $1.21 | 43d | 1 | 0.98mi |
| 2009 High St SE Unit B Albuquerque, NM | 4.0 | 1.5 | 1000 | $2,036 | $2.04 | 23d | 1 | 1.03mi |
| 301 Yale Blvd NE Unit PG3000412 Albuquerque, NM | 3.0 | 1.0 | 960 | $1,600 | $1.67 | 23d | 1 | 1.21mi |
| 3003 Transport St SE Albuquerque, NM | 5.0 | 1.0–5.0 | 1083 | $2,140 | $1.97 | 43d | 4 | 1.28mi |
| 423 Walter St SE Albuquerque, NM | 3.0 | 2.0 | 1420 | $2,599 | $1.83 | 43d | 1 | 1.42mi |
| 317 Morningside Dr SE Albuquerque, NM | 3.0 | 2.0 | 1322 | $2,200 | $1.66 | 43d | 1 | 1.46mi |
Listing history 4 events
-
2026-06-02status $269,900 Pending 2 DOM
-
2026-06-01days on market $269,900 Active 2 DOM
-
2026-05-31remarks 695-char remark
-
2026-05-31$269,900 Active 1 DOM
ⓘ Source: listings_history table (triggers on properties + properties_extension) + one-shot
backfill from property_details.listing_events for pre-trigger history.
Tax reassessment forecast NM · Resets to sale price
- Current annual tax
- $1,496 · $125/mo
- Projected year-2 tax
- $2,159 · $180/mo
- Expected delta
- +$663/yr (+$55/mo · 44.3%)
ⓘ Screening estimate from a state-policy table — verify with the county assessor before closing.
Climate risk First Street
- Flood 1/10 Low FEMA zone X (unshaded) · 0% chance over 30 yrs
- Wildfire 1/10 Low
- Heat 5/10 Major 6 d/yr ≥95°F today · 15 d/yr by 30 yrs out
- Wind 1/10 Low
- Air quality 2/10 Low 1 unhealthy d/yr today · 3 by 30 yrs out
Nearby sold comps map
Loading sold comps map…
Walkable amenities ~0.75 mi
Loading nearby amenities…
Taxation est. · year 1
- Rental income
- $24,569
- − Mortgage interest
- −$15,119
- − Property taxes
- −$1,496
- − Insurance
- −$1,350
- − Repairs & maintenance
- −$1,966
- − Management
- −$1,966
- − Depreciation
- −$7,852
- Taxable loss
- −$5,178
- Est. tax savings @ 24.0%
- +$1,243
- After-tax cash flow
- $822/yr
For passive investors: Depreciation is non-cash, so a rental often shows a tax loss while cash-flowing — sheltering income. Rental losses are passive: they offset passive income freely, and up to $25,000/yr can offset ordinary (W-2) income if you actively participate and your MAGI is under $100k (phasing out to $0 by $150k); unused losses carry forward. On sale, claimed depreciation is recaptured at up to 25%, and gains may owe capital-gains tax (a 1031 exchange can defer both). Figures are a year-1 estimate at your 24.0% rate — not tax advice; consult a CPA.
Schools (NCES district)
- District
- Albuquerque Public Schools
- NCES district ID
- 3500060
- Math proficiency
- 51% ▲ 30.00%
- Reading proficiency
- 75% ▲ 45.00%
- Median HH income
- $48,151
- Composite
- 53.29/100
- National rank
- #1487
- State rank
- #3 of 29 in NM
Livability — Albuquerque
- Score
- 72/100
- State rank
- #13
- US rank
- #6219
Category grades
Schools grade is shown separately in the Schools card above.
Census & demographics
- Census place
- Albuquerque, NM
- County
- Bernalillo County · 647,165 people
- City population
- 647,165
- Metro
- Albuquerque, NM
- Population (ZIP)
- 26,953
- Household income
- $49,781
- Rent vs Own
- Severe rent burden
- 2859.0
Population outlook (Bernalillo County) Hauer SSP2
- Today (2025)
- 704,528 people
- By 2030
- 711,723 · +1.0%
- By 2040
- 714,522 · +1.4%
- By 2050
- 709,274 · +0.7%
- By 2075
- 680,015 · -3.5%
- By 2100
- 619,879 · -12.0%
Race, ethnicity, and origin ACS 2023
- Neighborhood character
- Diverse neighborhood (Simpson 0.64)
- Race & ethnicity
- White 46% Hispanic / Latino 39% Two or more races 16% Native American 5% Asian 4% Black 3%
- Hispanic origin (detail)
- Mexican 24%
- Common ancestry
- Lithuanian 2% Slovak 2% Iranian 2%
- Foreign-born
- 12% · Canada, Vietnam, China
- Languages at home
- 77% English-only · Spanish 15% Other Indo-European 1% Vietnamese 1%
Political lean MEDSL · Bernalillo
- 2024 margin
- Strong D (+21.0) · D 59.2% · R 38.2% · Other 2.6%
- 2008→2024 swing
- -0.3pp no change · 2008: 21.4pp · 2024: 21.0pp
- All cycles
- 2024: D+21.0 2020: D+24.4 2016: D+17.8 2012: D+16.2 2008: D+21.4
Not yet ingested
- Civics
- —
Market trends
- HPI YoY
- ▼ -420.04%
- Current HPI
- 245.4275
- Rent YoY
- ▲ 0.50%
- Metro
- Albuquerque, NM
- State GDP YoY
- —
- F500 in state
- 0
Price history
2 events — show timeline
- 2026-04-28 Listed $269,900 Southwest MLS
- 2005-09-16 Sold (Public Records) — Public Records
Property tax history
+3.0%/yrLatest (2025): $1,496 · +3.2% YoY. Source: county tax records.
Cash-flow waterfall
monthlySold comps — $/sqft
last 12 mo · ≤1 miLoading sold comps…