 🏗️ New Construction
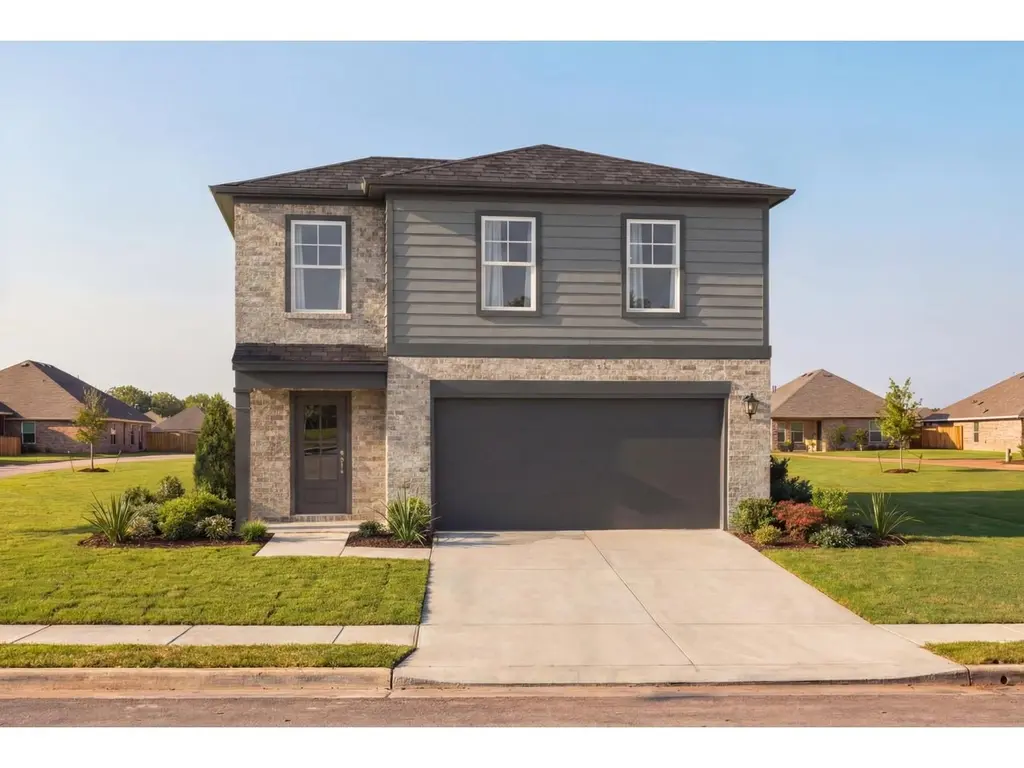
The Blanco F Plan · Kendleton, TX
Flood risk No data
- FEMA flood zone
- —
- Chance of flooding over 30 yrs
- —
- Est. flood insurance / yr
- —
Fire risk No data
- Est. fire insurance / yr
- —
Heat risk No data
- Hot days now (above threshold)
- —
- Hot days in 30 yrs
- —
Wind risk No data
- Chance of severe wind over 30 yrs
- —
Air-quality risk No data
- Unhealthy air days now
- —
- Unhealthy air days in 30 yrs
- —
Risk factors via First Street. Map © Google.
Why this score? — see what drove the C grade
The composite is a weighted blend of 9 inputs, each scored 0–100. Each bar is that input's sub-score; the figure is the points it added to the 100-point composite (weight × sub-score).
- Cash flow +18.9/30.0
- ARV discount +7.5/15.0
- Appreciation +7.1/10.0
- DSCR +6.0/10.0
- 1% rule +5.1/10.0
- Schools +4.6/10.0
- Condition / age +4.0/5.0
- Livability +3.1/5.0
- Rent growth +2.5/5.0
$294,990
🖨 Deal sheet 📄 Offer letter ✓ Due diligence
Listing remarks MLS
Welcome to The Blanco! This two-story home makes great use of space and amenities. On the main floor, you will find an open kitchen and family area as well as a mud room and laundry off the two-car garage. The primary suite is also on the main floor and features a large walk-in closet. Upstairs, there are three more bedrooms as well as an additional bathroom and cozy loft space. Make it your own with The Blanco's flexible floor plan. From additional garage space to a covered patio, you've got every opportunity to make The Blanco your dream home. Just know that offerings vary by location, so please discuss our standard features and upgrade options with your community's agent.
Key facts
- Cozy loft space
- Walk-in closet
- Open kitchen
Tags
Neighborhood map
What this means for you Summary
Snapshot
- This is a 4-bed/2.5-bath single-family listed at $295k. Condition is rated good.
Deal economics
- At list price, monthly cash flow is $305 ($4k/yr) — positive.
- The deal already cash-flows at list — no discount required.
- Meets the 1% rule at list price ($3k rent vs $295k).
- Recommended offer: $268k (9.0% below list) — sets the bar for market timing.
- Cap rate 7.5% vs local median 6.2% in Kendleton — meaningfully above typical; check what's discounted (condition, days-on-market, listing class) to confirm the premium yield is real.
Location & tenants
- Location reads 61/100 on livability (#1,021 in TX) — a middle-class / working-renter tenant base. Strengths: cost of living A+, housing A+; Watch: schools C-, employment D+, crime D.
- Lamar CISD (suburban): math 50% / reading 53% proficiency, ranked #116 of 826 in TX (top 14%) — acceptable for families but not a draw, mixed tenant base, ~2y average lease.
- Market conditions: 232 active listings in the ZIP; 1 comparable units currently listed for rent nearby; 12,093 units permitted in Fort Bend County in 2024 (815 in 5+ unit buildings).
Forward outlook
- In year one you build about $14k of equity ($2k loan paydown + $12k appreciation (4.2% local appreciation)).
- Fort Bend County population projected at +75% by 2050 — long-run rental-demand tailwind backs the buy-and-hold thesis.
- At projected returns (4.2% appreciation + 3.0% rent growth), your $83k cash investment doubles in ~5 years — after that, you're playing with house money.
- By year 3, paydown + projected appreciation supports a ~$35k cash-out refi (75% LTV) — recoverable capital for the next deal without selling this one.
Negotiation context
- It's been on market 105 days — a 9% lower offer ($268k) is reasonable based on typical stale-listing flexibility.
Questions for the listing agent
- It's been on market 105 days. Have you received any prior offers? Is the seller open to a 9% concession, seller financing, or rate buy-down credit?
- Why hasn't it sold? Are there any deal-killer items the seller is aware of (foundation, flood, title, zoning, code violations)?
- Is there a deadline driving the sale (1031 exchange, divorce, estate, relocation)? That informs how much negotiation room exists.
- Crime grade is D in this area — have there been break-ins, vandalism, or insurance claims at this property in the last 3 years? What carrier currently insures it and at what premium?
- What's the average days-on-market for RENTAL listings here right now (not sales)? A rising rental-DOM trend means longer vacancies and softer asking-rent achievability than the comps imply.
- What's the recent tenant-quality profile in this submarket — average credit score on applications, eviction rate, late-payment / NSF rate, and stable-employment percentage? A property-management company in the area should have these aggregated.
- How much new for-sale + rental construction is in the pipeline within 1–3 miles? Heavy new supply typically softens prices + rents 12–24 months out; constrained supply supports both.
Investment metrics
- 1% rule
- 1.01% ✓
- Cap rate
- 7.53%
- Cash-on-cash
- 4.43%
- DSCR
- 1.20
- GRM
- 8.3
CMA / ARV
- ARV (median comp)
- $294,837
- List price
- $294,990
- Delta
- 0.05%
- Verdict
- FAIR
- Comps
- 20 within 1.0 mi
Show comp detail 12 sales within ~0.75 mi
| Address | Dist | Beds/Ba | Sqft | Sold | Price | $/sf | Match |
|---|---|---|---|---|---|---|---|
| 719 Mockingbird Psge | 0.29mi | 3/2.0 (-1) | 1,863 (+1%) | 2mo | $335,490 | $180 | 76 |
| 10735 Dogwood Sky Dr | 0.46mi | 4/2.0 | 1,778 (-4%) | 0mo | $289,990 | $163 | 70 |
| 1111 Whispering Winds Dr | 0.57mi | 4/2.0 | 1,841 (-0%) | 4mo | $338,900 | $184 | 67 |
| 1031 Rosewood Trl | 0.57mi | 4/2.0 | 1,778 (-4%) | 3mo | $299,900 | $169 | 62 |
| 723 Blue Sky Pl | 0.62mi | 4/2.0 | 1,922 (+4%) | 5mo | $314,990 | $164 | 58 |
| 10803 Hickory Ln | 0.74mi | 4/2.0 | 1,778 (-4%) | 2mo | $309,900 | $174 | 56 |
| 10627 Summers Way | 0.68mi | 3/2.0 (-1) | 1,819 (-2%) | 5mo | $303,990 | $167 | 55 |
| 10615 Summers Way | 0.72mi | 3/2.0 (-1) | 1,819 (-2%) | 5mo | $305,990 | $168 | 52 |
| 10915 Tawny Ridge Dr | 0.58mi | 4/2.5 | 2,066 (+12%) | 4mo | $293,990 | $142 | 50 |
| 10710 Sage Bend Dr | 0.51mi | 3/2.0 (-1) | 1,595 (-14%) | 1mo | $274,990 | $172 | 45 |
| 1027 Rosewood Trl | 0.56mi | 3/2.0 (-1) | 1,620 (-12%) | 3mo | $313,900 | $194 | 43 |
| 1022 Whispering Winds Dr | 0.56mi | 3/2.0 (-1) | 1,613 (-13%) | 5mo | $292,900 | $182 | 42 |
Match score weights: distance 35% · size 25% · config 20% · recency 20%. Top-matched comps best support the ARV.
Projected returns pro-forma
4.15% appreciation · 3.0% rent growth · sell at horizon
- IRR
- 14.6%
- Equity multiple
- 1.89×
- Total profit
- $73,365
- Equity at exit
- $152,135
- IRR
- 15.7%
- Equity multiple
- 3.57×
- Total profit
- $212,465
- Equity at exit
- $250,966
Cash invested: $82,554 (down + closing). Projections, not guarantees.
Landlord ↔ Tenant lean methodology
- Overall (STATE)
- 87 Strongly Landlord-Friendly
- State Texas
- 87 Strongly Landlord-Friendly · R+5
- County
- — inherits STATE
- City
- — inherits STATE
ZIP-level market 77417
- Home prices YoY
- 1.2%
- Active inventory
- 232
- Price-to-rent
- 8.3×
Monthly cashflow live
- Estimated rent
- $2,965 medium interval (Pro) →
- Mortgage (P&I)
- −$1,546
- Tax est. 1.5%
- −$369 /mo · $4,423/yr
- Insurance
- −$123
- HOA
- −$0
- Vacancy / Maint / Mgmt
- −$623
- Net cashflow
- $305
Break-even live
UW: 25.0% down · 7.5% · 30yr · 1.5% tax · 5.0% vac · 8.0% maint · 8.0% mgmt
Financing live
Cash to close
- Down payment
- $73,709
- Closing costs
- $8,845
- Reserves months
- —
- Total cash needed
- —
Loan-product check · same deal, 3 products live
Conventional
25% down · 7.5% · 30yr
- Down + closing
- —
- Monthly P&I
- —
- Monthly cashflow
- —
- DSCR
- —
- Eligible?
- —
Personal DTI + credit; lowest rate.
DSCR
20% down · 8.5% · 30yr
- Down + closing
- —
- Monthly P&I
- —
- Monthly cashflow
- —
- DSCR
- —
- Eligible?
- —
No personal income docs; deal must DSCR.
Hard money
10% down · 12.0% · 12mo
- Down + closing
- —
- Monthly P&I
- —
- Monthly cashflow
- —
- DSCR
- —
- Eligible?
- —
Short-term bridge; refi at stabilization.
Rent comps 1 comps
| Address | Beds | Baths | Sqft | Rent | $/sqft | DOM | Units | Dist |
|---|---|---|---|---|---|---|---|---|
| 10730 Sky Creek Ln Beasley, TX | 3.0–4.0 | 2.0–2.5 | 1869 | $2,965 | $1.59 | 1d | 1 | 0.03mi |
Listing history 14 events
-
2026-06-18days on market $294,990 Active 105 DOM
-
2026-06-17days on market $294,990 Active 104 DOM
-
2026-06-16days on market $294,990 Active 103 DOM
-
2026-06-15days on market $294,990 Active 102 DOM
-
2026-06-13days on market $294,990 Active 100 DOM
-
2026-06-10days on market $294,990 Active 96 DOM
-
2026-06-08days on market $294,990 Active 95 DOM
-
2026-06-07days on market $294,990 Active 94 DOM
-
2026-06-04days on market $294,990 Active 91 DOM
-
2026-06-03days on market $294,990 Active 90 DOM
-
2026-06-02days on market $294,990 Active 89 DOM
-
2026-06-01days on market $294,990 Active 88 DOM
-
2026-05-31days on market $294,990 Active 87 DOM
-
2026-03-05$309,990 Active 683-char remark
Show marketing remark (683 chars)
Welcome to The Blanco! This two-story home makes great use of space and amenities. On the main floor, you will find an open kitchen and family area as well as a mud room and laundry off the two-car garage. The primary suite is also on the main floor and features a large walk-in closet. Upstairs, there are three more bedrooms as well as an additional bathroom and cozy loft space. Make it your own with The Blanco's flexible floor plan. From additional garage space to a covered patio, you've got every opportunity to make The Blanco your dream home. Just know that offerings vary by location, so please discuss our standard features and upgrade options with your community's agent.
ⓘ Source: listings_history table (triggers on properties + properties_extension) + one-shot
backfill from property_details.listing_events for pre-trigger history.
Nearby sold comps map
Loading sold comps map…
Walkable amenities ~0.75 mi
Loading nearby amenities…
Taxation est. · year 1
- Rental income
- $35,580
- − Mortgage interest
- −$16,515
- − Property taxes
- −$4,423
- − Insurance
- −$1,474
- − Repairs & maintenance
- −$2,846
- − Management
- −$2,846
- − Depreciation
- −$8,577
- Taxable loss
- −$1,102
- Est. tax savings @ 24.0%
- +$265
- After-tax cash flow
- $3,922/yr
For passive investors: Depreciation is non-cash, so a rental often shows a tax loss while cash-flowing — sheltering income. Rental losses are passive: they offset passive income freely, and up to $25,000/yr can offset ordinary (W-2) income if you actively participate and your MAGI is under $100k (phasing out to $0 by $150k); unused losses carry forward. On sale, claimed depreciation is recaptured at up to 25%, and gains may owe capital-gains tax (a 1031 exchange can defer both). Figures are a year-1 estimate at your 24.0% rate — not tax advice; consult a CPA.
Condition & rehab AI · 6 photos
This two-story home is in good condition with no visible repairs needed. It offers a good balance of curb appeal and interior space, making it a solid investment opportunity.
Value-add opportunities
- Both Painting exterior and interior walls — Enhances curb appeal and interior aesthetics
- Both Landscaping improvements — Enhances curb appeal and adds value
- Resale Upgrading kitchen appliances — Modernizes the kitchen and appeals to potential buyers
- Resale Upgrading bathrooms with modern fixtures — Modernizes bathrooms and appeals to potential buyers
Renovation cost estimate screening
Value-add ROI direction
- Both Painting exterior and interior walls — Enhances curb appeal and interior aesthetics ↑
- Both Landscaping improvements — Enhances curb appeal and adds value ↑
- Resale Upgrading kitchen appliances — Modernizes the kitchen and appeals to potential buyers ↑
- Resale Upgrading bathrooms with modern fixtures — Modernizes bathrooms and appeals to potential buyers ↑
ⓘ Cost ranges are severity-bucket heuristics (US national rule-of-thumb). Get contractor quotes + a written scope before underwriting a rehab budget.
Schools (NCES district)
- District
- Lamar CISD
- NCES district ID
- 4826580
- Math proficiency
- 50% ▼ -12.00%
- Reading proficiency
- 53% ▼ -4.00%
- Median HH income
- $75,213
- Composite
- 46.43/100
- National rank
- #2452
- State rank
- #116 of 826 in TX
Livability — Kendleton
- Score
- 61/100
- State rank
- #1021
- US rank
- #18149
Category grades
Schools grade is shown separately in the Schools card above.
Census & demographics
- City population
- 115,151
- Population (ZIP)
- 3,232
Population outlook (Fort Bend County) Hauer SSP2
- Today (2025)
- 1,004,526 people
- By 2030
- 1,153,104 · +14.8%
- By 2040
- 1,453,718 · +44.7%
- By 2050
- 1,753,781 · +74.6%
- By 2075
- 2,455,772 · +144.5%
- By 2100
- 2,930,528 · +191.7%
Race, ethnicity, and origin ACS 2023
- Neighborhood character
- Predominantly Hispanic (67%)
- Race & ethnicity
- Hispanic / Latino 67% Two or more races 49% White 22% Black 8%
- Hispanic origin (detail)
- Mexican 54%
- Common ancestry
- Italian 2% Romanian 1%
- Foreign-born
- 3% · Canada
- Languages at home
- 76% English-only · Spanish 24%
Political lean MEDSL · Fort Bend
- 2024 margin
- Toss-up / Even · D 49.5% · R 47.9% · Other 2.6%
- 2008→2024 swing
- +4.0pp toward D · 2008: -2.4pp · 2024: 1.6pp
- All cycles
- 2024: D+1.6 2020: D+10.6 2016: D+6.6 2012: R+6.8 2008: R+2.4
Not yet ingested
- Civics
- —
Market trends
- HPI YoY
- ▲ 4.15%
- Current HPI
- 337.8236
- Rent YoY
- —
- Metro
- —
- State GDP YoY
- ▲ 3.95%
- F500 in state
- 110
Industry mix (Fortune 500 HQ in TX)
| Industry | F500 HQs | Revenue |
|---|---|---|
| Energy | 16 | $1,198B |
|
||
| Technology | 5 | $198B |
|
||
| Engineering / Construction | 4 | $72B |
|
||
| Energy Services | 3 | $60B |
|
||
| Utilities | 3 | $41B |
|
||
| Healthcare | 2 | $330B |
|
||
Price history
1 event — show timeline
- 2026-03-05 Listed $309,990 Zillow
Cash-flow waterfall
monthlySold comps — $/sqft
last 12 mo · ≤1 miLoading sold comps…