 Multi-family
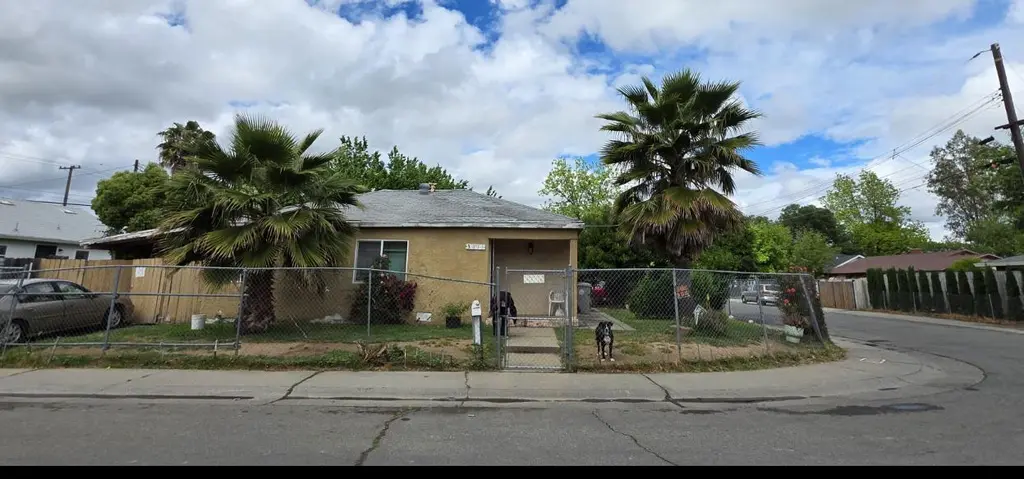
5130 Mascot Ave · Sacramento, CA
Flood risk 1/10 · Minimal
- FEMA flood zone
- X (unshaded)
- Chance of flooding over 30 yrs
- 0.0%
- Est. flood insurance / yr
- $507 – $1,088
Fire risk 1/10 · Minimal
- Est. fire insurance / yr
- $659 – $1,223
Heat risk 7/10 · Major
- Hot days now (above 102°F)
- 7 days/yr
- Hot days in 30 yrs
- 15 days/yr
Wind risk 1/10 · Minimal
- Chance of severe wind over 30 yrs
- —
Air-quality risk 10/10 · Severe
- Unhealthy air days now
- 25 days/yr
- Unhealthy air days in 30 yrs
- 26 days/yr
Risk factors via First Street. Map © Google.
Why this score? — see what drove the C- grade
The composite is a weighted blend of 9 inputs, each scored 0–100. Each bar is that input's sub-score; the figure is the points it added to the 100-point composite (weight × sub-score).
- Cash flow +18.8/30.0
- ARV discount +9.2/15.0
- DSCR +5.9/10.0
- 1% rule +3.9/10.0
- Rent growth +3.7/5.0
- Livability +3.6/5.0
- Schools +3.5/10.0
- Condition / age +2.5/5.0
- Appreciation +0.0/10.0
$377,000
🖨 Deal sheet 📄 Offer letter ✓ Due diligence
Multi-family units
County records classify this as Multi-Family (2-4 Unit). Listing-text estimate: 1 unit. estimate disagrees with records
Listing remarks
Unique opportunity to own two homes on one lot. 5130 Mascot Ave is 1 bed 1 bath with fenced front and backyard. 3871 26th Ave is 2 bedroom 1 bath with carport and detached storage building. Great for investor or owner occupied with rental income.
Key facts
- Two homes on one lot
- Carport
- 5,663 sq ft lot
Tags
Neighborhood map
What this means for you Summary
Snapshot
- This is a 2-bed/1.0-bath multifamily listed at $377k.
Deal economics
- At list price, monthly cash flow is $379 ($5k/yr) — positive.
- The deal already cash-flows at list — no discount required.
- To meet the 1% rule (rent ≥ 1% of price), the offer needs to be $336k (10.8% below list).
- Recommended offer: $336k (10.8% below list) — sets the bar for 1% rule.
- Cap rate 7.5% vs local median 3.0% in Sacramento — top-decile yield for the area; either an underpriced asset or a hidden risk that comps aren't pricing in. Stress-test before assuming the spread holds.
Location & tenants
- Location reads 71/100 on livability (#218 in CA) — a middle-class / working-renter tenant base. Strengths: amenities A+, commute A+, housing A; Watch: schools D+, crime F, cost of living F.
- Sacramento City Unified (urban): math 32% / reading 43% proficiency, ranked #804 of 1,400 in CA (top 57%) — families likely to look elsewhere, expect single-tenant / working-renter base with shorter leases; 63% free/reduced lunch — lower-income household profile, screen leases tightly.
- Market conditions: Rents rising fast (+4.6%/yr); 121 active listings in the ZIP; 40 comparable units currently listed for rent nearby; rentals at typical pace (median 24d on market — plan ~3-4 weeks tenant-placement turnaround); solid renter incomes; 6,825 units permitted in Sacramento County in 2024 (1,752 in 5+ unit buildings).
- At $3,362/mo this rent would consume 51% of the median local household income ($78k/yr) (locally 1255% of renters already pay >50% of income on rent) — very limited rent-growth headroom before tenants either downsize or default.
Forward outlook
- Local home prices are declining (-3.0%/yr); year-one equity from $3k of loan paydown is wiped out by about $11k of value loss. Plan a longer hold.
- Sacramento County population projected at +17% by 2050 — long-run rental-demand tailwind backs the buy-and-hold thesis.
Negotiation context
- It's been on market 66 days — a 6% lower offer ($354k) is reasonable based on typical stale-listing flexibility.
- Current owner paid $34k; list at $377k implies a 1025% gain — meaningful room to come down on a strong offer.
Risks & watch-outs
- Watch-outs: built in 1950 — expect roof / HVAC / electrical / plumbing capex.
- Climate carrying-cost: extreme-heat days projected 7→15/yr by 2055 (HVAC capex compounding) — expect insurance premiums to compound above CPI over the hold.
Questions for the listing agent
- It's been on market 66 days. Have you received any prior offers? Is the seller open to a 11% concession, seller financing, or rate buy-down credit?
- Built in 1950 — when were the roof, HVAC, electrical panel, plumbing, and water heater last replaced?
- Why hasn't it sold? Are there any deal-killer items the seller is aware of (foundation, flood, title, zoning, code violations)?
- Is there a deadline driving the sale (1031 exchange, divorce, estate, relocation)? That informs how much negotiation room exists.
- Schools are D-rated, which usually means shorter tenancies and higher turnover. Who's the typical renter profile here, and what's been the actual vacancy rate?
- Crime grade is F in this area — have there been break-ins, vandalism, or insurance claims at this property in the last 3 years? What carrier currently insures it and at what premium?
- What's the average days-on-market for RENTAL listings here right now (not sales)? A rising rental-DOM trend means longer vacancies and softer asking-rent achievability than the comps imply.
- What's the recent tenant-quality profile in this submarket — average credit score on applications, eviction rate, late-payment / NSF rate, and stable-employment percentage? A property-management company in the area should have these aggregated.
- How much new apartment / multifamily construction is in the pipeline within 1–3 miles? Heavy new supply (>2% of stock underway) typically softens rents 12–24 months out; light construction supports rent growth.
Investment metrics
- 1% rule
- 0.89% ✗
- Cap rate
- 7.50%
- Cash-on-cash
- 4.31%
- DSCR
- 1.19
- GRM
- 9.3
CMA / ARV
- ARV (median comp)
- $391,435
- List price
- $377,000
- Delta
- -3.69%
- Verdict
- FAIR
- Comps
- 8 within 1.0 mi
Show comp detail 1 sale within ~0.75 mi
| Address | Dist | Beds/Ba | Sqft | Sold | Price | $/sf | Match |
|---|---|---|---|---|---|---|---|
| 5530 Enrico Blvd | 0.32mi | 1/1.0 (-1) | 800 (+3%) | 16mo | $310,250 | $388 | 61 |
Match score weights: distance 35% · size 25% · config 20% · recency 20%. Top-matched comps best support the ARV.
Projected returns pro-forma
-3.0% appreciation · 4.62% rent growth · sell at horizon
- IRR
- -8.0%
- Equity multiple
- 0.70×
- Total profit
- $-31,526
- Equity at exit
- $56,212
- IRR
- 3.3%
- Equity multiple
- 1.25×
- Total profit
- $26,644
- Equity at exit
- $32,596
Cash invested: $105,560 (down + closing). Projections, not guarantees.
Landlord ↔ Tenant lean methodology
- Overall (STATE)
- 18 Strongly Tenant-Friendly
- State California
- 18 Strongly Tenant-Friendly · D+13
- County
- — inherits STATE
- City
- — inherits STATE
ZIP-level market 95820
- Rents YoY
- 4.6%
- Active inventory
- 121
- Price-to-rent
- 20.2×
Monthly cashflow live
- Estimated rent
- $3,362 medium interval (Pro) →
- Mortgage (P&I)
- −$1,977
- Tax from tax record
- −$143 /mo · $1,713/yr
- Insurance
- −$157
- HOA
- −$0
- Vacancy / Maint / Mgmt
- −$706
- Net cashflow
- $379
Break-even live
2-unit breakdown (identical units grouped — click to expand)
| Units | Beds | Baths | Est. rent |
|---|---|---|---|
| 1× unit | 1 | 1 | $1,558 |
| 1× unit | 2 | 1 | $1,804 |
| Total (2 units) | $3,362 | ||
UW: 25.0% down · 7.5% · 30yr · 1.5% tax · 5.0% vac · 8.0% maint · 8.0% mgmt
Financing live
Cash to close
- Down payment
- $94,250
- Closing costs
- $11,310
- Reserves months
- —
- Total cash needed
- —
Loan-product check · same deal, 3 products live
Conventional
25% down · 7.5% · 30yr
- Down + closing
- —
- Monthly P&I
- —
- Monthly cashflow
- —
- DSCR
- —
- Eligible?
- —
Personal DTI + credit; lowest rate.
DSCR
20% down · 8.5% · 30yr
- Down + closing
- —
- Monthly P&I
- —
- Monthly cashflow
- —
- DSCR
- —
- Eligible?
- —
No personal income docs; deal must DSCR.
Hard money
10% down · 12.0% · 12mo
- Down + closing
- —
- Monthly P&I
- —
- Monthly cashflow
- —
- DSCR
- —
- Eligible?
- —
Short-term bridge; refi at stabilization.
Rent comps 40 comps
| Address | Beds | Baths | Sqft | Rent | $/sqft | DOM | Units | Dist |
|---|---|---|---|---|---|---|---|---|
| 3996 Sierra Vista Ave Unit 1/2 Sacramento, CA | 1.0 | 1.0 | 659 | $1,395 | $2.12 | 23d | 1 | 0.19mi |
| 3600 26th Ave Unit B Sacramento, CA | 2.0 | 1.0 | 790 | $1,480 | $1.87 | 23d | 1 | 0.23mi |
| 4261 Sweetwater Ave Unit 3 Sacramento, CA | 1.0 | 1.0 | 650 | $1,270 | $1.95 | 43d | 1 | 0.42mi |
| 5619 42nd St Unit 5619-1 Sacramento, CA | 2.0 | 1.0 | 925 | $1,625 | $1.76 | 12d | 1 | 0.45mi |
| 3401 21st Ave Sacramento, CA | 3.0 | 1.0 | 1100 | $2,100 | $1.91 | 7d | 1 | 0.47mi |
| 5609 Odea Dr Sacramento, CA | 2.0 | 2.0 | 650 | $1,795 | $2.76 | 7d | 1 | 0.51mi |
| 5630 Odea Dr #4 Sacramento, CA | 2.0 | 1.0 | 847 | $1,375 | $1.62 | 22d | 1 | 0.51mi |
| 5656 Odea Dr Sacramento, CA | 2.0 | 1.0 | 850 | $1,750 | $2.06 | 4d | 1 | 0.58mi |
| 5656 Odea Dr Sacramento, CA | 2.0 | 1.0 | 850 | $1,750 | $2.06 | 7d | 1 | 0.58mi |
| 4116 W Nichols Ave Sacramento, CA | 2.0 | 1.0 | 870 | $1,799 | $2.07 | 17d | 1 | 0.61mi |
| 4200 35th St Sacramento, CA | 3.0 | 1.0 | 1100 | $2,200 | $2.00 | 16d | 1 | 0.62mi |
| 5904 40th St Unit 5904 Sacramento, CA | 2.0 | 1.0 | 718 | $2,100 | $2.92 | 23d | 1 | 0.69mi |
| 5904 40th St Unit 5906 Sacramento, CA | 2.0 | 1.0 | 718 | $2,100 | $2.92 | 43d | 1 | 0.69mi |
| 2871 32nd Ave Sacramento, CA | 2.0 | 1.0 | 784 | $1,575 | $2.01 | 43d | 1 | 0.72mi |
| 3900 38th St Sacramento, CA | 3.0 | 2.0 | 1119 | $2,540 | $2.27 | 23d | 1 | 0.73mi |
| 3962 44th St Sacramento, CA | 3.0 | 3.0 | 1081 | $2,495 | $2.31 | 22d | 1 | 0.80mi |
| 3962 44th St Sacramento, CA | 3.0 | 3.0 | 1081 | $2,550 | $2.36 | 7d | 1 | 0.80mi |
| 5812 Laurine Way Sacramento, CA | 2.0 | 1.0 | 790 | $2,199 | $2.78 | 22d | 1 | 0.82mi |
| 2785 32nd Ave Sacramento, CA | 2.0 | 1.0 | 800 | $1,795 | $2.24 | 43d | 1 | 0.83mi |
| 2991 36th Ave Sacramento, CA | 2.0 | 1.0 | 640 | $1,725 | $2.70 | 4d | 1 | 0.84mi |
| 2704 21st Ave Sacramento, CA | 2.0 | 1.0 | 1100 | $2,200 | $2.00 | 43d | 1 | 0.84mi |
| 2621 29th Ave Unit 2623 Sacramento, CA | 2.0 | 1.0 | 850 | $1,550 | $1.82 | 4d | 1 | 0.87mi |
| 2901 16th Ave Sacramento, CA | 2.0 | 1.0 | 900 | $1,900 | $2.11 | 43d | 1 | 0.89mi |
| 5726 Falconer Way Unit 4 Sacramento, CA | 2.0 | 1.0 | 750 | $1,350 | $1.80 | 23d | 1 | 0.90mi |
| 5726 Falconer Way Unit 6 Sacramento, CA | 2.0 | 1.0 | 750 | $1,400 | $1.87 | 23d | 1 | 0.90mi |
| 5724 Falconer Way Unit 2 Sacramento, CA | 2.0 | 1.5 | 750 | $1,500 | $2.00 | 43d | 1 | 0.91mi |
| 5730 Falconer Way Unit D Sacramento, CA | 2.0 | 1.0 | 750 | $1,350 | $1.80 | 20d | 1 | 0.91mi |
| 5730 Falconer Way Unit B Sacramento, CA | 2.0 | 1.0 | 750 | $1,400 | $1.87 | 23d | 1 | 0.91mi |
| 5720 Falconer Way Apt B Sacramento, CA | 2.0 | 1.0 | 750 | $1,350 | $1.80 | 23d | 1 | 0.92mi |
| 5891 28th St Sacramento, CA | 3.0 | 2.0 | 1110 | $2,195 | $1.98 | 20d | 1 | 0.96mi |
| 3521 San Jose Way Sacramento, CA | 2.0 | 1.0 | 818 | $1,990 | $2.43 | 23d | 1 | 0.98mi |
| 2908 12th Ave Sacramento, CA | 2.0 | 1.0 | 1015 | $1,795 | $1.77 | 23d | 1 | 1.01mi |
| 4204 51st St Unit A Sacramento, CA | 3.0 | 1.0 | 1050 | $2,450 | $2.33 | 23d | 1 | 1.04mi |
| 4204 51st St Sacramento, CA | 3.0 | 1.0 | 1050 | $2,450 | $2.33 | 3d | 1 | 1.04mi |
| 6201 Martin Luther King Junior Blvd Apt 12 Sacramento, CA | 2.0 | 1.0 | 673 | $1,400 | $2.08 | 43d | 1 | 1.05mi |
| 5988 Sampson Blvd Sacramento, CA | 2.0 | 1.0 | 1025 | $2,125 | $2.07 | 23d | 1 | 1.10mi |
| 5301 20th Ave Sacramento, CA | 3.0 | 1.0 | 1053 | $2,650 | $2.52 | 43d | 1 | 1.11mi |
| 5630 53rd St Unit 2 Sacramento, CA | 1.0 | 1.0 | 550 | $995 | $1.81 | 4d | 1 | 1.12mi |
| 5100 Gordon Dr Sacramento, CA | 1.0 | 1.0 | 650 | $1,300 | $2.00 | 43d | 1 | 1.15mi |
| 4957 13th Ave Sacramento, CA | 2.0 | 1.0 | 879 | $2,095 | $2.38 | 43d | 1 | 1.16mi |
Listing history 16 events
-
2026-06-18days on market $377,000 Active 66 DOM
-
2026-06-17days on market $377,000 Active 65 DOM
-
2026-06-16days on market $377,000 Active 64 DOM
-
2026-06-15days on market $377,000 Active 63 DOM
-
2026-06-13days on market $377,000 Active 61 DOM
-
2026-06-13pricedays on market $377,000 Active 60 DOM
-
2026-06-09days on market $448,000 Active 57 DOM
-
2026-06-08days on market $448,000 Active 56 DOM
-
2026-06-07days on market $448,000 Active 55 DOM
-
2026-06-05days on market $448,000 Active 52 DOM
-
2026-06-03days on market $448,000 Active 51 DOM
-
2026-06-02days on market $448,000 Active 50 DOM
-
2026-06-01days on market $448,000 Active 49 DOM
-
2026-05-31days on market $448,000 Active 48 DOM
-
1984-07-17soldstatus $33,500
-
1979-06-18soldstatus $17,000
ⓘ Source: listings_history table (triggers on properties + properties_extension) + one-shot
backfill from property_details.listing_events for pre-trigger history.
Tax reassessment forecast CA · Resets to sale price
- Current annual tax
- $1,713 · $143/mo
- Projected year-2 tax
- $2,865 · $239/mo
- Expected delta
- +$1,152/yr (+$96/mo · 67.3%)
ⓘ Screening estimate from a state-policy table — verify with the county assessor before closing.
Climate risk First Street
- Flood 1/10 Low FEMA zone X (unshaded) · 0% chance over 30 yrs
- Wildfire 1/10 Low
- Heat 7/10 Severe 7 d/yr ≥102°F today · 15 d/yr by 30 yrs out
- Wind 1/10 Low
- Air quality 10/10 Extreme 25 unhealthy d/yr today · 26 by 30 yrs out
Nearby sold comps map
Loading sold comps map…
Walkable amenities ~0.75 mi
Loading nearby amenities…
Taxation est. · year 1
- Rental income
- $40,344
- − Mortgage interest
- −$21,118
- − Property taxes
- −$1,713
- − Insurance
- −$1,885
- − Repairs & maintenance
- −$3,228
- − Management
- −$3,228
- − Depreciation
- −$10,967
- Taxable loss
- −$1,794
- Est. tax savings @ 24.0%
- +$431
- After-tax cash flow
- $4,980/yr
For passive investors: Depreciation is non-cash, so a rental often shows a tax loss while cash-flowing — sheltering income. Rental losses are passive: they offset passive income freely, and up to $25,000/yr can offset ordinary (W-2) income if you actively participate and your MAGI is under $100k (phasing out to $0 by $150k); unused losses carry forward. On sale, claimed depreciation is recaptured at up to 25%, and gains may owe capital-gains tax (a 1031 exchange can defer both). Figures are a year-1 estimate at your 24.0% rate — not tax advice; consult a CPA.
Schools (NCES district)
- District
- Sacramento City Unified
- NCES district ID
- 0633840
- Math proficiency
- 32% ▬ 0.00%
- Reading proficiency
- 43% ▲ 3.00%
- Median HH income
- $49,280
- Composite
- 34.86/100
- National rank
- #10000
- State rank
- #804 of 1400 in CA
Livability — Sacramento
- Score
- 71/100
- State rank
- #218
- US rank
- #6957
Category grades
Schools grade is shown separately in the Schools card above.
Census & demographics
- Census place
- Sacramento, CA
- County
- Sacramento County · 1,539,646 people
- City population
- 761,410
- Metro
- Sacramento-Roseville-Folsom, CA
- Population (ZIP)
- 35,410
- Household income
- $78,436
- Rent vs Own
- Severe rent burden
- 1255.0
Population outlook (Sacramento County) Hauer SSP2
- Today (2025)
- 1,660,763 people
- By 2030
- 1,732,990 · +4.3%
- By 2040
- 1,855,755 · +11.7%
- By 2050
- 1,941,335 · +16.9%
- By 2075
- 2,046,162 · +23.2%
- By 2100
- 1,961,444 · +18.1%
Race, ethnicity, and origin ACS 2023
- Neighborhood character
- Highly diverse neighborhood (Simpson 0.72)
- Race & ethnicity
- Hispanic / Latino 41% White 31% Two or more races 17% Black 11% Asian 11% Pacific Islander 2%
- Hispanic origin (detail)
- Mexican 34% Puerto Rican 2%
- Common ancestry
- Italian 2% Russian 1% Slovak 1%
- Foreign-born
- 19% · Canada, Vietnam, China
- Languages at home
- 65% English-only · Spanish 23% Other Asian/Pacific 5% Chinese 1%
Political lean MEDSL · Sacramento
- 2024 margin
- D (+19.7) · D 58.1% · R 38.4% · Other 3.5%
- 2008→2024 swing
- +0.7pp no change · 2008: 19.0pp · 2024: 19.7pp
- All cycles
- 2024: D+19.7 2020: D+25.3 2016: D+23.7 2012: D+16.3 2008: D+19.0
Not yet ingested
- Civics
- —
Market trends
- HPI YoY
- ▼ -473.17%
- Current HPI
- 413.4424
- Rent YoY
- ▲ 4.62%
- Metro
- Sacramento-Roseville-Folsom, CA
- State GDP YoY
- ▲ 3.21%
- F500 in state
- 116
Industry mix (Fortune 500 HQ in CA)
| Industry | F500 HQs | Revenue |
|---|---|---|
| Technology | 27 | $1,492B |
|
||
| Financial Services | 3 | $174B |
|
||
| Retail | 3 | $44B |
|
||
| Insurance | 3 | $26B |
|
||
| Media / Entertainment | 2 | $115B |
|
||
| Pharmaceuticals / Biotech | 2 | $62B |
|
||
Price history
+97.1% since first listed2 events — show timeline
- 1984-07-17 Sold (Public Records) $33,500 Public Records
- 1979-06-18 Sold (Public Records) $17,000 Public Records
Property tax history
-0.1%/yrLatest (2025): $1,713 · +1.4% YoY. Source: county tax records.
Cash-flow waterfall
monthlySold comps — $/sqft
last 12 mo · ≤1 miLoading sold comps…