646 E Mcneil Ave · Hoopeston, IL
Flood risk 1/10 · Minimal
- FEMA flood zone
- X (unshaded)
- Chance of flooding over 30 yrs
- 0.0%
- Est. flood insurance / yr
- $473 – $860
Fire risk 1/10 · Minimal
- Est. fire insurance / yr
- $804 – $1,492
Heat risk 3/10 · Minor
- Hot days now (above 103°F)
- 7 days/yr
- Hot days in 30 yrs
- 18 days/yr
Wind risk 2/10 · Minimal
- Chance of severe wind over 30 yrs
- 1.0%
Air-quality risk 2/10 · Minimal
- Unhealthy air days now
- 1 days/yr
- Unhealthy air days in 30 yrs
- 1 days/yr
Risk factors via First Street. Map © Google.
Why this score? — see what drove the C grade
The composite is a weighted blend of 9 inputs, each scored 0–100. Each bar is that input's sub-score; the figure is the points it added to the 100-point composite (weight × sub-score).
- Cash flow +23.3/30.0
- DSCR +7.5/10.0
- ARV discount +7.5/15.0
- Appreciation +6.4/10.0
- 1% rule +6.3/10.0
- Livability +2.9/5.0
- Rent growth +2.5/5.0
- Condition / age +2.5/5.0
- Schools +1.0/10.0
$59,900
🖨 Deal sheet 📄 Offer letter ✓ Due diligence
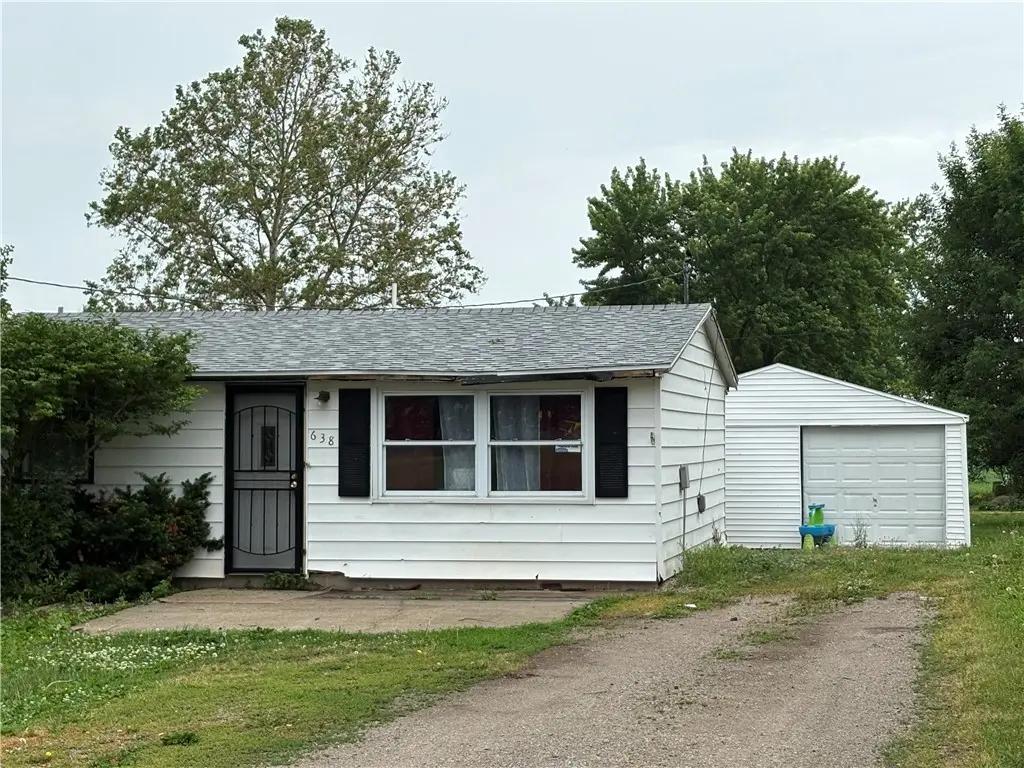
Listing remarks
1 Level Ranch, 3 bedrooms, 1 bath Close to park and move in ready. 1 car garage.
Key facts
- 8,250 sq ft lot
- Garage
- Built 1954
Property features AI
Finance
- Other: Residential property in a non-specified zoning category
Exterior
- Parking: Attached garage (1 car)
- Utilities: Public water; Public sewer; Electric service (standard)
- Home design: Single-family residence; One level / single-story
- Construction: Vinyl siding; Built with crawl space foundation
- Exterior features: Asphalt roof; Gravel road access; Lot dimensions approximately 50 x 165 (19 acres)
Interior
- Kitchen: Range; Refrigerator
- Bedrooms: Total of 5 rooms (bedroom count not specified)
- Bathrooms: 1 full bathroom
- Heating & cooling: Forced air heating; Central air conditioning
- Interior features: Gas water heater; Range; Refrigerator; Crawl space basement
- Laundry & utility: Laundry on the main level
Neighborhood map
What this means for you Summary
Snapshot
- This is a 3-bed/1.0-bath other listed at $60k.
Deal economics
- At list price, monthly cash flow is $109 ($1k/yr) — positive.
- The deal already cash-flows at list — no discount required.
- Meets the 1% rule at list price ($675 rent vs $60k).
Location & tenants
- Location reads 57/100 on livability (#1,152 in IL) — a working-class tenant base; expect higher turnover. Strengths: cost of living A+, housing B+; Watch: crime D+, schools F, amenities F.
- Hoopeston Area CUSD 11 (town): math 9% / reading 15% proficiency, ranked #559 of 620 in IL (top 90%) — low school quality limits family demand, transient renter base, plan for 1-2y turnover.
- Market conditions: 40 active listings in the ZIP; 1 comparable units currently listed for rent nearby; 8 units permitted in Vermilion County in 2024 (0 in 5+ unit buildings).
Forward outlook
- In year one you build about $2k of equity ($414 loan paydown + $2k appreciation (2.8% local appreciation)).
- Vermilion County population projected at -24% by 2050 — secular population decline; favor cash flow + early exit over multi-decade hold.
- At projected returns (2.8% appreciation + 3.0% rent growth), your $17k cash investment doubles in ~5 years — after that, you're playing with house money.
Negotiation context
- Only 1 days on market — expect competitive offers; lowballing is unlikely to land.
- Current owner paid $18k; list at $60k implies a 233% gain — meaningful room to come down on a strong offer.
Risks & watch-outs
- Watch-outs: built in 1954 — expect roof / HVAC / electrical / plumbing capex.
Questions for the listing agent
- Built in 1954 — when were the roof, HVAC, electrical panel, plumbing, and water heater last replaced?
- Is there a deadline driving the sale (1031 exchange, divorce, estate, relocation)? That informs how much negotiation room exists.
- Schools are F-rated, which usually means shorter tenancies and higher turnover. Who's the typical renter profile here, and what's been the actual vacancy rate?
- Crime grade is D in this area — have there been break-ins, vandalism, or insurance claims at this property in the last 3 years? What carrier currently insures it and at what premium?
- What's the average days-on-market for RENTAL listings here right now (not sales)? A rising rental-DOM trend means longer vacancies and softer asking-rent achievability than the comps imply.
- What's the recent tenant-quality profile in this submarket — average credit score on applications, eviction rate, late-payment / NSF rate, and stable-employment percentage? A property-management company in the area should have these aggregated.
- How much new for-sale + rental construction is in the pipeline within 1–3 miles? Heavy new supply typically softens prices + rents 12–24 months out; constrained supply supports both.
Investment metrics
- 1% rule
- 1.13% ✓
- Cap rate
- 8.49%
- Cash-on-cash
- 7.83%
- DSCR
- 1.35
- GRM
- 7.4
CMA / ARV
No comps found within radius.
Projected returns pro-forma
2.77% appreciation · 3.0% rent growth · sell at horizon
- IRR
- 14.3%
- Equity multiple
- 1.80×
- Total profit
- $13,476
- Equity at exit
- $26,161
- IRR
- 16.2%
- Equity multiple
- 3.33×
- Total profit
- $39,148
- Equity at exit
- $39,728
Cash invested: $16,772 (down + closing). Projections, not guarantees.
Landlord ↔ Tenant lean methodology
- Overall (STATE)
- 43 Moderately Tenant-Leaning
- State Illinois
- 43 Moderately Tenant-Leaning · D+7
- County
- — inherits STATE
- City
- — inherits STATE
ZIP-level market 60942
- Home prices YoY
- 1.4%
- Active inventory
- 40
- Price-to-rent
- 7.4×
Monthly cashflow live
- Estimated rent
- $675 medium interval (Pro) →
- Mortgage (P&I)
- −$314
- Tax from tax record
- −$85 /mo · $1,017/yr
- Insurance
- −$25
- HOA
- −$0
- Vacancy / Maint / Mgmt
- −$142
- Net cashflow
- $109
Break-even live
UW: 25.0% down · 7.5% · 30yr · 1.5% tax · 5.0% vac · 8.0% maint · 8.0% mgmt
Financing live
Cash to close
- Down payment
- $14,975
- Closing costs
- $1,797
- Reserves months
- —
- Total cash needed
- —
Loan-product check · same deal, 3 products live
Conventional
25% down · 7.5% · 30yr
- Down + closing
- —
- Monthly P&I
- —
- Monthly cashflow
- —
- DSCR
- —
- Eligible?
- —
Personal DTI + credit; lowest rate.
DSCR
20% down · 8.5% · 30yr
- Down + closing
- —
- Monthly P&I
- —
- Monthly cashflow
- —
- DSCR
- —
- Eligible?
- —
No personal income docs; deal must DSCR.
Hard money
10% down · 12.0% · 12mo
- Down + closing
- —
- Monthly P&I
- —
- Monthly cashflow
- —
- DSCR
- —
- Eligible?
- —
Short-term bridge; refi at stabilization.
Rent comps 1 comps
| Address | Beds | Baths | Sqft | Rent | $/sqft | DOM | Units | Dist |
|---|---|---|---|---|---|---|---|---|
| 422 E Seminary Ave Unit 13 Hoopeston, IL | 2.0 | 1.0 | 750 | $675 | $0.90 | 13d | 1 | 0.52mi |
Listing history 2 events
-
2026-06-09remarks 81-char remark
-
2026-06-09$59,900 Pending 1 DOM
ⓘ Source: listings_history table (triggers on properties + properties_extension) + one-shot
backfill from property_details.listing_events for pre-trigger history.
Tax reassessment forecast IL · Partial reset (capped growth)
- Current annual tax
- $1,017 · $85/mo
- Projected year-2 tax
- $1,188 · $99/mo
- Expected delta
- +$171/yr (+$14/mo · 16.9%)
ⓘ Screening estimate from a state-policy table — verify with the county assessor before closing.
Climate risk First Street
- Flood 1/10 Low FEMA zone X (unshaded) · 0% chance over 30 yrs
- Wildfire 1/10 Low
- Heat 3/10 Moderate 7 d/yr ≥103°F today · 18 d/yr by 30 yrs out
- Wind 2/10 Low 100% chance of damaging wind over 30 yrs
- Air quality 2/10 Low 1 unhealthy d/yr today · 1 by 30 yrs out
Nearby sold comps map
Loading sold comps map…
Walkable amenities ~0.75 mi
Loading nearby amenities…
Taxation est. · year 1
- Rental income
- $8,100
- − Mortgage interest
- −$3,355
- − Property taxes
- −$1,017
- − Insurance
- −$300
- − Repairs & maintenance
- −$648
- − Management
- −$648
- − Depreciation
- −$1,743
- Taxable income
- $390
- Est. tax owed @ 24.0%
- −$94
- After-tax cash flow
- $1,220/yr
For passive investors: Depreciation is non-cash, so a rental often shows a tax loss while cash-flowing — sheltering income. Rental losses are passive: they offset passive income freely, and up to $25,000/yr can offset ordinary (W-2) income if you actively participate and your MAGI is under $100k (phasing out to $0 by $150k); unused losses carry forward. On sale, claimed depreciation is recaptured at up to 25%, and gains may owe capital-gains tax (a 1031 exchange can defer both). Figures are a year-1 estimate at your 24.0% rate — not tax advice; consult a CPA.
Schools (NCES district)
- District
- Hoopeston Area CUSD 11
- NCES district ID
- 1719660
- Math proficiency
- 9% ▼ -7.00%
- Reading proficiency
- 15% ▼ -3.00%
- Median HH income
- $40,897
- Composite
- 10.39/100
- National rank
- #9786
- State rank
- #559 of 620 in IL
Livability — Hoopeston
- Score
- 57/100
- State rank
- #1152
- US rank
- #21789
Category grades
Schools grade is shown separately in the Schools card above.
Census & demographics
- Census place
- Hoopeston, IL
- City population
- 5,635
- Population (ZIP)
- 5,635
Population outlook (Vermilion County) Hauer SSP2
- Today (2025)
- 72,775 people
- By 2030
- 69,235 · -4.9%
- By 2040
- 62,360 · -14.3%
- By 2050
- 55,539 · -23.7%
- By 2075
- 40,606 · -44.2%
- By 2100
- 26,985 · -62.9%
Race, ethnicity, and origin ACS 2023
- Neighborhood character
- Predominantly White (91%)
- Race & ethnicity
- White 91% Hispanic / Latino 5% Two or more races 4% Black 2% Asian 1%
- Common ancestry
- Portuguese 4% Slovak 2% Italian 2%
- Foreign-born
- 1% · Canada, South Korea
- Languages at home
- 96% English-only · Spanish 4% Other Indo-European 1%
Political lean MEDSL · Vermilion
- 2024 margin
- Solid R (+35.7) · D 31.4% · R 67.0% · Other 1.6%
- 2008→2024 swing
- -36.2pp toward R · 2008: 0.6pp · 2024: -35.7pp
- All cycles
- 2024: R+35.7 2020: R+32.9 2016: R+29.2 2012: R+15.7 2008: D+0.6
Not yet ingested
- Civics
- —
Market trends
- HPI YoY
- ▲ 2.77%
- Current HPI
- 193.4089
- Rent YoY
- —
- Metro
- —
- State GDP YoY
- ▲ 1.59%
- F500 in state
- 60
Industry mix (Fortune 500 HQ in IL)
| Industry | F500 HQs | Revenue |
|---|---|---|
| Insurance | 4 | $201B |
|
||
| Consumer Goods | 4 | $87B |
|
||
| Industrial Machinery | 3 | $64B |
|
||
| Healthcare | 2 | $55B |
|
||
| Retail / Pharmacy | 1 | $148B |
|
||
| Agriculture / Food | 1 | $86B |
|
||
Price history
+565.6% since first listed6 events — show timeline
- 2026-06-08 Pending — CIBR
- 2026-06-08 Listed $59,900 CIBR
- 2010-09-10 Sold (Public Records) $18,000 Public Records
- 1985-09-06 Sold (Public Records) $27,000 Public Records
- 1977-10-21 Sold (Public Records) $23,000 Public Records
- 1972-06-14 Sold (Public Records) $9,000 Public Records
Property tax history
+3.5%/yrLatest (2024): $1,017 · +8.1% YoY. Source: county tax records.
Cash-flow waterfall
monthlySold comps — $/sqft
last 12 mo · ≤1 miLoading sold comps…