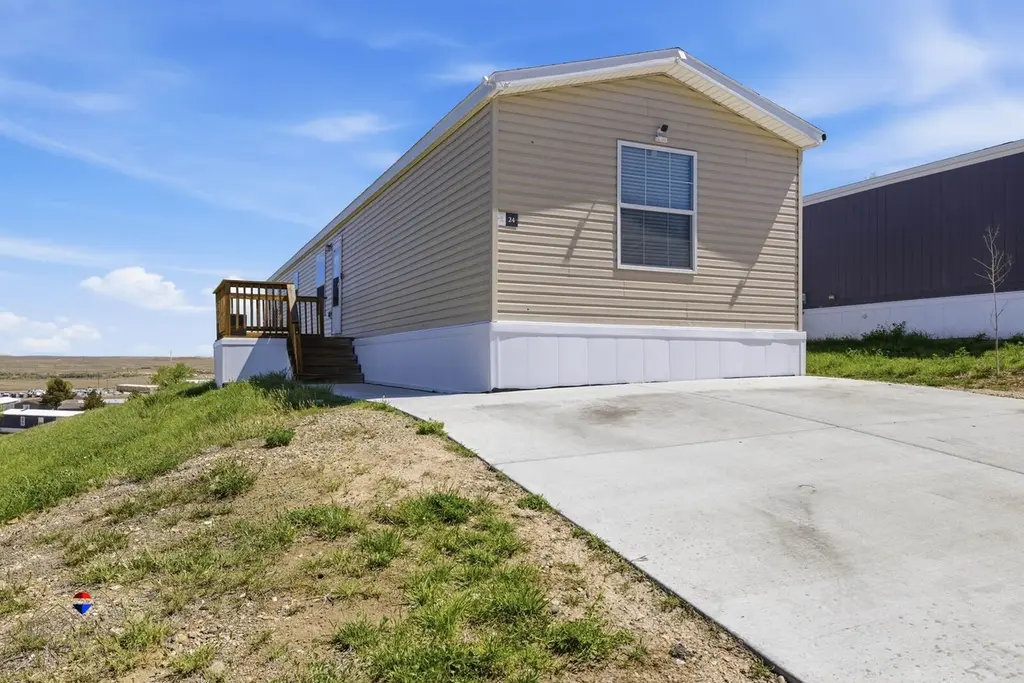
4901 E Lathrop Rd #24 Rd · Evansville, WY
Flood risk 1/10 · Minimal
- FEMA flood zone
- X (unshaded)
- Chance of flooding over 30 yrs
- 0.0%
- Est. flood insurance / yr
- $507 – $1,088
Fire risk 7/10 · Major
- Est. fire insurance / yr
- $564 – $1,046
Heat risk 3/10 · Minor
- Hot days now (above 91°F)
- 7 days/yr
- Hot days in 30 yrs
- 18 days/yr
Wind risk 1/10 · Minimal
- Chance of severe wind over 30 yrs
- —
Air-quality risk 2/10 · Minimal
- Unhealthy air days now
- 1 days/yr
- Unhealthy air days in 30 yrs
- 1 days/yr
Risk factors via First Street. Map © Google.
Why this score? — see what drove the B grade
The composite is a weighted blend of 9 inputs, each scored 0–100. Each bar is that input's sub-score; the figure is the points it added to the 100-point composite (weight × sub-score).
- Cash flow +30.0/30.0
- DSCR +10.0/10.0
- 1% rule +9.8/10.0
- ARV discount +7.5/15.0
- Schools +4.2/10.0
- Condition / age +4.0/5.0
- Livability +3.4/5.0
- Rent growth +2.5/5.0
- Appreciation +0.0/10.0
$83,000
🖨 Deal sheet 📄 Offer letter ✓ Due diligence
Key facts
- No carpet
- Open layout
- Modern finishes
Tags
Property features AI
Exterior
- Parking: No garage
- Utilities: Public water; Public sewer; Natural gas available
- Home design: Residential mobile home; Mobile/Mfd detached
- Exterior features: Deck; Shed(s); Has a view; Located on a cul-de-sac
Interior
- Kitchen: Dishwasher; Refrigerator; Microwave; Range / Oven; Garbage disposal
- Flooring: Vinyl
- Heating & cooling: Central air conditioning; Forced air heating
- Interior features: Walk-in closet(s)
Neighborhood map
What this means for you Summary
Snapshot
- This is a 3-bed/2.0-bath manufactured listed at $83k. Condition is rated good.
Deal economics
- At list price, monthly cash flow is $396 ($5k/yr) — positive.
- The deal already cash-flows at list — no discount required.
- Meets the 1% rule at list price ($1k rent vs $83k).
- Recommended offer: $82k (1.5% below list) — sets the bar for market timing.
Location & tenants
- Location reads 68/100 on livability (#51 in WY) — a middle-class / working-renter tenant base. Strengths: crime A+, cost of living A+, housing A+; Watch: schools D, amenities F, commute F.
- Natrona County School District #1 (urban): math 44% / reading 52% proficiency, ranked #32 of 41 in WY (top 78%) — families likely to look elsewhere, expect single-tenant / working-renter base with shorter leases.
- Market conditions: 45 active listings in the ZIP; 310 units permitted in Natrona County in 2024 (104 in 5+ unit buildings).
Forward outlook
- Local home prices are declining (-3.0%/yr); year-one equity from $574 of loan paydown is wiped out by about $2k of value loss. Plan a longer hold.
- Natrona County population projected at +46% by 2050 — long-run rental-demand tailwind backs the buy-and-hold thesis.
- At projected returns (-3.0% appreciation + 3.0% rent growth), your $23k cash investment doubles in ~6 years — after that, you're playing with house money.
Negotiation context
- It's been on market 28 days — a 2% lower offer ($82k) is reasonable based on typical stale-listing flexibility.
Risks & watch-outs
- Climate carrying-cost: major wildfire risk — expect insurance premiums to compound above CPI over the hold.
Questions for the listing agent
- Is there a deadline driving the sale (1031 exchange, divorce, estate, relocation)? That informs how much negotiation room exists.
- Schools are D-rated, which usually means shorter tenancies and higher turnover. Who's the typical renter profile here, and what's been the actual vacancy rate?
- What's the average days-on-market for RENTAL listings here right now (not sales)? A rising rental-DOM trend means longer vacancies and softer asking-rent achievability than the comps imply.
- What's the recent tenant-quality profile in this submarket — average credit score on applications, eviction rate, late-payment / NSF rate, and stable-employment percentage? A property-management company in the area should have these aggregated.
- How much new for-sale + rental construction is in the pipeline within 1–3 miles? Heavy new supply typically softens prices + rents 12–24 months out; constrained supply supports both.
Investment metrics
- 1% rule
- 1.48% ✓
- Cap rate
- 12.02%
- Cash-on-cash
- 20.46%
- DSCR
- 1.91
- GRM
- 5.6
CMA / ARV
No comps found within radius.
Projected returns pro-forma
-3.0% appreciation · 3.0% rent growth · sell at horizon
- IRR
- 12.8%
- Equity multiple
- 1.51×
- Total profit
- $11,800
- Equity at exit
- $12,376
- IRR
- 21.7%
- Equity multiple
- 2.84×
- Total profit
- $42,840
- Equity at exit
- $7,176
Cash invested: $23,240 (down + closing). Projections, not guarantees.
Landlord ↔ Tenant lean methodology
- Overall (STATE)
- 90 Strongly Landlord-Friendly
- State Wyoming
- 90 Strongly Landlord-Friendly · R+25
- County
- — inherits STATE
- City
- — inherits STATE
ZIP-level market 82636
- Home prices YoY
- -24.9%
- Active inventory
- 45
- Price-to-rent
- 5.6×
Monthly cashflow live
- Estimated rent
- $1,228 medium interval (Pro) →
- Mortgage (P&I)
- −$435
- Tax est. 1.5%
- −$104 /mo · $1,245/yr
- Insurance
- −$35
- HOA
- −$0
- Vacancy / Maint / Mgmt
- −$258
- Net cashflow
- $396
Break-even live
UW: 25.0% down · 7.5% · 30yr · 1.5% tax · 5.0% vac · 8.0% maint · 8.0% mgmt
Financing live
Cash to close
- Down payment
- $20,750
- Closing costs
- $2,490
- Reserves months
- —
- Total cash needed
- —
Loan-product check · same deal, 3 products live
Conventional
25% down · 7.5% · 30yr
- Down + closing
- —
- Monthly P&I
- —
- Monthly cashflow
- —
- DSCR
- —
- Eligible?
- —
Personal DTI + credit; lowest rate.
DSCR
20% down · 8.5% · 30yr
- Down + closing
- —
- Monthly P&I
- —
- Monthly cashflow
- —
- DSCR
- —
- Eligible?
- —
No personal income docs; deal must DSCR.
Hard money
10% down · 12.0% · 12mo
- Down + closing
- —
- Monthly P&I
- —
- Monthly cashflow
- —
- DSCR
- —
- Eligible?
- —
Short-term bridge; refi at stabilization.
Listing history 18 events
-
2026-06-19days on market $83,000 Active 28 DOM
-
2026-06-18days on market $83,000 Active 27 DOM
-
2026-06-17days on market $83,000 Active 26 DOM
-
2026-06-17days on market $83,000 Active 25 DOM
-
2026-06-15days on market $83,000 Active 24 DOM
-
2026-06-14days on market $83,000 Active 22 DOM
-
2026-06-13days on market $83,000 Active 21 DOM
-
2026-06-10days on market $83,000 Active 19 DOM
-
2026-06-09days on market $83,000 Active 18 DOM
-
2026-06-08days on market $83,000 Active 17 DOM
-
2026-06-07days on market $83,000 Active 16 DOM
-
2026-06-05days on market $83,000 Active 13 DOM
-
2026-06-03days on market $83,000 Active 12 DOM
-
2026-06-02days on market $83,000 Active 11 DOM
-
2026-06-01days on market $83,000 Active 10 DOM
-
2026-05-31days on market $83,000 Active 9 DOM
-
2026-05-30days on market $83,000 Active 8 DOM
-
2026-05-22$83,000 Active
ⓘ Source: listings_history table (triggers on properties + properties_extension) + one-shot
backfill from property_details.listing_events for pre-trigger history.
Climate risk First Street
- Flood 1/10 Low FEMA zone X (unshaded) · 0% chance over 30 yrs
- Wildfire 7/10 Severe
- Heat 3/10 Moderate 7 d/yr ≥91°F today · 18 d/yr by 30 yrs out
- Wind 1/10 Low
- Air quality 2/10 Low 1 unhealthy d/yr today · 1 by 30 yrs out
Nearby sold comps map
Loading sold comps map…
Walkable amenities ~0.75 mi
Loading nearby amenities…
Taxation est. · year 1
- Rental income
- $14,730
- − Mortgage interest
- −$4,649
- − Property taxes
- −$1,245
- − Insurance
- −$415
- − Repairs & maintenance
- −$1,178
- − Management
- −$1,178
- − Depreciation
- −$2,415
- Taxable income
- $3,650
- Est. tax owed @ 24.0%
- −$876
- After-tax cash flow
- $3,878/yr
For passive investors: Depreciation is non-cash, so a rental often shows a tax loss while cash-flowing — sheltering income. Rental losses are passive: they offset passive income freely, and up to $25,000/yr can offset ordinary (W-2) income if you actively participate and your MAGI is under $100k (phasing out to $0 by $150k); unused losses carry forward. On sale, claimed depreciation is recaptured at up to 25%, and gains may owe capital-gains tax (a 1031 exchange can defer both). Figures are a year-1 estimate at your 24.0% rate — not tax advice; consult a CPA.
Condition & rehab AI · 13 photos
This manufactured home is in good condition with minimal repairs needed. Painting the exterior trim and cleaning gutters would significantly enhance its curb appeal and resale value.
Value-add opportunities
- Both Paint exterior trim — Enhances curb appeal and resale value
- Both Clean gutters — Improves drainage and prevents water damage
Renovation cost estimate screening
Value-add ROI direction
- Both Paint exterior trim — Enhances curb appeal and resale value ↑
- Both Clean gutters — Improves drainage and prevents water damage ↑
ⓘ Cost ranges are severity-bucket heuristics (US national rule-of-thumb). Get contractor quotes + a written scope before underwriting a rehab budget.
Schools (NCES district)
- District
- Natrona County School District #1
- NCES district ID
- 5604510
- Math proficiency
- 44% ▼ -4.00%
- Reading proficiency
- 52% ▼ -2.00%
- Median HH income
- $55,217
- Composite
- 41.6/100
- National rank
- #3437
- State rank
- #32 of 41 in WY
Livability — Evansville
- Score
- 68/100
- State rank
- #51
- US rank
- #9711
Category grades
Schools grade is shown separately in the Schools card above.
Census & demographics
- Census place
- Evansville, WY
- Population (ZIP)
- 3,856
Population outlook (Natrona County) Hauer SSP2
- Today (2025)
- 98,530 people
- By 2030
- 107,084 · +8.7%
- By 2040
- 124,838 · +26.7%
- By 2050
- 143,617 · +45.8%
- By 2075
- 192,378 · +95.2%
- By 2100
- 228,435 · +131.8%
Race, ethnicity, and origin ACS 2023
- Neighborhood character
- Predominantly White (78%)
- Race & ethnicity
- White 78% Hispanic / Latino 15% Two or more races 10% Asian 2% Black 1%
- Hispanic origin (detail)
- Mexican 8%
- Common ancestry
- Portuguese 4% Slovak 2% Italian 1%
- Foreign-born
- 4% · Canada
- Languages at home
- 91% English-only · Spanish 6% Other Asian/Pacific 2%
Political lean MEDSL · Natrona
- 2024 margin
- Solid R (+48.6) · D 24.8% · R 73.5% · Other 1.7%
- 2008→2024 swing
- -14.3pp toward R · 2008: -34.4pp · 2024: -48.6pp
- All cycles
- 2024: R+48.6 2020: R+47.6 2016: R+52.2 2012: R+41.1 2008: R+34.4
Not yet ingested
- Civics
- —
Market trends
- HPI YoY
- ▼ -64.77%
- Current HPI
- 195.2252
- Rent YoY
- —
- Metro
- —
- State GDP YoY
- —
- F500 in state
- 0
Price history
1 event — show timeline
- 2026-05-22 Listed $83,000 WMLS
Cash-flow waterfall
monthlySold comps — $/sqft
last 12 mo · ≤1 miLoading sold comps…