 🏷️ Likely Rental
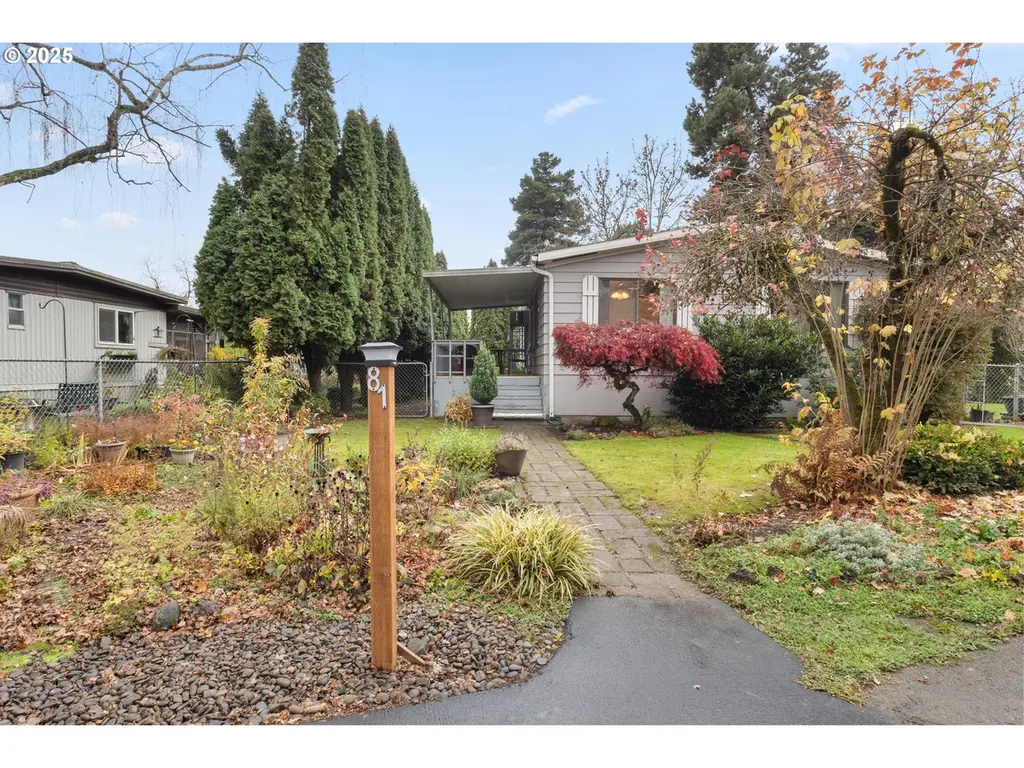
4915 Swegle Rd #81 · Four Corners, OR
Flood risk 1/10 · Minimal
- FEMA flood zone
- X (unshaded)
- Chance of flooding over 30 yrs
- 0.0%
- Est. flood insurance / yr
- $507 – $1,088
Fire risk 1/10 · Minimal
- Est. fire insurance / yr
- $498 – $926
Heat risk 3/10 · Minor
- Hot days now (above 92°F)
- 7 days/yr
- Hot days in 30 yrs
- 14 days/yr
Wind risk 1/10 · Minimal
- Chance of severe wind over 30 yrs
- —
Air-quality risk 10/10 · Severe
- Unhealthy air days now
- 13 days/yr
- Unhealthy air days in 30 yrs
- 14 days/yr
Risk factors via First Street. Map © Google.
Why this score? — see what drove the D grade
The composite is a weighted blend of 9 inputs, each scored 0–100. Each bar is that input's sub-score; the figure is the points it added to the 100-point composite (weight × sub-score).
- Cash flow +15.0/30.0
- ARV discount +7.5/15.0
- 1% rule +5.0/10.0
- DSCR +5.0/10.0
- Livability +3.9/5.0
- Schools +3.7/10.0
- Condition / age +2.5/5.0
- Rent growth +2.3/5.0
- Appreciation +0.0/10.0
$29,900
🖨 Deal sheet 📄 Offer letter ✓ Due diligence
Listing remarks MLS
Back on market: NO fault of seller. Well-maintained 2-bedroom, 2-bathroom home in a desirable 55+ community. This home sits on a spacious lot with a fully fenced backyard, covered front porch, covered rear deck, carport with built-in storage, and an extra shed. Inside, the dining room features a beautiful china hutch and dimmable lighting. An additional family room adds even more living space. Lot rent is $995/mo and includes water, sewer, and trash. Community amenities include a pool, kitchen, TV room, meeting room, and sauna. Sold AS-IS. It passed appraisal with previous buyer.
Key facts
- Garage
- Community pool
- Built 1978
Neighborhood map
What this means for you Summary
Snapshot
- This is a 2-bed/2.0-bath manufactured listed at $30k.
Deal economics
- At list price, monthly cash flow is $992 ($12k/yr) — positive.
- The deal already cash-flows at list — no discount required.
- Meets the 1% rule at list price ($2k rent vs $30k).
- Recommended offer: $29k (1.5% below list) — sets the bar for market timing.
- Cap rate 46.1% vs local median 3.9% in Four Corners — top-decile yield for the area; either an underpriced asset or a hidden risk that comps aren't pricing in. Stress-test before assuming the spread holds.
Location & tenants
- Location reads 78/100 on livability (#66 in OR, #2,680 nationally) — a middle-class / working-renter tenant base. Strengths: housing A+, health & safety A+, amenities B+; Watch: schools D-, crime D-.
- Salem-Keizer SD 24J (urban): math 34% / reading 47% proficiency, ranked #103 of 183 in OR (top 56%) — families likely to look elsewhere, expect single-tenant / working-renter base with shorter leases.
- Market conditions: Rents soft (-0.7%/yr); 276 active listings in the ZIP; 32 comparable units currently listed for rent nearby; rentals at typical pace (median 21d on market — plan ~3-4 weeks tenant-placement turnaround); 1,591 units permitted in Marion County in 2024 (716 in 5+ unit buildings).
- This rent runs 30% of the median local income ($60k/yr) — at the standard rent-burdened threshold; future hikes will face affordability resistance.
Forward outlook
- Local home prices are declining (-3.0%/yr); year-one equity from $207 of loan paydown is wiped out by about $897 of value loss. Plan a longer hold.
- Marion County population projected at +17% by 2050 — long-run rental-demand tailwind backs the buy-and-hold thesis.
- At projected returns (-3.0% appreciation + 0.0% rent growth), your $8k cash investment doubles in ~1 year — after that, you're playing with house money.
Negotiation context
- It's been on market 16 days — a 2% lower offer ($29k) is reasonable based on typical stale-listing flexibility.
- 9 sale attempts since 15y ago; this cycle's ask has dropped $10k (25%) from the opening price — seller is motivated, your offer sets the floor, not the list.
- Current owner paid $10k; list at $30k implies a 199% gain — meaningful room to come down on a strong offer.
Questions for the listing agent
- Built in 1978 — when were the roof, HVAC, electrical panel, plumbing, and water heater last replaced?
- Is there a deadline driving the sale (1031 exchange, divorce, estate, relocation)? That informs how much negotiation room exists.
- Schools are D-rated, which usually means shorter tenancies and higher turnover. Who's the typical renter profile here, and what's been the actual vacancy rate?
- Crime grade is D in this area — have there been break-ins, vandalism, or insurance claims at this property in the last 3 years? What carrier currently insures it and at what premium?
- The area grade is low — what's the realistic commute time and amenity access for the typical tenant pool here? Any planned neighborhood developments (good or bad) we should know about?
- What's the average days-on-market for RENTAL listings here right now (not sales)? A rising rental-DOM trend means longer vacancies and softer asking-rent achievability than the comps imply.
- What's the recent tenant-quality profile in this submarket — average credit score on applications, eviction rate, late-payment / NSF rate, and stable-employment percentage? A property-management company in the area should have these aggregated.
- How much new for-sale + rental construction is in the pipeline within 1–3 miles? Heavy new supply typically softens prices + rents 12–24 months out; constrained supply supports both.
Investment metrics
- 1% rule
- 5.08% ✓
- Cap rate
- 46.11%
- Cash-on-cash
- 142.20%
- DSCR
- 7.33
- GRM
- 1.6
CMA / ARV
- ARV (median comp)
- $115,000
- List price
- $29,900
- Delta
- -74.00%
- Verdict
- UNDERPRICED
- Comps
- 20 within 1.0 mi
Show comp detail 12 sales within ~0.75 mi
| Address | Dist | Beds/Ba | Sqft | Sold | Price | $/sf | Match |
|---|---|---|---|---|---|---|---|
| 4915 Swegle Rd #81 | 0.00mi | 2/2.0 | 1,248 (0%) | 1mo | $29,900 | $24 | 99 |
| 4915 Swegle Rd NE #3 | 0.00mi | 3/2.0 (+1) | 1,288 (+3%) | 4mo | $57,000 | $44 | 86 |
| 4915 Swegle Rd | 0.01mi | 3/2.0 (+1) | 1,288 (+3%) | 4mo | $57,000 | $44 | 86 |
| 4915 Swegle Rd NE #15 | 0.00mi | 3/2.0 (+1) | 1,152 (-8%) | 2mo | $57,500 | $50 | 81 |
| 4915 NE Swegle Rd #76 | 0.00mi | 2/2.0 | 1,368 (+10%) | 5mo | $51,500 | $38 | 80 |
| 1932 Cottontail Ct NE | 0.22mi | 3/2.0 (+1) | 1,296 (+4%) | 3mo | $349,900 | $270 | 76 |
| 1913 Cottontail Ct NE | 0.21mi | 3/2.0 (+1) | 1,296 (+4%) | 7mo | $334,900 | $258 | 73 |
| 1500 NE Gabriela Ct #16 | 0.24mi | 3/2.0 (+1) | 1,350 (+8%) | 1mo | $98,000 | $73 | 69 |
| 1500 Gabriela Ct #20 | 0.24mi | 3/2.0 (+1) | 1,323 (+6%) | 5mo | $132,000 | $100 | 69 |
| 857 Hoffman Rd NE #11 | 0.62mi | 3/2.0 (+1) | 1,296 (+4%) | 6mo | $110,000 | $85 | 54 |
| 857 Hoffman Rd | 0.62mi | 3/2.0 (+1) | 1,296 (+4%) | 6mo | $110,000 | $85 | 54 |
| 2560 Brown Rd | 0.74mi | 3/2.0 (+1) | 1,296 (+4%) | 5mo | $412,000 | $318 | 50 |
Match score weights: distance 35% · size 25% · config 20% · recency 20%. Top-matched comps best support the ARV.
Projected returns pro-forma
-3.0% appreciation · 0.0% rent growth · sell at horizon
- IRR
- —
- Equity multiple
- 7.44×
- Total profit
- $53,916
- Equity at exit
- $4,458
- IRR
- —
- Equity multiple
- 14.28×
- Total profit
- $111,214
- Equity at exit
- $2,585
Cash invested: $8,372 (down + closing). Projections, not guarantees.
Landlord ↔ Tenant lean methodology
- Overall (STATE)
- 28 Tenant-Leaning
- State Oregon
- 28 Tenant-Leaning · D+6
- County
- — inherits STATE
- City
- — inherits STATE
ZIP-level market 97301
- Rents YoY
- -0.7%
- Active inventory
- 276
- Price-to-rent
- 1.6×
Monthly cashflow live
- Estimated rent
- $1,518 high interval (Pro) →
- Mortgage (P&I)
- −$157
- Tax from tax record
- −$38 /mo · $454/yr
- Insurance
- −$12
- HOA
- −$0
- Vacancy / Maint / Mgmt
- −$319
- Net cashflow
- $992
Break-even live
UW: 25.0% down · 7.5% · 30yr · 1.5% tax · 5.0% vac · 8.0% maint · 8.0% mgmt
Financing live
Cash to close
- Down payment
- $7,475
- Closing costs
- $897
- Reserves months
- —
- Total cash needed
- —
Loan-product check · same deal, 3 products live
Conventional
25% down · 7.5% · 30yr
- Down + closing
- —
- Monthly P&I
- —
- Monthly cashflow
- —
- DSCR
- —
- Eligible?
- —
Personal DTI + credit; lowest rate.
DSCR
20% down · 8.5% · 30yr
- Down + closing
- —
- Monthly P&I
- —
- Monthly cashflow
- —
- DSCR
- —
- Eligible?
- —
No personal income docs; deal must DSCR.
Hard money
10% down · 12.0% · 12mo
- Down + closing
- —
- Monthly P&I
- —
- Monthly cashflow
- —
- DSCR
- —
- Eligible?
- —
Short-term bridge; refi at stabilization.
Rent comps 32 comps
| Address | Beds | Baths | Sqft | Rent | $/sqft | DOM | Units | Dist |
|---|---|---|---|---|---|---|---|---|
| 4768 El Cedro Loop NE Salem, OR | 3.0 | 2.0 | 1344 | $1,895 | $1.41 | 43d | 1 | 0.52mi |
| 1973 45th Ave NE Salem, OR | 2.0 | 1.0–2.0 | 1043 | $1,360 | $1.30 | 14d | 2 | 0.55mi |
| 4200 Sunnyview Rd NE Salem, OR | 2.0 | 1.0–2.0 | 880 | $1,445 | $1.64 | 23d | 1 | 0.78mi |
| 4889 Saunter Loop NE Salem, OR | 3.0 | 1.5 | 1186 | $1,925 | $1.62 | 43d | 1 | 0.83mi |
| 4116 Market St NE Salem, OR | 2.0 | 1.0 | 858 | $1,350 | $1.57 | 43d | 1 | 0.85mi |
| 4116 Market St NE Salem, OR | 2.0 | 1.0 | 858 | $1,350 | $1.57 | 14d | 1 | 0.85mi |
| 4359 Rodeo Dr NE Salem, OR | 3.0 | 2.0 | 1170 | $2,245 | $1.92 | 21d | 1 | 0.86mi |
| 4098 Market St NE Unit MT21 Salem, OR | 2.0 | 1.0 | 900 | $1,275 | $1.42 | 23d | 1 | 0.87mi |
| 4154 Sunnyview Rd NE Salem, OR | 1.0–2.0 | 1.0 | 806 | $1,375 | $1.71 | 14d | 6 | 0.89mi |
| 4341 Center St NE Salem, OR | 2.0 | 1.0 | 828 | $1,130 | $1.36 | 43d | 1 | 0.99mi |
| 4824 Falcon Ct NE Salem, OR | 3.0 | 1.5 | 1246 | $1,995 | $1.60 | 23d | 1 | 1.09mi |
| 1415 Lancaster Dr NE Unit 18 Salem, OR | 2.0 | 1.0 | 850 | $1,200 | $1.41 | 43d | 1 | 1.10mi |
| 1415 Lancaster Dr NE Unit 16 Salem, OR | 2.0 | 1.0 | 850 | $1,250 | $1.47 | 43d | 1 | 1.10mi |
| 1415 Lancaster Dr NE Unit 33 Salem, OR | 2.0 | 1.0 | 850 | $1,225 | $1.44 | 43d | 1 | 1.10mi |
| 3910-3930 Sunnyview Rd NE Salem, OR | 3.0 | 2.5 | 1300 | $1,845 | $1.42 | 14d | 6 | 1.10mi |
| 4252 Ash Grove Dr NE Salem, OR | 3.0 | 2.0 | 1357 | $2,100 | $1.55 | 14d | 1 | 1.12mi |
| 1415 Lancaster Dr NE Unit 21 Salem, OR | 2.0 | 1.0 | 850 | $1,225 | $1.44 | 14d | 1 | 1.13mi |
| 3864 Sunnyview Rd NE Salem, OR | 2.0 | 1.0 | 835 | $1,135 | $1.36 | 14d | 7 | 1.14mi |
| 2500 Lancaster Dr NE Salem, OR | 1.0–2.0 | 1.0 | 771 | $1,350 | $1.75 | 14d | 11 | 1.15mi |
| 2500 Lancaster Dr NE Unit 35 Salem, OR | 2.0 | 1.0 | 890 | $1,295 | $1.46 | 43d | 1 | 1.15mi |
| 2489 Coral Ave NE Salem, OR | 1.0–2.0 | 1.0 | 817 | $1,301 | $1.59 | 14d | 11 | 1.25mi |
| 4712 Silverton Rd NE Salem, OR | 2.0 | 2.0 | 952 | $1,495 | $1.57 | 14d | 5 | 1.28mi |
| 4840 Cheryl Lynn Way NE Salem, OR | 2.0 | 1.0 | 756 | $1,100 | $1.46 | 14d | 2 | 1.31mi |
| 3695 D St NE Salem, OR | 1.0–2.0 | 1.0–2.0 | 1037 | $1,650 | $1.59 | 43d | 3 | 1.32mi |
| 3739 Beverly Ave NE Salem, OR | 2.0 | 1.0 | 838 | $1,275 | $1.52 | 21d | 2 | 1.40mi |
| 3563 Silver Park Pl NE Salem, OR | 2.0 | 1.0 | 828 | $1,080 | $1.30 | 43d | 1 | 1.41mi |
| 2800 Fisher Rd NE Salem, OR | 2.0 | 1.0 | 856 | $1,270 | $1.48 | 21d | 2 | 1.44mi |
| 3654 47th Ave NE Unit 3654-D Salem, OR | 2.0 | 1.0 | 900 | $1,150 | $1.28 | 43d | 1 | 1.46mi |
| 102 Greencrest St NE Salem, OR | 3.0 | 1.0–2.0 | 914 | $1,918 | $2.10 | 14d | 25 | 1.47mi |
| 435 Fountain Valley Way NE Salem, OR | 1.0–2.0 | 1.0–2.0 | 939 | $1,559 | $1.66 | 21d | 5 | 1.48mi |
| 4470 Conser Way NE Salem, OR | 2.0 | 2.0 | 925 | $1,395 | $1.51 | 14d | 3 | 1.50mi |
| 3880 Auburn Rd NE Unit 3896 Salem, OR | 2.0 | 1.0 | 850 | $1,450 | $1.71 | 43d | 1 | 1.50mi |
Listing history 26 events
-
2026-05-11status Pending 586-char remark
Show marketing remark (586 chars)
Back on market: NO fault of seller. Well-maintained 2-bedroom, 2-bathroom home in a desirable 55+ community. This home sits on a spacious lot with a fully fenced backyard, covered front porch, covered rear deck, carport with built-in storage, and an extra shed. Inside, the dining room features a beautiful china hutch and dimmable lighting. An additional family room adds even more living space. Lot rent is $995/mo and includes water, sewer, and trash. Community amenities include a pool, kitchen, TV room, meeting room, and sauna. Sold AS-IS. It passed appraisal with previous buyer.
-
2026-04-25status Active 586-char remark
Show marketing remark (586 chars)
Back on market: NO fault of seller. Well-maintained 2-bedroom, 2-bathroom home in a desirable 55+ community. This home sits on a spacious lot with a fully fenced backyard, covered front porch, covered rear deck, carport with built-in storage, and an extra shed. Inside, the dining room features a beautiful china hutch and dimmable lighting. An additional family room adds even more living space. Lot rent is $995/mo and includes water, sewer, and trash. Community amenities include a pool, kitchen, TV room, meeting room, and sauna. Sold AS-IS. It passed appraisal with previous buyer.
-
2026-03-12historical
-
2026-03-10status Pending 586-char remark
Show marketing remark (586 chars)
Back on market: NO fault of seller. Well-maintained 2-bedroom, 2-bathroom home in a desirable 55+ community. This home sits on a spacious lot with a fully fenced backyard, covered front porch, covered rear deck, carport with built-in storage, and an extra shed. Inside, the dining room features a beautiful china hutch and dimmable lighting. An additional family room adds even more living space. Lot rent is $995/mo and includes water, sewer, and trash. Community amenities include a pool, kitchen, TV room, meeting room, and sauna. Sold AS-IS. It passed appraisal with previous buyer.
-
2026-01-04price $29,900
-
2025-11-29status Active
-
2025-11-24historical Active under Contract
-
2025-11-17$29,900 Active 586-char remark
Show marketing remark (586 chars)
Back on market: NO fault of seller. Well-maintained 2-bedroom, 2-bathroom home in a desirable 55+ community. This home sits on a spacious lot with a fully fenced backyard, covered front porch, covered rear deck, carport with built-in storage, and an extra shed. Inside, the dining room features a beautiful china hutch and dimmable lighting. An additional family room adds even more living space. Lot rent is $995/mo and includes water, sewer, and trash. Community amenities include a pool, kitchen, TV room, meeting room, and sauna. Sold AS-IS. It passed appraisal with previous buyer.
-
2025-11-17$39,900 Active
Show marketing remark (586 chars)
Back on market: NO fault of seller. Well-maintained 2-bedroom, 2-bathroom home in a desirable 55+ community. This home sits on a spacious lot with a fully fenced backyard, covered front porch, covered rear deck, carport with built-in storage, and an extra shed. Inside, the dining room features a beautiful china hutch and dimmable lighting. An additional family room adds even more living space. Lot rent is $995/mo and includes water, sewer, and trash. Community amenities include a pool, kitchen, TV room, meeting room, and sauna. Sold AS-IS. It passed appraisal with previous buyer.
-
2013-04-22historical
-
2013-04-19soldstatus $10,000 Sold
-
2013-04-13status Pending
-
2013-04-06historical Active under Contract
-
2013-04-01price $10,000
-
2013-03-29price $12,000 Active
-
2013-03-29status Active
-
2013-03-20historical Active under Contract
-
2012-11-23status Active
-
2012-11-23historical
-
2012-10-11price $13,500
-
2012-10-10status Active
-
2012-09-29historical Active under Contract
-
2012-09-10price $10,900
-
2012-06-22$13,900 Active
-
2011-09-10historical
-
2011-06-15$21,900 Active
ⓘ Source: listings_history table (triggers on properties + properties_extension) + one-shot
backfill from property_details.listing_events for pre-trigger history.
Tax reassessment forecast OR · Resets to sale price
- Current annual tax
- $454 · $38/mo
- Projected year-2 tax
- $454 · $38/mo
- Expected delta
- $0/yr ($0/mo · 0.0%)
ⓘ Screening estimate from a state-policy table — verify with the county assessor before closing.
Climate risk First Street
- Flood 1/10 Low FEMA zone X (unshaded) · 0% chance over 30 yrs
- Wildfire 1/10 Low
- Heat 3/10 Moderate 7 d/yr ≥92°F today · 14 d/yr by 30 yrs out
- Wind 1/10 Low
- Air quality 10/10 Extreme 13 unhealthy d/yr today · 14 by 30 yrs out
Nearby sold comps map
Loading sold comps map…
Walkable amenities ~0.75 mi
Loading nearby amenities…
Taxation est. · year 1
- Rental income
- $18,216
- − Mortgage interest
- −$1,675
- − Property taxes
- −$454
- − Insurance
- −$150
- − Repairs & maintenance
- −$1,457
- − Management
- −$1,457
- − Depreciation
- −$870
- Taxable income
- $12,153
- Est. tax owed @ 24.0%
- −$2,917
- After-tax cash flow
- $8,988/yr
For passive investors: Depreciation is non-cash, so a rental often shows a tax loss while cash-flowing — sheltering income. Rental losses are passive: they offset passive income freely, and up to $25,000/yr can offset ordinary (W-2) income if you actively participate and your MAGI is under $100k (phasing out to $0 by $150k); unused losses carry forward. On sale, claimed depreciation is recaptured at up to 25%, and gains may owe capital-gains tax (a 1031 exchange can defer both). Figures are a year-1 estimate at your 24.0% rate — not tax advice; consult a CPA.
Schools (NCES district)
- District
- Salem-Keizer SD 24J
- NCES district ID
- 4110820
- Math proficiency
- 34% ▼ -1.00%
- Reading proficiency
- 47% ▼ -2.00%
- Median HH income
- $48,632
- Composite
- 37.16/100
- National rank
- #9017
- State rank
- #103 of 183 in OR
Livability — Four Corners
- Score
- 78/100
- State rank
- #66
- US rank
- #2680
Category grades
Schools grade is shown separately in the Schools card above.
Census & demographics
- Census place
- Four Corners, OR
- County
- Marion County · 258,219 people
- Metro
- Salem, OR
- Population (ZIP)
- 57,574
- Household income
- $60,422
- Rent vs Own
- Severe rent burden
- 3089.0
Population outlook (Marion County) Hauer SSP2
- Today (2025)
- 360,940 people
- By 2030
- 375,178 · +3.9%
- By 2040
- 400,914 · +11.1%
- By 2050
- 422,187 · +17.0%
- By 2075
- 460,305 · +27.5%
- By 2100
- 464,025 · +28.6%
Race, ethnicity, and origin ACS 2023
- Neighborhood character
- Diverse neighborhood (Simpson 0.58)
- Race & ethnicity
- White 55% Hispanic / Latino 35% Two or more races 19% Asian 2% Black 2% Native American 1% Pacific Islander 1%
- Hispanic origin (detail)
- Mexican 31%
- Common ancestry
- Italian 4% Portuguese 2% Lithuanian 2%
- Foreign-born
- 17% · Canada, China, Philippines
- Languages at home
- 68% English-only · Spanish 27% Other Asian/Pacific 1% Russian/Polish/Slavic 1%
Political lean MEDSL · Marion
- 2024 margin
- Toss-up / Even · D 47.5% · R 49.5% · Other 3.0%
- 2008→2024 swing
- -4.2pp toward R · 2008: 2.2pp · 2024: -2.0pp
- All cycles
- 2024: R+2.0 2020: D+1.1 2016: R+5.0 2012: R+3.5 2008: D+2.2
Not yet ingested
- Civics
- —
Market trends
- HPI YoY
- ▼ -548.17%
- Current HPI
- 335.8199
- Rent YoY
- ▼ -0.70%
- Metro
- Salem, OR
- State GDP YoY
- ▲ 2.05%
- F500 in state
- 2
Industry mix (Fortune 500 HQ in OR)
| Industry | F500 HQs | Revenue |
|---|---|---|
| Consumer Goods | 1 | $51B |
|
||
Price history
+36.5% since first listed26 events — show timeline
- 2026-05-11 Pending — RMLS
- 2026-04-25 Relisted — RMLS
- 2026-03-12 Listing Removed — WVMLS
- 2026-03-10 Pending — RMLS
- 2026-01-04 Price Changed $29,900 WVMLS
- 2025-11-29 Relisted — WVMLS
- 2025-11-24 Contingent — WVMLS
- 2025-11-17 Listed $39,900 WVMLS
- 2025-11-17 Listed $29,900 RMLS
- 2013-04-22 Listing Removed — WVMLS
- 2013-04-19 Sold (MLS) $10,000 WVMLS
- 2013-04-13 Pending — WVMLS
- 2013-04-06 Contingent — WVMLS
- 2013-04-01 Price Changed $10,000 WVMLS
- 2013-03-29 Relisted — WVMLS
- 2013-03-29 Price Changed $12,000 WVMLS
- 2013-03-20 Contingent — WVMLS
- 2012-11-23 Relisted — WVMLS
- 2012-11-23 Listing Removed — WVMLS
- 2012-10-11 Price Changed $13,500 WVMLS
- 2012-10-10 Relisted — WVMLS
- 2012-09-29 Contingent — WVMLS
- 2012-09-10 Price Changed $10,900 WVMLS
- 2012-06-22 Listed $13,900 WVMLS
- 2011-09-10 Listing Removed — WVMLS
- 2011-06-15 Listed $21,900 WVMLS
Property tax history
+3.3%/yrLatest (2025): $454 · +2.9% YoY. Source: county tax records.
Cash-flow waterfall
monthlySold comps — $/sqft
last 12 mo · ≤1 miLoading sold comps…