 Duplex
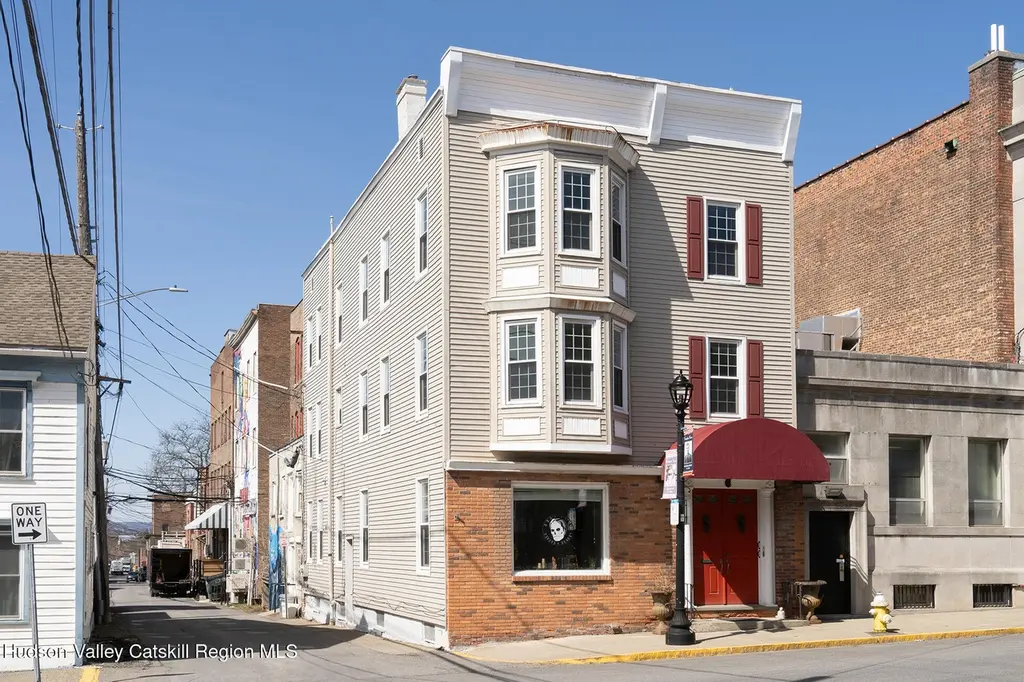
11 S South 6th St · Hudson, NY
Flood risk 1/10 · Minimal
- FEMA flood zone
- X
- Chance of flooding over 30 yrs
- 0.0%
- Est. flood insurance / yr
- $473 – $860
Fire risk 4/10 · Minor
- Est. fire insurance / yr
- $691 – $1,283
Heat risk 4/10 · Minor
- Hot days now (above 98°F)
- 7 days/yr
- Hot days in 30 yrs
- 17 days/yr
Wind risk 3/10 · Minor
- Chance of severe wind over 30 yrs
- 7.0%
Air-quality risk 2/10 · Minimal
- Unhealthy air days now
- 0 days/yr
- Unhealthy air days in 30 yrs
- 1 days/yr
Risk factors via First Street. Map © Google.
Why this score? — see what drove the C- grade
The composite is a weighted blend of 9 inputs, each scored 0–100. Each bar is that input's sub-score; the figure is the points it added to the 100-point composite (weight × sub-score).
- ARV discount +15.0/15.0
- Appreciation +10.0/10.0
- Cash flow +7.8/30.0
- Rent growth +5.0/5.0
- Schools +3.6/10.0
- Livability +3.5/5.0
- Condition / age +2.5/5.0
- DSCR +1.9/10.0
- 1% rule +1.7/10.0
$995,000
🖨 Deal sheet (PDF) 📄 Offer letter ✓ Due diligence
Multi-family units
County records classify this as Multi-Family (2-4 Unit). Listing-text estimate: 2 units. confirmed
Listing remarks MLS
Sky High Bliss A rare opportunity to own a mixed-use gem just half a block from Warren Street. The light-filled retail space below offers a warm, inviting atmosphere with a charming, approachable feel, thoughtfully designed for convenience and flow, ideal for display and customer engagement. Above, an outstanding, freshly painted duplex unfolds with natural light and effortless charm, featuring a rooftop terrace with mountain views, an eat-in cook's kitchen with wood stove, a library and a spacious primary suite with a generous walk-in closet. With wood floors, a stunning staircase, Thermopane windows and central air, there's ample room for a home office and guests. Perfect in any season, simply sublime.
Key facts
- Rooftop terrace
- Wood stove
- Mixed-use gem
Tags
Neighborhood map
What this means for you Summary
Snapshot
- This is a 2 × 2-bed/1.5-bath units multifamily listed at $995k.
Deal economics
- At list price, monthly cash flow is $-1k ($-13k/yr) — negative. Per door: $-548/mo.
- To cash-flow at today's rent, offer at most $801k (19.5% below list).
- To meet the 1% rule (rent ≥ 1% of price), the offer needs to be $668k (32.9% below list).
- Recommended offer: $668k (32.9% below list) — sets the bar for 1% rule.
- Cap rate 5.0% vs local median 3.3% in Hudson — top-decile yield for the area; either an underpriced asset or a hidden risk that comps aren't pricing in. Stress-test before assuming the spread holds.
Location & tenants
- Location reads 70/100 on livability (#430 in NY) — a middle-class / working-renter tenant base. Strengths: amenities A+, health & safety A+; Watch: schools C-, commute F, employment F.
- Hudson City School District (town): math 38% / reading 47% proficiency, ranked #494 of 590 in NY (top 84%) — families likely to look elsewhere, expect single-tenant / working-renter base with shorter leases.
- Market conditions: Rents rising fast (+10.9%/yr); 162 active listings in the ZIP; 1 comparable units currently listed for rent nearby; 136 units permitted in Columbia County in 2024 (0 in 5+ unit buildings).
- At $6,678/mo this rent would consume 110% of the median local household income ($73k/yr) (locally 1083% of renters already pay >50% of income on rent) — very limited rent-growth headroom before tenants either downsize or default.
Forward outlook
- In year one you build about $106k of equity ($7k loan paydown + $100k appreciation (10.0% local appreciation)).
- Columbia County population projected at -22% by 2050 — secular population decline; favor cash flow + early exit over multi-decade hold.
- By year 2, paydown + projected appreciation supports a ~$171k cash-out refi (75% LTV) — recoverable capital for the next deal without selling this one.
Negotiation context
- It's been on market 82 days — a 6% lower offer ($935k) is reasonable based on typical stale-listing flexibility.
- Current owner paid $325k; list at $995k implies a 206% gain — meaningful room to come down on a strong offer.
Risks & watch-outs
- Watch-outs: built in 1890 — expect roof / HVAC / electrical / plumbing capex.
Questions for the listing agent
- What do current leases actually rent for vs. the listed asking? Can we see a recent rent roll and the last 12 months of T-12 income?
- It's been on market 82 days. Have you received any prior offers? Is the seller open to a 33% concession, seller financing, or rate buy-down credit?
- Can we see the unit-by-unit rent roll, current vacancy, and any below-market leases? What's the average tenancy length?
- What capital expenditures (roof, boiler, parking lot, exteriors) have been made in the last 5 years, and what's planned in the next 2?
- Built in 1890 — when were the roof, HVAC, electrical panel, plumbing, and water heater last replaced?
- Why hasn't it sold? Are there any deal-killer items the seller is aware of (foundation, flood, title, zoning, code violations)?
- Is there a deadline driving the sale (1031 exchange, divorce, estate, relocation)? That informs how much negotiation room exists.
- What's the average days-on-market for RENTAL listings here right now (not sales)? A rising rental-DOM trend means longer vacancies and softer asking-rent achievability than the comps imply.
- What's the recent tenant-quality profile in this submarket — average credit score on applications, eviction rate, late-payment / NSF rate, and stable-employment percentage? A property-management company in the area should have these aggregated.
- How much new apartment / multifamily construction is in the pipeline within 1–3 miles? Heavy new supply (>2% of stock underway) typically softens rents 12–24 months out; light construction supports rent growth.
Investment metrics
- 1% rule
- 0.67% ✗
- Cap rate
- 4.97%
- Cash-on-cash
- -4.72%
- DSCR
- 0.79
- GRM
- 12.4
CMA / ARV
- ARV (median comp)
- $1,503,126
- List price
- $995,000
- Delta
- -33.80%
- Verdict
- UNDERPRICED
- Comps
- 16 within 1.0 mi
Projected returns pro-forma
10.0% appreciation · 8.0% rent growth · sell at horizon
- IRR
- 22.3%
- Equity multiple
- 2.82×
- Total profit
- $507,196
- Equity at exit
- $896,375
- IRR
- 21.1%
- Equity multiple
- 6.87×
- Total profit
- $1,635,505
- Equity at exit
- $1,933,066
Cash invested: $278,600 (down + closing). Projections, not guarantees.
Landlord ↔ Tenant lean methodology
- Overall (STATE)
- 15 Strongly Tenant-Friendly
- State New York
- 15 Strongly Tenant-Friendly · D+10
- County
- — inherits STATE
- City
- — inherits STATE
ZIP-level market 12534
- Home prices YoY
- 5.6%
- Rents YoY
- 10.9%
- Active inventory
- 162
- Price-to-rent
- 24.8×
Monthly cashflow live
- Estimated rent
- $6,678 medium interval (Pro) →
- Mortgage (P&I)
- −$5,218
- Tax from tax record
- −$739 /mo · $8,867/yr
- Insurance
- −$415
- HOA
- −$0
- Vacancy / Maint / Mgmt
- −$1,402
- Net cashflow
- $-1,096
Break-even live
Sensitivity live
| Price | -10% $-533 | -5% $-814 | +0% $-1,096 | +5% $-1,377 | +10% $-1,659 |
|---|---|---|---|---|---|
| Rent | -10% $-1,623 | -5% $-1,360 | +0% $-1,096 | +5% $-832 | +10% $-568 |
| Rate | -1.0pp $-595 | -0.5pp $-843 | base $-1,096 | +0.5pp $-1,354 | +1.0pp $-1,616 |
2-unit breakdown (identical units grouped — click to expand)
| Units | Beds | Baths | Est. rent |
|---|---|---|---|
| 2× units | 2 | 1.5 | $6,678 |
| #1 | 2 | 1.5 | $3,339 |
| #2 | 2 | 1.5 | $3,339 |
| Total (2 units) | $6,678 | ||
UW: 25.0% down · 7.5% · 30yr · 1.5% tax · 5.0% vac · 8.0% maint · 8.0% mgmt
Financing live
Cash to close
- Down payment
- $248,750
- Closing costs
- $29,850
- Reserves months
- —
- Total cash needed
- —
Loan-product check · same deal, 3 products live
Conventional
25% down · 7.5% · 30yr
- Down + closing
- —
- Monthly P&I
- —
- Monthly cashflow
- —
- DSCR
- —
- Eligible?
- —
Personal DTI + credit; lowest rate.
DSCR
20% down · 8.5% · 30yr
- Down + closing
- —
- Monthly P&I
- —
- Monthly cashflow
- —
- DSCR
- —
- Eligible?
- —
No personal income docs; deal must DSCR.
Hard money
10% down · 12.0% · 12mo
- Down + closing
- —
- Monthly P&I
- —
- Monthly cashflow
- —
- DSCR
- —
- Eligible?
- —
Short-term bridge; refi at stabilization.
Rent comps 1 comps
| Address | Beds | Baths | Sqft | Rent | $/sqft | DOM | Units | Dist |
|---|---|---|---|---|---|---|---|---|
| 258 Warren St Hudson, NY | 3.0 | 2.0 | 2464 | $5,300 | $2.15 | 24d | 1 | 0.48mi |
Listing history 22 events
-
2026-06-21days on market $995,000 Active 82 DOM
-
2026-06-19days on market $995,000 Active 80 DOM
-
2026-06-18days on market $995,000 Active 79 DOM
-
2026-06-17days on market $995,000 Active 78 DOM
-
2026-06-16days on market $995,000 Active 77 DOM
-
2026-06-15days on market $995,000 Active 76 DOM
-
2026-06-14days on market $995,000 Active 74 DOM
-
2026-06-12days on market $995,000 Active 73 DOM
-
2026-06-09days on market $995,000 Active 70 DOM
-
2026-06-08days on market $995,000 Active 69 DOM
-
2026-06-07days on market $995,000 Active 68 DOM
-
2026-06-04days on market $995,000 Active 64 DOM
-
2026-06-02days on market $995,000 Active 63 DOM
-
2026-06-01days on market $995,000 Active 62 DOM
-
2026-05-31days on market $995,000 Active 61 DOM
-
2026-05-31days on market $995,000 Active 60 DOM
-
2026-03-31$995,000 Active 718-char remark
Show marketing remark (718 chars)
Sky High Bliss A rare opportunity to own a mixed-use gem just half a block from Warren Street. The light-filled retail space below offers a warm, inviting atmosphere with a charming, approachable feel, thoughtfully designed for convenience and flow, ideal for display and customer engagement. Above, an outstanding, freshly painted duplex unfolds with natural light and effortless charm, featuring a rooftop terrace with mountain views, an eat-in cook's kitchen with wood stove, a library and a spacious primary suite with a generous walk-in closet. With wood floors, a stunning staircase, Thermopane windows and central air, there's ample room for a home office and guests. Perfect in any season, simply sublime.
-
2011-03-08soldstatus $325,000
-
2009-07-16soldstatus $229,884
-
2006-04-11soldstatus $325,000
-
2002-08-06soldstatus $150,000
-
1994-07-28soldstatus $80,000
ⓘ Source: listings_history table (triggers on properties + properties_extension) + one-shot
backfill from property_details.listing_events for pre-trigger history.
Tax reassessment forecast NY · Partial reset (capped growth)
- Current annual tax
- $8,867 · $739/mo
- Projected year-2 tax
- $12,841 · $1,070/mo
- Expected delta
- +$3,974/yr (+$331/mo · 44.8%)
ⓘ Screening estimate from a state-policy table — verify with the county assessor before closing.
Climate risk First Street
- Flood 1/10 Low FEMA zone X · 0% chance over 30 yrs
- Wildfire 4/10 Moderate
- Heat 4/10 Moderate 7 d/yr ≥98°F today · 17 d/yr by 30 yrs out
- Wind 3/10 Moderate 7% chance of damaging wind over 30 yrs
- Air quality 2/10 Low 0 unhealthy d/yr today · 1 by 30 yrs out
Nearby sold comps map
Loading sold comps map…
Walkable amenities ~0.75 mi
Loading nearby amenities…
Taxation est. · year 1
- Rental income
- $80,136
- − Mortgage interest
- −$55,735
- − Property taxes
- −$8,867
- − Insurance
- −$4,975
- − Repairs & maintenance
- −$6,411
- − Management
- −$6,411
- − Depreciation
- −$28,945
- Taxable loss
- −$31,208
- Est. tax savings @ 24.0%
- +$7,490
- After-tax cash flow
- $-5,659/yr
For passive investors: Depreciation is non-cash, so a rental often shows a tax loss while cash-flowing — sheltering income. Rental losses are passive: they offset passive income freely, and up to $25,000/yr can offset ordinary (W-2) income if you actively participate and your MAGI is under $100k (phasing out to $0 by $150k); unused losses carry forward. On sale, claimed depreciation is recaptured at up to 25%, and gains may owe capital-gains tax (a 1031 exchange can defer both). Figures are a year-1 estimate at your 24.0% rate — not tax advice; consult a CPA.
Schools (NCES district)
- District
- Hudson City School District
- NCES district ID
- 3614940
- Math proficiency
- 38% ▲ 4.00%
- Reading proficiency
- 47% ▲ 7.00%
- Median HH income
- $44,663
- Composite
- 36.03/100
- National rank
- #4779
- State rank
- #494 of 590 in NY
Livability — Hudson
- Score
- 70/100
- State rank
- #430
- US rank
- #7443
Category grades
Schools grade is shown separately in the Schools card above.
Census & demographics
- Census place
- Hudson, NY
- County
- Columbia County · 17,176 people
- City population
- 17,176
- Metro
- Hudson, NY
- Population (ZIP)
- 17,176
- Household income
- $72,741
- Rent vs Own
- Severe rent burden
- 1083.0
Population outlook (Columbia County) Hauer SSP2
- Today (2025)
- 58,662 people
- By 2030
- 56,557 · -3.6%
- By 2040
- 51,324 · -12.5%
- By 2050
- 45,790 · -21.9%
- By 2075
- 35,232 · -39.9%
- By 2100
- 25,846 · -55.9%
Race, ethnicity, and origin ACS 2023
- Neighborhood character
- Predominantly White (74%)
- Race & ethnicity
- White 74% Two or more races 7% Black 7% Hispanic / Latino 7% Asian 6%
- Hispanic origin (detail)
- Mexican 2% Puerto Rican 1%
- Common ancestry
- Lithuanian 4% Romanian 4% Iranian 3%
- Foreign-born
- 10% · Canada, China
- Languages at home
- 88% English-only · Spanish 5% Other Indo-European 3% Chinese 1%
Political lean MEDSL · Columbia
- 2024 margin
- D (+14.7) · D 57.4% · R 42.6%
- 2008→2024 swing
- +1.3pp toward D · 2008: 13.4pp · 2024: 14.7pp
- All cycles
- 2024: D+14.7 2020: D+16.7 2016: D+1.4 2012: D+11.7 2008: D+13.4
Not yet ingested
- Civics
- —
Market trends
- HPI YoY
- ▲ 25.98%
- Current HPI
- 490.0412
- Rent YoY
- ▲ 10.88%
- Metro
- Hudson, NY
- State GDP YoY
- ▲ 2.60%
- F500 in state
- 92
Industry mix (Fortune 500 HQ in NY)
| Industry | F500 HQs | Revenue |
|---|---|---|
| Financial Services | 10 | $950B |
|
||
| Consumer Goods | 9 | $162B |
|
||
| Insurance | 4 | $225B |
|
||
| Telecommunications | 2 | $144B |
|
||
| Pharmaceuticals | 2 | $112B |
|
||
| Media / Entertainment | 2 | $69B |
|
||
Price history
+1143.8% since first listed6 events — show timeline
- 2026-03-31 Listed $995,000 HVCRMLS
- 2011-03-08 Sold (Public Records) $325,000 Public Records
- 2009-07-16 Sold (Public Records) $229,884 Public Records
- 2006-04-11 Sold (Public Records) $325,000 Public Records
- 2002-08-06 Sold (Public Records) $150,000 Public Records
- 1994-07-28 Sold (Public Records) $80,000 Public Records
Property tax history
+4.4%/yrLatest (2025): $8,867 · -4.6% YoY. Source: county tax records.
Cash-flow waterfall
monthlySold comps — $/sqft
last 12 mo · ≤1 miLoading sold comps…