 Multi-family
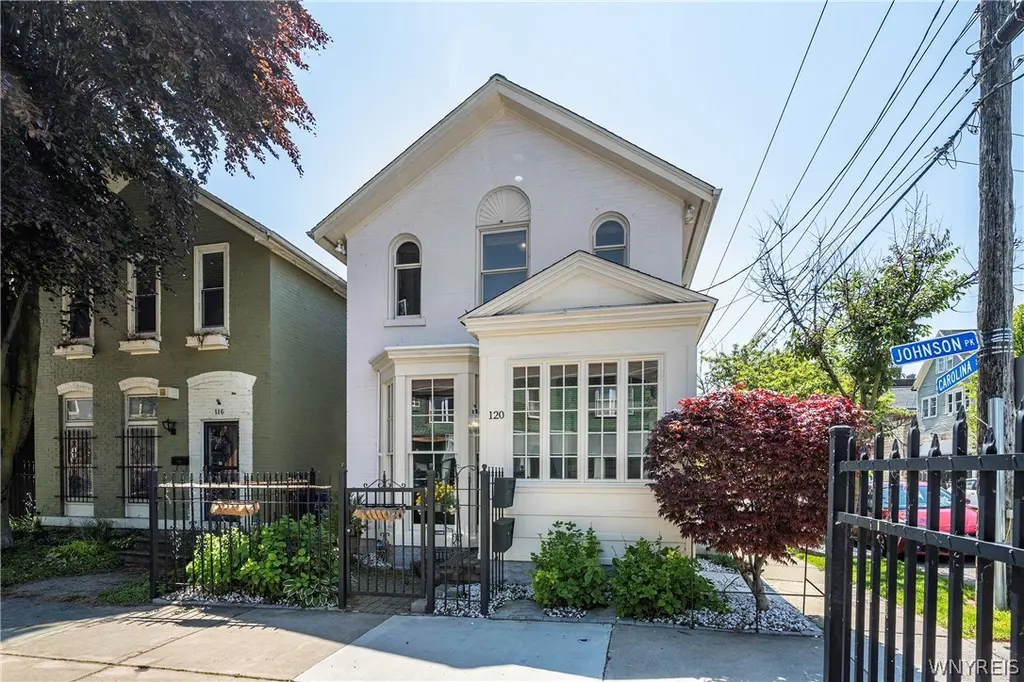
120 Johnson Park · Buffalo, NY
Flood risk 6/10 · Moderate
- FEMA flood zone
- X (unshaded)
- Chance of flooding over 30 yrs
- 0.71%
- Est. flood insurance / yr
- $473 – $860
Fire risk 1/10 · Minimal
- Est. fire insurance / yr
- $691 – $1,283
Heat risk 3/10 · Minor
- Hot days now (above 91°F)
- 7 days/yr
- Hot days in 30 yrs
- 15 days/yr
Wind risk 1/10 · Minimal
- Chance of severe wind over 30 yrs
- —
Air-quality risk 4/10 · Minor
- Unhealthy air days now
- 4 days/yr
- Unhealthy air days in 30 yrs
- 9 days/yr
Risk factors via First Street. Map © Google.
Why this score? — see what drove the D- grade
The composite is a weighted blend of 9 inputs, each scored 0–100. Each bar is that input's sub-score; the figure is the points it added to the 100-point composite (weight × sub-score).
- Cash flow +14.8/30.0
- DSCR +4.5/10.0
- Livability +3.9/5.0
- Rent growth +3.6/5.0
- Schools +3.3/10.0
- 1% rule +2.8/10.0
- Condition / age +2.5/5.0
- ARV discount +0.0/15.0
- Appreciation +0.0/10.0
$399,900
🖨 Deal sheet 📄 Offer letter ✓ Due diligence
Multi-family units
County records classify this as Multi-Family (2-4 Unit). Listing-text estimate: 1 unit. estimate disagrees with records
Listing remarks
Welcome to this chic, completely rebuilt two-unit property in the heart of Downtown Buffalo, offering the perfect blend of historic charm and modern luxury. Both units have been thoughtfully renovated from top to bottom with exceptional attention to detail. The front residence features 2 spacious bedrooms, 1.5 baths, gleaming hardwood floors, soaring vaulted ceilings, abundant natural light from oversized windows, and a stunning decorative fireplace. The open-concept design flows seamlessly into a beautifully updated kitchen complete with granite countertops, stainless steel appliances, and ample cabinetry. Generous bedrooms, plentiful closet space, and a stylishly renovated bath complete t
Key facts
- Completely rebuilt
- Historic charm
- Modern luxury
Tags
Property features AI
Finance
- Financial info: Owner pays grounds care and water; Rent includes common area maintenance and water; Operating expense details: see remarks; Property zoned for two residential units; Two total units with separate gas and electric meters
Exterior
- Parking: On-street parking
- Utilities: High-speed internet available; Public water connected; Sewer connected
- Home design: 2 stories; Existing construction
- Construction: Brick construction; Shingle roof; Stone foundation
- Exterior features: Near public transit; Rectangular residential lot; City street frontage
Interior
- Flooring: Hardwood flooring; Tile flooring; Varied flooring
- Bathrooms: Two full bathrooms; One half bathroom
- Heating & cooling: Gas forced air heating; Central air conditioning; Has heating and cooling
- Interior features: Ceiling fan(s); Skylights; Skylight(s)
- Laundry & utility: Washer hookup; Gas water heater
Neighborhood map
What this means for you Summary
Snapshot
- This is a 4-bed/2.5-bath multifamily listed at $400k.
Deal economics
- At list price, monthly cash flow is $110 ($1k/yr) — positive.
- The deal already cash-flows at list — no discount required.
- To meet the 1% rule (rent ≥ 1% of price), the offer needs to be $312k (21.9% below list).
- Recommended offer: $312k (21.9% below list) — sets the bar for 1% rule.
Location & tenants
- Location reads 77/100 on livability (#195 in NY, #3,011 nationally) — a middle-class / working-renter tenant base. Strengths: commute A+, housing A+, health & safety A+; Watch: crime F, employment D-.
- Buffalo City School District (urban): math 41% / reading 40% proficiency, ranked #535 of 590 in NY (top 91%) — families likely to look elsewhere, expect single-tenant / working-renter base with shorter leases; 75% free/reduced lunch — lower-income household profile, screen leases tightly.
- Market conditions: Rents rising fast (+4.3%/yr); 56 active listings in the ZIP; 8 comparable units currently listed for rent nearby; rentals at typical pace (median 24d on market — plan ~3-4 weeks tenant-placement turnaround); lower-income renter base — watch delinquency; 1,244 units permitted in Erie County in 2024 (563 in 5+ unit buildings).
- At $3,125/mo this rent would consume 93% of the median local household income ($41k/yr) (locally 1213% of renters already pay >50% of income on rent) — very limited rent-growth headroom before tenants either downsize or default.
Forward outlook
- Local home prices are declining (-3.0%/yr); year-one equity from $3k of loan paydown is wiped out by about $12k of value loss. Plan a longer hold.
Negotiation context
- Only 10 days on market — expect competitive offers; lowballing is unlikely to land.
- 6 sale attempts since 7y ago with the ask held roughly flat each time — persistent listings suggest the price (not the market) is what's stuck; bring a comps-based counter.
Risks & watch-outs
- Watch-outs: built in 1866 — expect roof / HVAC / electrical / plumbing capex.
- Climate carrying-cost: major flood risk — expect insurance premiums to compound above CPI over the hold.
Questions for the listing agent
- Built in 1866 — when were the roof, HVAC, electrical panel, plumbing, and water heater last replaced?
- Is there a deadline driving the sale (1031 exchange, divorce, estate, relocation)? That informs how much negotiation room exists.
- Crime grade is F in this area — have there been break-ins, vandalism, or insurance claims at this property in the last 3 years? What carrier currently insures it and at what premium?
- The area grade is low — what's the realistic commute time and amenity access for the typical tenant pool here? Any planned neighborhood developments (good or bad) we should know about?
- What's the average days-on-market for RENTAL listings here right now (not sales)? A rising rental-DOM trend means longer vacancies and softer asking-rent achievability than the comps imply.
- What's the recent tenant-quality profile in this submarket — average credit score on applications, eviction rate, late-payment / NSF rate, and stable-employment percentage? A property-management company in the area should have these aggregated.
- How much new apartment / multifamily construction is in the pipeline within 1–3 miles? Heavy new supply (>2% of stock underway) typically softens rents 12–24 months out; light construction supports rent growth.
Investment metrics
- 1% rule
- 0.78% ✗
- Cap rate
- 6.62%
- Cash-on-cash
- 1.18%
- DSCR
- 1.05
- GRM
- 10.7
CMA / ARV
- ARV (on-the-fly)
- $328,928
- Comps found
- 12
Show comp detail 12 sales within ~0.75 mi
| Address | Dist | Beds/Ba | Sqft | Sold | Price | $/sf | Match |
|---|---|---|---|---|---|---|---|
| 9 West Ave | 0.07mi | 4/2.0 | 1,980 (-8%) | 6mo | $390,000 | $197 | 75 |
| 125 Whitney Pl | 0.12mi | 4/3.0 | 1,976 (-9%) | 6mo | $310,000 | $157 | 73 |
| 147 Mariner St | 0.56mi | 4/3.0 | 2,098 (-3%) | 4mo | $365,000 | $174 | 64 |
| 403 Busti Ave | 0.54mi | 4/2.0 | 2,132 (-2%) | 12mo | $99,000 | $46 | 60 |
| 347 Prospect Ave | 0.45mi | 5/2.0 (+1) | 2,152 (-1%) | 15mo | $115,000 | $53 | 59 |
| 114 Whitney Pl | 0.10mi | 5/2.0 (+1) | 2,452 (+13%) | 14mo | $320,000 | $131 | 54 |
| 291 West Ave | 0.58mi | 5/2.0 (+1) | 2,140 (-1%) | 12mo | $325,500 | $152 | 54 |
| 153 Allen St | 0.51mi | 4/3.0 | 2,374 (+10%) | 9mo | $395,000 | $166 | 50 |
| 402 Busti Ave | 0.56mi | 4/2.0 | 2,028 (-6%) | 14mo | $80,000 | $39 | 50 |
| 155 Allen St | 0.51mi | 4/3.0 | 2,488 (+15%) | 9mo | $385,000 | $155 | 42 |
| 35 Lakeview Ave | 0.71mi | 5/2.0 (+1) | 2,270 (+5%) | 16mo | $135,000 | $59 | 38 |
| 389 Jersey St | 0.71mi | 4/2.0 | 2,371 (+10%) | 13mo | $250,000 | $105 | 38 |
Match score weights: distance 35% · size 25% · config 20% · recency 20%. Top-matched comps best support the ARV.
Projected returns pro-forma
-3.0% appreciation · 4.28% rent growth · sell at horizon
- IRR
- -13.3%
- Equity multiple
- 0.52×
- Total profit
- $-53,934
- Equity at exit
- $59,626
- IRR
- -2.7%
- Equity multiple
- 0.81×
- Total profit
- $-21,612
- Equity at exit
- $34,576
Cash invested: $111,972 (down + closing). Projections, not guarantees.
Landlord ↔ Tenant lean methodology
- Overall (STATE)
- 15 Strongly Tenant-Friendly
- State New York
- 15 Strongly Tenant-Friendly · D+10
- County
- — inherits STATE
- City
- — inherits STATE
ZIP-level market 14201
- Home prices YoY
- -19.1%
- Rents YoY
- 4.3%
- Active inventory
- 56
- Price-to-rent
- 21.3×
Monthly cashflow live
- Estimated rent
- $3,125 high interval (Pro) →
- Mortgage (P&I)
- −$2,097
- Tax from tax record
- −$95 /mo · $1,143/yr
- Insurance
- −$167
- HOA
- −$0
- Vacancy / Maint / Mgmt
- −$656
- Net cashflow
- $110
Break-even live
2-unit breakdown (identical units grouped — click to expand)
| Units | Beds | Baths | Est. rent |
|---|---|---|---|
| 1× unit | 2 | 1.5 | $1,563 |
| 1× unit | 2 | 1 | $1,563 |
| Total (2 units) | $3,125 | ||
UW: 25.0% down · 7.5% · 30yr · 1.5% tax · 5.0% vac · 8.0% maint · 8.0% mgmt
Financing live
Cash to close
- Down payment
- $99,975
- Closing costs
- $11,997
- Reserves months
- —
- Total cash needed
- —
Loan-product check · same deal, 3 products live
Conventional
25% down · 7.5% · 30yr
- Down + closing
- —
- Monthly P&I
- —
- Monthly cashflow
- —
- DSCR
- —
- Eligible?
- —
Personal DTI + credit; lowest rate.
DSCR
20% down · 8.5% · 30yr
- Down + closing
- —
- Monthly P&I
- —
- Monthly cashflow
- —
- DSCR
- —
- Eligible?
- —
No personal income docs; deal must DSCR.
Hard money
10% down · 12.0% · 12mo
- Down + closing
- —
- Monthly P&I
- —
- Monthly cashflow
- —
- DSCR
- —
- Eligible?
- —
Short-term bridge; refi at stabilization.
Rent comps 8 comps
| Address | Beds | Baths | Sqft | Rent | $/sqft | DOM | Units | Dist |
|---|---|---|---|---|---|---|---|---|
| 550 Busti Ave Unit 2 Buffalo, NY | 3.0 | 1.0 | 1638 | $1,500 | $0.92 | 43d | 1 | 0.78mi |
| 124 Normal Ave Unit 2 Buffalo, NY | 3.0 | 1.0 | 1727 | $2,000 | $1.16 | 23d | 1 | 0.80mi |
| 237 Main St Buffalo, NY | 1.0–3.0 | 1.5–2.5 | 1608 | $4,035 | $2.51 | 1d | 9 | 0.88mi |
| 184 14th St Buffalo, NY | 4.0 | 2.0 | 1950 | $4,400 | $2.26 | 23d | 1 | 0.93mi |
| 501 West Ave Buffalo, NY | 3.0 | 1.0 | 2552 | $1,850 | $0.72 | 19d | 1 | 0.99mi |
| 501 West Ave Buffalo, NY | 3.0 | 1.0 | 2552 | $1,700 | $0.67 | 14d | 1 | 0.99mi |
| 330 Bryant St Buffalo, NY | 3.0 | 2.0 | 2224 | $2,200 | $0.99 | 19d | 1 | 1.09mi |
| 161 16th St Buffalo, NY | 3.0 | 1.5 | 1500 | $2,000 | $1.33 | 23d | 1 | 1.09mi |
Listing history 7 events
-
2026-06-13statusdays on market $399,900 Pending 10 DOM
-
2026-06-10days on market $399,900 Active 8 DOM
-
2026-06-09days on market $399,900 Active 7 DOM
-
2026-06-08days on market $399,900 Active 6 DOM
-
2026-06-07days on market $399,900 Active 5 DOM
-
2026-06-02remarks 699-char remark
-
2026-06-02$399,900 Active 1 DOM
ⓘ Source: listings_history table (triggers on properties + properties_extension) + one-shot
backfill from property_details.listing_events for pre-trigger history.
Tax reassessment forecast NY · Partial reset (capped growth)
- Current annual tax
- $1,143 · $95/mo
- Projected year-2 tax
- $3,950 · $329/mo
- Expected delta
- +$2,808/yr (+$234/mo · 245.7%)
ⓘ Screening estimate from a state-policy table — verify with the county assessor before closing.
Climate risk First Street
- Flood 6/10 Major FEMA zone X (unshaded) · 71% chance over 30 yrs
- Wildfire 1/10 Low
- Heat 3/10 Moderate 7 d/yr ≥91°F today · 15 d/yr by 30 yrs out
- Wind 1/10 Low
- Air quality 4/10 Moderate 4 unhealthy d/yr today · 9 by 30 yrs out
Nearby sold comps map
Loading sold comps map…
Walkable amenities ~0.75 mi
Loading nearby amenities…
Taxation est. · year 1
- Rental income
- $37,500
- − Mortgage interest
- −$22,401
- − Property taxes
- −$1,143
- − Insurance
- −$2,000
- − Repairs & maintenance
- −$3,000
- − Management
- −$3,000
- − Depreciation
- −$11,633
- Taxable loss
- −$5,676
- Est. tax savings @ 24.0%
- +$1,362
- After-tax cash flow
- $2,680/yr
For passive investors: Depreciation is non-cash, so a rental often shows a tax loss while cash-flowing — sheltering income. Rental losses are passive: they offset passive income freely, and up to $25,000/yr can offset ordinary (W-2) income if you actively participate and your MAGI is under $100k (phasing out to $0 by $150k); unused losses carry forward. On sale, claimed depreciation is recaptured at up to 25%, and gains may owe capital-gains tax (a 1031 exchange can defer both). Figures are a year-1 estimate at your 24.0% rate — not tax advice; consult a CPA.
Schools (NCES district)
- District
- Buffalo City School District
- NCES district ID
- 3605850
- Math proficiency
- 41% ▲ 11.00%
- Reading proficiency
- 40% ▲ 7.00%
- Median HH income
- $31,665
- Composite
- 33.17/100
- National rank
- #5544
- State rank
- #535 of 590 in NY
Livability — Buffalo
- Score
- 77/100
- State rank
- #195
- US rank
- #3011
Category grades
Schools grade is shown separately in the Schools card above.
Census & demographics
- Census place
- Buffalo, NY
- County
- Erie County · 714,559 people
- City population
- 440,021
- Metro
- Buffalo-Cheektowaga, NY
- Population (ZIP)
- 12,369
- Household income
- $40,512
- Rent vs Own
- Severe rent burden
- 1213.0
Population outlook (Erie County) Hauer SSP2
- Today (2025)
- 933,037 people
- By 2030
- 935,181 · +0.2%
- By 2040
- 928,531 · -0.5%
- By 2050
- 905,725 · -2.9%
- By 2075
- 834,037 · -10.6%
- By 2100
- 708,033 · -24.1%
Race, ethnicity, and origin ACS 2023
- Neighborhood character
- Diverse neighborhood (Simpson 0.66)
- Race & ethnicity
- White 42% Hispanic / Latino 36% Black 16% Two or more races 12% Asian 2% Native American 1%
- Hispanic origin (detail)
- Mexican 4% Puerto Rican 30% Dominican 1%
- Common ancestry
- Romanian 7% Subsaharan African 2% Slovak 1%
- Foreign-born
- 8% · Canada, China
- Languages at home
- 69% English-only · Spanish 24% Arabic 2% Other Indo-European 1%
Political lean MEDSL · Erie
- 2024 margin
- Lean D (+9.7) · D 54.8% · R 45.2%
- 2008→2024 swing
- -7.9pp toward R · 2008: 17.5pp · 2024: 9.7pp
- All cycles
- 2024: D+9.7 2020: D+14.7 2016: D+4.8 2012: D+15.6 2008: D+17.5
Not yet ingested
- Civics
- —
Market trends
- HPI YoY
- ▼ -68.73%
- Current HPI
- 290.2643
- Rent YoY
- ▲ 4.28%
- Metro
- Buffalo-Cheektowaga, NY
- State GDP YoY
- ▲ 2.60%
- F500 in state
- 92
Industry mix (Fortune 500 HQ in NY)
| Industry | F500 HQs | Revenue |
|---|---|---|
| Financial Services | 10 | $950B |
|
||
| Consumer Goods | 9 | $162B |
|
||
| Insurance | 4 | $225B |
|
||
| Telecommunications | 2 | $144B |
|
||
| Pharmaceuticals | 2 | $112B |
|
||
| Media / Entertainment | 2 | $69B |
|
||
Price history
+0.0% since first listed17 events — show timeline
- 2026-06-02 Listed $399,900 WNYREIS
- 2025-07-04 Rental Removed $2,200 WNYREIS
- 2025-05-28 Price Changed $2,200 WNYREIS
- 2025-02-14 Listed for Rent $2,400 WNYREIS
- 2020-09-22 Listing Removed — WNYREIS
- 2020-09-22 Listing Removed — WNYREIS
- 2020-09-03 Price Changed $385,000 WNYREIS
- 2020-09-03 Price Changed $385,000 WNYREIS
- 2020-06-22 Listed $400,000 WNYREIS
- 2020-06-22 Listed $400,000 WNYREIS
- 2019-12-04 Sold (Public Records) $370,000 Public Records
- 2019-12-01 Sold (MLS) $370,000 WNYREIS
- 2019-10-05 Pending — WNYREIS
- 2019-08-27 Listing Removed — WNYREIS
- 2019-08-26 Listed $384,900 WNYREIS
- 2019-08-19 Price Changed $384,900 WNYREIS
- 2019-06-04 Listed $399,900 WNYREIS
Property tax history
+7.0%/yrLatest (2025): $1,143 · -2.9% YoY. Source: county tax records.
Cash-flow waterfall
monthlySold comps — $/sqft
last 12 mo · ≤1 miLoading sold comps…