1747 E Old Topside Rd · Alcoa, TN
Flood risk 10/10 · Severe
- FEMA flood zone
- X (unshaded)
- Chance of flooding over 30 yrs
- 0.99%
- Est. flood insurance / yr
- $473 – $860
Fire risk 4/10 · Minor
- Est. fire insurance / yr
- $949 – $1,763
Heat risk 5/10 · Moderate
- Hot days now (above 103°F)
- 7 days/yr
- Hot days in 30 yrs
- 20 days/yr
Wind risk 2/10 · Minimal
- Chance of severe wind over 30 yrs
- —
Air-quality risk 4/10 · Minor
- Unhealthy air days now
- 4 days/yr
- Unhealthy air days in 30 yrs
- 5 days/yr
Risk factors via First Street. Map © Google.
Why this score? — see what drove the B- grade
The composite is a weighted blend of 9 inputs, each scored 0–100. Each bar is that input's sub-score; the figure is the points it added to the 100-point composite (weight × sub-score).
- Cash flow +30.0/30.0
- 1% rule +10.0/10.0
- DSCR +10.0/10.0
- ARV discount +7.5/15.0
- Livability +3.4/5.0
- Schools +2.6/10.0
- Condition / age +2.5/5.0
- Rent growth +2.4/5.0
- Appreciation +0.0/10.0
$109,900
🖨 Deal sheet 📄 Offer letter ✓ Due diligence
Listing remarks MLS
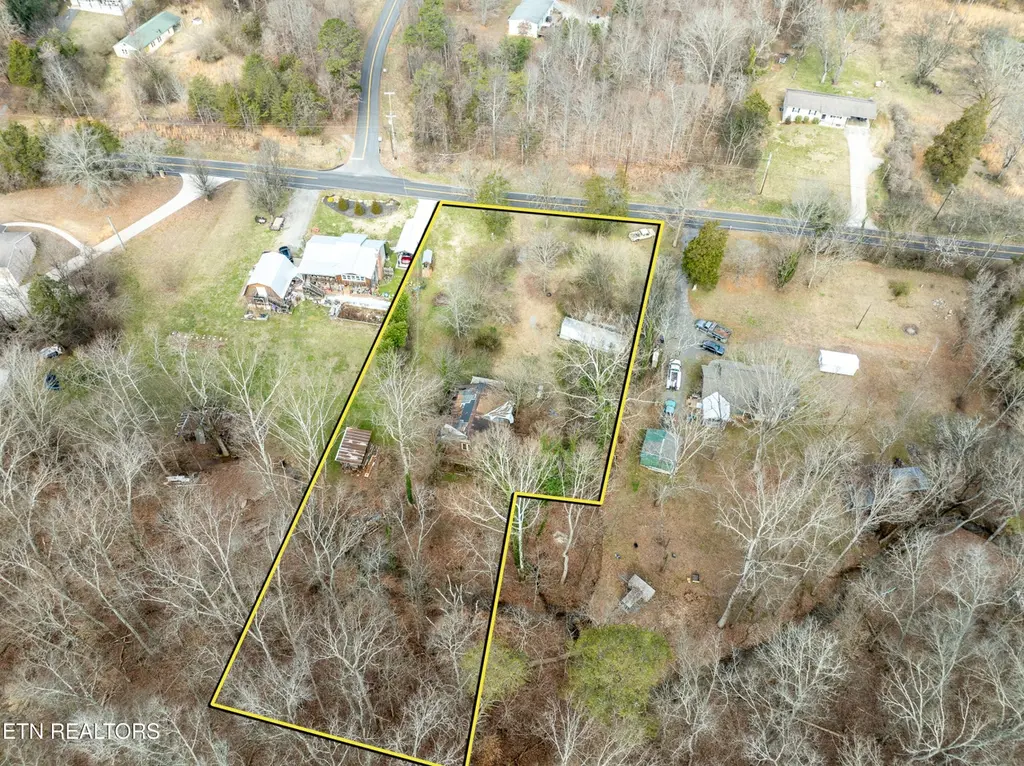
Sitting on .93 acres, this contractor's special could turn into your next flip or build! Schedule your showing today!
Key facts
- Convenient location
- Room to build equity
- 0.93 acre lot
Tags
Neighborhood map
What this means for you Summary
Snapshot
- This is a 3-bed/1.0-bath other listed at $110k.
Deal economics
- At list price, monthly cash flow is $537 ($6k/yr) — positive.
- The deal already cash-flows at list — no discount required.
- Meets the 1% rule at list price ($2k rent vs $110k).
- Recommended offer: $100k (9.0% below list) — sets the bar for market timing.
- Cap rate 12.8% vs local median 2.8% in Alcoa — top-decile yield for the area; either an underpriced asset or a hidden risk that comps aren't pricing in. Stress-test before assuming the spread holds.
Location & tenants
- Location reads 67/100 on livability (#107 in TN) — a middle-class / working-renter tenant base. Strengths: cost of living A+, housing A+, health & safety A-; Watch: crime C-, employment D, schools D-.
- Blount County (rural): math 29% / reading 31% proficiency, ranked #52 of 139 in TN (top 37%) — families likely to look elsewhere, expect single-tenant / working-renter base with shorter leases.
- Market conditions: Rents soft (-0.4%/yr); 69 active listings in the ZIP; 5 comparable units currently listed for rent nearby; rentals at typical pace (median 23d on market — plan ~3-4 weeks tenant-placement turnaround); 40% of comp listings sitting > 30 days — soft ceiling on asking rent; solid renter incomes; 937 units permitted in Blount County in 2024 (57 in 5+ unit buildings).
Forward outlook
- Local home prices are declining (-3.0%/yr); year-one equity from $760 of loan paydown is wiped out by about $3k of value loss. Plan a longer hold.
- Blount County population projected at +8% by 2050 — modest demand growth; plan on rents tracking national, not racing it.
- At projected returns (-3.0% appreciation + 0.0% rent growth), your $31k cash investment doubles in ~8 years — after that, you're playing with house money.
Negotiation context
- It's been on market 112 days — a 9% lower offer ($100k) is reasonable based on typical stale-listing flexibility.
- 2 sale attempts; this cycle's ask has dropped $20k (15%) from the opening price — seller is motivated, your offer sets the floor, not the list.
- Current owner paid $15k; list at $110k implies a 633% gain — meaningful room to come down on a strong offer.
Risks & watch-outs
- Watch-outs: flood insurance adds $56/mo.
- Climate carrying-cost: severe flood risk; extreme-heat days projected 7→20/yr by 2055 (HVAC capex compounding) — expect insurance premiums to compound above CPI over the hold.
Questions for the listing agent
- It's been on market 112 days. Have you received any prior offers? Is the seller open to a 9% concession, seller financing, or rate buy-down credit?
- What's the actual annual flood-insurance premium (NFIP or private), and is the property in a SFHA with mandatory coverage?
- Why hasn't it sold? Are there any deal-killer items the seller is aware of (foundation, flood, title, zoning, code violations)?
- Is there a deadline driving the sale (1031 exchange, divorce, estate, relocation)? That informs how much negotiation room exists.
- Schools are D-rated, which usually means shorter tenancies and higher turnover. Who's the typical renter profile here, and what's been the actual vacancy rate?
- What's the average days-on-market for RENTAL listings here right now (not sales)? A rising rental-DOM trend means longer vacancies and softer asking-rent achievability than the comps imply.
- What's the recent tenant-quality profile in this submarket — average credit score on applications, eviction rate, late-payment / NSF rate, and stable-employment percentage? A property-management company in the area should have these aggregated.
- How much new for-sale + rental construction is in the pipeline within 1–3 miles? Heavy new supply typically softens prices + rents 12–24 months out; constrained supply supports both.
Investment metrics
- 1% rule
- 1.56% ✓
- Cap rate
- 12.77%
- Cash-on-cash
- 23.12%
- DSCR
- 2.03
- GRM
- 5.4
CMA / ARV
- ARV (median comp)
- $228,944
- List price
- $109,900
- Delta
- -52.00%
- Verdict
- UNDERPRICED
- Comps
- 5 within 1.0 mi
Projected returns pro-forma
-3.0% appreciation · 0.0% rent growth · sell at horizon
- IRR
- 9.8%
- Equity multiple
- 1.37×
- Total profit
- $11,453
- Equity at exit
- $16,386
- IRR
- 16.2%
- Equity multiple
- 2.13×
- Total profit
- $34,892
- Equity at exit
- $9,502
Cash invested: $30,772 (down + closing). Projections, not guarantees.
Landlord ↔ Tenant lean methodology
- Overall (STATE)
- 87 Strongly Landlord-Friendly
- State Tennessee
- 87 Strongly Landlord-Friendly · R+13
- County
- — inherits STATE
- City
- — inherits STATE
ZIP-level market 37777
- Home prices YoY
- -18.4%
- Rents YoY
- -0.4%
- Active inventory
- 69
- Price-to-rent
- 5.4×
Monthly cashflow live
- Estimated rent
- $1,712 high interval (Pro) →
- Mortgage (P&I)
- −$576
- Tax est. 1.5%
- −$137 /mo · $1,648/yr
- Insurance
- −$46
- Flood insurance flood zone
- −$56 /mo · $666/yr
- HOA
- −$0
- Vacancy / Maint / Mgmt
- −$359
- Net cashflow
- $537
Break-even live
UW: 25.0% down · 7.5% · 30yr · 1.5% tax · 5.0% vac · 8.0% maint · 8.0% mgmt
Financing live
Cash to close
- Down payment
- $27,475
- Closing costs
- $3,297
- Reserves months
- —
- Total cash needed
- —
Loan-product check · same deal, 3 products live
Conventional
25% down · 7.5% · 30yr
- Down + closing
- —
- Monthly P&I
- —
- Monthly cashflow
- —
- DSCR
- —
- Eligible?
- —
Personal DTI + credit; lowest rate.
DSCR
20% down · 8.5% · 30yr
- Down + closing
- —
- Monthly P&I
- —
- Monthly cashflow
- —
- DSCR
- —
- Eligible?
- —
No personal income docs; deal must DSCR.
Hard money
10% down · 12.0% · 12mo
- Down + closing
- —
- Monthly P&I
- —
- Monthly cashflow
- —
- DSCR
- —
- Eligible?
- —
Short-term bridge; refi at stabilization.
Rent comps 5 comps
| Address | Beds | Baths | Sqft | Rent | $/sqft | DOM | Units | Dist |
|---|---|---|---|---|---|---|---|---|
| 1540 E Old Topside Rd Louisville, TN | 2.0 | 1.0 | 750 | $1,200 | $1.60 | 23d | 1 | 0.37mi |
| 1918 Topside Rd Louisville, TN | 2.0 | 1.5 | 1100 | $1,498 | $1.36 | 2d | 2 | 0.94mi |
| 4839 Riversedge Rd Louisville, TN | 2.0 | 2.0 | 936 | $1,950 | $2.08 | 43d | 1 | 0.99mi |
| 910 Ardmore Alcoa Way Louisville, TN | 1.0–3.0 | 1.0–2.0 | 1232 | $2,137 | $1.73 | 2d | 12 | 1.23mi |
| 910 Ardmore Alcoa Way Louisville, TN | 1.0–3.0 | 1.0–2.0 | 1232 | $2,252 | $1.83 | 43d | 23 | 1.23mi |
Listing history 20 events
-
2026-06-18days on market $109,900 Active 112 DOM
-
2026-06-17pricedays on market $109,900 Active 111 DOM
-
2026-06-16days on market $119,900 Active 110 DOM
-
2026-06-15days on market $119,900 Active 109 DOM
-
2026-06-14days on market $119,900 Active 107 DOM
-
2026-06-13days on market $119,900 Active 106 DOM
-
2026-06-10days on market $119,900 Active 104 DOM
-
2026-06-09days on market $119,900 Active 103 DOM
-
2026-06-08days on market $119,900 Active 102 DOM
-
2026-06-07days on market $119,900 Active 101 DOM
-
2026-06-03days on market $119,900 Active 97 DOM
-
2026-06-02days on market $119,900 Active 96 DOM
-
2026-06-01days on market $119,900 Active 95 DOM
-
2026-05-31days on market $119,900 Active 94 DOM
-
2026-05-31days on market $119,900 Active 93 DOM
-
2026-05-01price $119,900 119-char remark
Show marketing remark (119 chars)
Sitting on .93 acres, this contractor's special could turn into your next flip or build! Schedule your showing today!
-
2026-04-27status Active 119-char remark
Show marketing remark (119 chars)
Sitting on .93 acres, this contractor's special could turn into your next flip or build! Schedule your showing today!
-
2026-03-01historical Pending - Continue to Show 119-char remark
Show marketing remark (119 chars)
Sitting on .93 acres, this contractor's special could turn into your next flip or build! Schedule your showing today!
-
2026-02-25$129,900 Active 119-char remark
Show marketing remark (119 chars)
Sitting on .93 acres, this contractor's special could turn into your next flip or build! Schedule your showing today!
-
2014-05-05soldstatus $15,000
ⓘ Source: listings_history table (triggers on properties + properties_extension) + one-shot
backfill from property_details.listing_events for pre-trigger history.
Climate risk First Street
- Flood 10/10 Extreme FEMA zone X (unshaded) · 99% chance over 30 yrs
- Wildfire 4/10 Moderate
- Heat 5/10 Major 7 d/yr ≥103°F today · 20 d/yr by 30 yrs out
- Wind 2/10 Low
- Air quality 4/10 Moderate 4 unhealthy d/yr today · 5 by 30 yrs out
Nearby sold comps map
Loading sold comps map…
Walkable amenities ~0.75 mi
Loading nearby amenities…
Taxation est. · year 1
- Rental income
- $20,541
- − Mortgage interest
- −$6,156
- − Property taxes
- −$1,648
- − Insurance
- −$1,216
- − Repairs & maintenance
- −$1,643
- − Management
- −$1,643
- − Depreciation
- −$3,197
- Taxable income
- $5,037
- Est. tax owed @ 24.0%
- −$1,209
- After-tax cash flow
- $5,238/yr
For passive investors: Depreciation is non-cash, so a rental often shows a tax loss while cash-flowing — sheltering income. Rental losses are passive: they offset passive income freely, and up to $25,000/yr can offset ordinary (W-2) income if you actively participate and your MAGI is under $100k (phasing out to $0 by $150k); unused losses carry forward. On sale, claimed depreciation is recaptured at up to 25%, and gains may owe capital-gains tax (a 1031 exchange can defer both). Figures are a year-1 estimate at your 24.0% rate — not tax advice; consult a CPA.
Schools (NCES district)
- District
- Blount County
- NCES district ID
- 4700300
- Math proficiency
- 29% ▼ -7.00%
- Reading proficiency
- 31% ▼ -2.00%
- Median HH income
- $47,764
- Composite
- 25.99/100
- National rank
- #7322
- State rank
- #52 of 139 in TN
Livability — Alcoa
- Score
- 67/100
- State rank
- #107
- US rank
- #10989
Category grades
Schools grade is shown separately in the Schools card above.
Census & demographics
- County
- Blount County · 112,418 people
- City population
- 10,247
- Metro
- Knoxville, TN
- Population (ZIP)
- 12,877
- Household income
- $75,648
- Rent vs Own
- Severe rent burden
- 153.0
Population outlook (Blount County) Hauer SSP2
- Today (2025)
- 135,873 people
- By 2030
- 139,460 · +2.6%
- By 2040
- 144,767 · +6.5%
- By 2050
- 147,393 · +8.5%
- By 2075
- 151,597 · +11.6%
- By 2100
- 147,393 · +8.5%
Race, ethnicity, and origin ACS 2023
- Neighborhood character
- Predominantly White (86%)
- Race & ethnicity
- White 86% Hispanic / Latino 9% Two or more races 8% Black 2%
- Hispanic origin (detail)
- Mexican 7%
- Common ancestry
- Slovak 5% Serbian 3% Italian 3%
- Foreign-born
- 8% · Canada
- Languages at home
- 90% English-only · Spanish 8% German/W. Germanic 1% Arabic 1%
Political lean MEDSL · Blount
- 2024 margin
- Solid R (+47.7) · D 25.5% · R 73.2% · Other 1.2%
- 2008→2024 swing
- -8.4pp toward R · 2008: -39.4pp · 2024: -47.7pp
- All cycles
- 2024: R+47.7 2020: R+44.2 2016: R+48.8 2012: R+45.7 2008: R+39.4
Not yet ingested
- Civics
- —
Market trends
- HPI YoY
- ▼ -78.63%
- Current HPI
- 348.0214
- Rent YoY
- ▼ -0.43%
- Metro
- Knoxville, TN
- State GDP YoY
- ▲ 2.78%
- F500 in state
- 22
Industry mix (Fortune 500 HQ in TN)
| Industry | F500 HQs | Revenue |
|---|---|---|
| Healthcare | 3 | $91B |
|
||
| Retail | 3 | $72B |
|
||
| Transportation / Logistics | 1 | $88B |
|
||
| Paper / Packaging | 1 | $19B |
|
||
| Insurance | 1 | $13B |
|
||
| Energy | 1 | $12B |
|
||
Price history
+699.3% since first listed5 events — show timeline
- 2026-05-01 Price Changed $119,900 Knoxville MLS
- 2026-04-27 Relisted — Knoxville MLS
- 2026-03-01 Contingent — Knoxville MLS
- 2026-02-25 Listed $129,900 Knoxville MLS
- 2014-05-05 Sold (Public Records) $15,000 Public Records
Property tax history
-3.6%/yrLatest (2025): $161 · +0.0% YoY. Source: county tax records.
Cash-flow waterfall
monthlySold comps — $/sqft
last 12 mo · ≤1 miLoading sold comps…