 🏗️ New Construction
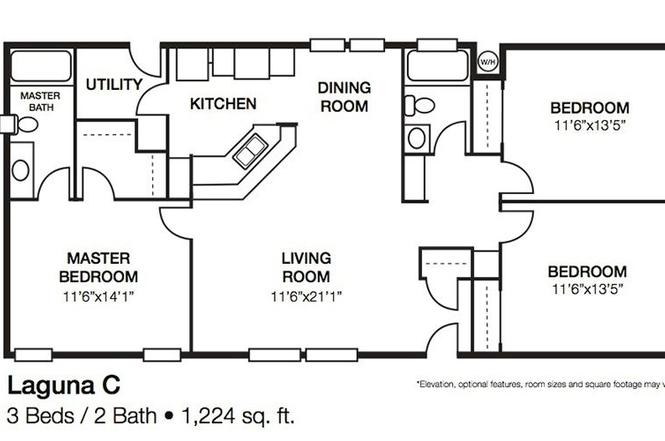
Laguna D 3/2 Plan · Hemet, CA
Flood risk 1/10 · Minimal
- FEMA flood zone
- X (unshaded)
- Chance of flooding over 30 yrs
- 0.0%
- Est. flood insurance / yr
- $507 – $1,088
Fire risk 7/10 · Major
- Est. fire insurance / yr
- $659 – $1,223
Heat risk 7/10 · Major
- Hot days now (above 105°F)
- 7 days/yr
- Hot days in 30 yrs
- 19 days/yr
Wind risk 1/10 · Minimal
- Chance of severe wind over 30 yrs
- —
Air-quality risk 6/10 · Moderate
- Unhealthy air days now
- 9 days/yr
- Unhealthy air days in 30 yrs
- 11 days/yr
Risk factors via First Street. Map © Google.
Why this score? — see what drove the B grade
The composite is a weighted blend of 9 inputs, each scored 0–100. Each bar is that input's sub-score; the figure is the points it added to the 100-point composite (weight × sub-score).
- Cash flow +30.0/30.0
- 1% rule +10.0/10.0
- DSCR +10.0/10.0
- ARV discount +7.5/15.0
- Condition / age +4.0/5.0
- Rent growth +3.4/5.0
- Livability +2.6/5.0
- Schools +2.5/10.0
- Appreciation +0.0/10.0
$84,508
🖨 Deal sheet (PDF) 📄 Offer letter ✓ Due diligence
Listing remarks
55+ age qualified community. This home has a three bedroom, two bath layout that has features for those who seek to live large! The generously sized master bedroom boasts a luxurious en suite bath complete with full tub and ample closet space. Both the master bedroom and living room also come fully wired to accommodate a ceiling fan. A split-floor plan provides the maximum in privacy as it divides the two additional bedrooms from the master suite, making it your own private oasis. In addition to brand new energy efficient appliances, the kitchen also includes a 10 foot breakfast area as well as an adjoining utility room pre-wired with washer and dryer hook-ups. Come see how easy it is to ma
Key facts
- Utility room
- Master bedroom
- En suite bath
Tags
Property features AI
Finance
- Financial info: List price $84,508
Exterior
- Home design: Single-family plan (Laguna D 3/2)
- Exterior features: Address: Laguna D 3/2 Plan, Hemet, CA 92545
Interior
- Bedrooms: 3 bedrooms
- Bathrooms: 2 full bathrooms
- Interior features: Plan: Laguna D 3/2
Neighborhood map
What this means for you Summary
Snapshot
- This is a 3-bed/2.0-bath manufactured listed at $85k. Condition is rated good.
Deal economics
- At list price, monthly cash flow is $1k ($15k/yr) — positive.
- The deal already cash-flows at list — no discount required.
- Meets the 1% rule at list price ($2k rent vs $85k).
- Cap rate 36.0% vs local median 4.8% in Hemet — top-decile yield for the area; either an underpriced asset or a hidden risk that comps aren't pricing in. Stress-test before assuming the spread holds.
Location & tenants
- Location reads 51/100 on livability (#1,056 in CA) — a working-class tenant base; expect higher turnover. Strengths: housing A+; Watch: crime D+, amenities F, commute F.
- Hemet Unified (suburban): math 19% / reading 41% proficiency, ranked #360 of 517 in CA (top 70%) — families likely to look elsewhere, expect single-tenant / working-renter base with shorter leases; 66% free/reduced lunch — lower-income household profile, screen leases tightly.
- Zoned schools: Cawston Elementary (math 24% / reading 24%, grade F, #973 of 1,571 statewide, top 73%, 835 students, 81% FRL); Rancho Viejo Middle (math 24% / reading 24%, grade F, #277 of 498 statewide, top 73%, 975 students, 88% FRL); Tahquitz High (math 14% / reading 42%, grade F, #777 of 1,170 statewide, top 67%, 1,727 students, 88% FRL) — zoned schools average 86% FRL vs 66% district-wide (20 pts higher); higher-poverty schools than district average — tighter screening recommended.
- Market conditions: Rents rising (+3.7%/yr); 292 active listings in the ZIP; 16 comparable units currently listed for rent nearby; rentals leasing fast (median 14d on market — plan ~1-2 weeks tenant-placement turnaround); 9,195 units permitted in Riverside County in 2024 (1,512 in 5+ unit buildings).
- This rent runs 38% of the median local income ($64k/yr) — at the standard rent-burdened threshold; future hikes will face affordability resistance.
Forward outlook
- Local home prices are declining (-3.0%/yr); year-one equity from $347 of loan paydown is wiped out by about $2k of value loss. Plan a longer hold.
- Riverside County population projected at +22% by 2050 — long-run rental-demand tailwind backs the buy-and-hold thesis.
- At projected returns (-3.0% appreciation + 3.7% rent growth), your $14k cash investment doubles in ~2 years — after that, you're playing with house money.
Negotiation context
- Only 4 days on market — expect competitive offers; lowballing is unlikely to land.
Risks & watch-outs
- Climate carrying-cost: major wildfire risk; extreme-heat days projected 7→19/yr by 2055 (HVAC capex compounding) — expect insurance premiums to compound above CPI over the hold.
Questions for the listing agent
- Is there a deadline driving the sale (1031 exchange, divorce, estate, relocation)? That informs how much negotiation room exists.
- Schools are F-rated, which usually means shorter tenancies and higher turnover. Who's the typical renter profile here, and what's been the actual vacancy rate?
- Crime grade is D in this area — have there been break-ins, vandalism, or insurance claims at this property in the last 3 years? What carrier currently insures it and at what premium?
- What's the average days-on-market for RENTAL listings here right now (not sales)? A rising rental-DOM trend means longer vacancies and softer asking-rent achievability than the comps imply.
- What's the recent tenant-quality profile in this submarket — average credit score on applications, eviction rate, late-payment / NSF rate, and stable-employment percentage? A property-management company in the area should have these aggregated.
- How much new for-sale + rental construction is in the pipeline within 1–3 miles? Heavy new supply typically softens prices + rents 12–24 months out; constrained supply supports both.
Investment metrics
- 1% rule
- 4.01% ✓
- Cap rate
- 36.04%
- Cash-on-cash
- 106.25%
- DSCR
- 5.73
- GRM
- 2.1
CMA / ARV
- ARV (on-the-fly)
- $50,184
- Comps found
- 12
Show comp detail 12 sales within ~0.75 mi
| Address | Dist | Beds/Ba | Sqft | Sold | Price | $/sf | Match |
|---|---|---|---|---|---|---|---|
| 4400 W FLORIDA Ave #254 | 0.00mi | 2/2.0 (-1) | 1,152 (-6%) | 9mo | $88,000 | $76 | 78 |
| 4400 W Florida #215 | 0.00mi | 2/2.0 (-1) | 1,076 (-12%) | 2mo | $70,000 | $65 | 73 |
| 5001 W Florida Ave #175 | 0.54mi | 3/2.0 | 1,248 (+2%) | 6mo | $90,000 | $72 | 67 |
| 5001 W Florida #695 | 0.48mi | 2/2.0 (-1) | 1,248 (+2%) | 5mo | $45,000 | $36 | 65 |
| 5001 W Florida Ave #122 | 0.48mi | 2/2.0 (-1) | 1,296 (+6%) | 0mo | $52,500 | $41 | 62 |
| 5001 W Florida Ave #665 | 0.54mi | 2/2.0 (-1) | 1,248 (+2%) | 7mo | $40,000 | $32 | 61 |
| 5001 W Florida Ave #545 | 0.54mi | 2/2.0 (-1) | 1,248 (+2%) | 9mo | $45,000 | $36 | 59 |
| 5001 W Florida Ave #230 | 0.54mi | 2/2.0 (-1) | 1,152 (-6%) | 6mo | $45,000 | $39 | 55 |
| 5001 W Florida #476 | 0.54mi | 2/2.0 (-1) | 1,120 (-8%) | 2mo | $45,000 | $40 | 54 |
| 5001 W Florida #618 | 0.54mi | 2/2.0 (-1) | 1,344 (+10%) | 4mo | $70,000 | $52 | 50 |
| 5001 W Florida Ave W #728 | 0.54mi | 2/2.0 (-1) | 1,344 (+10%) | 4mo | $56,000 | $42 | 50 |
| 5001 W Florida Ave #250 | 0.54mi | 2/2.0 (-1) | 1,368 (+12%) | 7mo | $33,000 | $24 | 44 |
Match score weights: distance 35% · size 25% · config 20% · recency 20%. Top-matched comps best support the ARV.
Projected returns pro-forma
-3.0% appreciation · 3.74% rent growth · sell at horizon
- IRR
- —
- Equity multiple
- 6.17×
- Total profit
- $72,649
- Equity at exit
- $7,483
- IRR
- —
- Equity multiple
- 13.22×
- Total profit
- $171,712
- Equity at exit
- $4,339
Cash invested: $14,052 (down + closing). Projections, not guarantees.
Landlord ↔ Tenant lean methodology
- Overall (STATE)
- 18 Strongly Tenant-Friendly
- State California
- 18 Strongly Tenant-Friendly · D+13
- County
- — inherits STATE
- City
- — inherits STATE
ZIP-level market 92545
- Home prices YoY
- -24.6%
- Rents YoY
- 3.7%
- Active inventory
- 292
- Price-to-rent
- 3.5×
Monthly cashflow live
- Estimated rent
- $2,014 high interval (Pro) →
- Mortgage (P&I)
- −$263
- Tax est. 1.5%
- −$63 /mo · $753/yr
- Insurance
- −$21
- HOA
- −$0
- Vacancy / Maint / Mgmt
- −$423
- Net cashflow
- $1,244
Break-even live
Sensitivity live
| Price | -10% $1,279 | -5% $1,261 | +0% $1,244 | +5% $1,227 | +10% $1,209 |
|---|---|---|---|---|---|
| Rent | -10% $1,085 | -5% $1,165 | +0% $1,244 | +5% $1,324 | +10% $1,403 |
| Rate | -1.0pp $1,269 | -0.5pp $1,257 | base $1,244 | +0.5pp $1,231 | +1.0pp $1,218 |
UW: 25.0% down · 7.5% · 30yr · 1.5% tax · 5.0% vac · 8.0% maint · 8.0% mgmt
Financing live
Cash to close
- Down payment
- $12,546
- Closing costs
- $1,506
- Reserves months
- —
- Total cash needed
- —
Loan-product check · same deal, 3 products live
Conventional
25% down · 7.5% · 30yr
- Down + closing
- —
- Monthly P&I
- —
- Monthly cashflow
- —
- DSCR
- —
- Eligible?
- —
Personal DTI + credit; lowest rate.
DSCR
20% down · 8.5% · 30yr
- Down + closing
- —
- Monthly P&I
- —
- Monthly cashflow
- —
- DSCR
- —
- Eligible?
- —
No personal income docs; deal must DSCR.
Hard money
10% down · 12.0% · 12mo
- Down + closing
- —
- Monthly P&I
- —
- Monthly cashflow
- —
- DSCR
- —
- Eligible?
- —
Short-term bridge; refi at stabilization.
Rent comps 16 comps
| Address | Beds | Baths | Sqft | Rent | $/sqft | DOM | Units | Dist |
|---|---|---|---|---|---|---|---|---|
| 4400 W Florida Ave Spc 26 Hemet, CA | 3.0 | 2.0 | 1193 | $1,699 | $1.42 | 16d | 1 | 0.03mi |
| 4400 W Florida Ave Unit 86 Hemet, CA | 3.0 | 2.0 | 1310 | $1,800 | $1.37 | 45d | 1 | 0.04mi |
| 3800 W Devonshire Ave Hemet, CA | 3.0 | 1.0–2.0 | 816 | $2,335 | $2.86 | 0d | 7 | 0.57mi |
| 3471 Dublin Ct Hemet, CA | 3.0 | 2.0 | 1276 | $2,895 | $2.27 | 5d | 1 | 0.89mi |
| 3030 W Acacia Ave Hemet, CA | 1.0–2.0 | 1.0–2.0 | 807 | $1,780 | $2.20 | 0d | 8 | 0.92mi |
| 2770 W Devonshire Ave Hemet, CA | 1.0–2.0 | 1.0–2.0 | 707 | $1,945 | $2.75 | 0d | 10 | 1.16mi |
| 743 Via Linda Dr Hemet, CA | 2.0 | 2.0 | 1206 | $1,995 | $1.65 | 7d | 1 | 1.26mi |
| 2469 W Acacia Ave Hemet, CA | 2.0 | 2.0 | 910 | $1,750 | $1.92 | 26d | 1 | 1.28mi |
| 2403 W Acacia Ave Hemet, CA | 2.0 | 2.0 | 910 | $1,995 | $2.19 | 9d | 1 | 1.30mi |
| 683 Jonquil St Hemet, CA | 3.0 | 2.0 | 1150 | $2,448 | $2.13 | 26d | 1 | 1.38mi |
| 811 Alondra Dr Hemet, CA | 2.0 | 2.0 | 1166 | $1,875 | $1.61 | 6d | 1 | 1.43mi |
| 2269 San Bernardo Ave Hemet, CA | 2.0 | 1.0 | 827 | $1,650 | $2.00 | 45d | 1 | 1.46mi |
| 2098 W Acacia Ave Hemet, CA | 1.0–3.0 | 1.0–2.0 | 895 | $2,475 | $2.77 | 0d | 1 | 1.49mi |
| 853 Ensenada Dr Hemet, CA | 2.0 | 2.0 | 1350 | $1,875 | $1.39 | 26d | 1 | 1.49mi |
| 853 Ensenada Dr Hemet, CA | 2.0 | 2.0 | 1350 | $1,875 | $1.39 | 13d | 1 | 1.49mi |
| 2422 San Padre Ct Hemet, CA | 2.0 | 1.0 | 827 | $1,800 | $2.18 | 26d | 1 | 1.50mi |
Listing history 3 events
-
2026-06-21days on market $84,508 Active 4 DOM
-
2026-06-18remarks 699-char remark
-
2026-06-18$84,508 Active 1 DOM
ⓘ Source: listings_history table (triggers on properties + properties_extension) + one-shot
backfill from property_details.listing_events for pre-trigger history.
Climate risk First Street
- Flood 1/10 Low FEMA zone X (unshaded) · 0% chance over 30 yrs
- Wildfire 7/10 Severe
- Heat 7/10 Severe 7 d/yr ≥105°F today · 19 d/yr by 30 yrs out
- Wind 1/10 Low
- Air quality 6/10 Major 9 unhealthy d/yr today · 11 by 30 yrs out
Nearby sold comps map
Loading sold comps map…
Walkable amenities ~0.75 mi
Loading nearby amenities…
Taxation est. · year 1
- Rental income
- $24,166
- − Mortgage interest
- −$2,811
- − Property taxes
- −$753
- − Insurance
- −$251
- − Repairs & maintenance
- −$1,933
- − Management
- −$1,933
- − Depreciation
- −$1,460
- Taxable income
- $15,025
- Est. tax owed @ 24.0%
- −$3,606
- After-tax cash flow
- $11,324/yr
For passive investors: Depreciation is non-cash, so a rental often shows a tax loss while cash-flowing — sheltering income. Rental losses are passive: they offset passive income freely, and up to $25,000/yr can offset ordinary (W-2) income if you actively participate and your MAGI is under $100k (phasing out to $0 by $150k); unused losses carry forward. On sale, claimed depreciation is recaptured at up to 25%, and gains may owe capital-gains tax (a 1031 exchange can defer both). Figures are a year-1 estimate at your 24.0% rate — not tax advice; consult a CPA.
Condition & rehab AI · 1 photo
This Laguna D 3/2 plan manufactured home is in good condition with no major repairs needed. It offers a good investment opportunity with potential for minor cosmetic improvements to boost its resale and rental value.
Value-add opportunities
- Both Painting interior walls — Fresh paint enhances curb appeal and interior aesthetics.
- Both Landscaping improvements — Enhances curb appeal and adds value to the property.
Renovation cost estimate screening
Value-add ROI direction
- Both Painting interior walls — Fresh paint enhances curb appeal and interior aesthetics. ↑
- Both Landscaping improvements — Enhances curb appeal and adds value to the property. ↑
ⓘ Cost ranges are severity-bucket heuristics (US national rule-of-thumb). Get contractor quotes + a written scope before underwriting a rehab budget.
Schools (NCES district)
- District
- Hemet Unified
- NCES district ID
- 0616920
- Math proficiency
- 19% ▼ -3.00%
- Reading proficiency
- 41% ▲ 4.00%
- Median HH income
- $39,962
- Composite
- 25.16/100
- National rank
- #7517
- State rank
- #360 of 517 in CA
Livability — Hemet
- Score
- 51/100
- State rank
- #1056
- US rank
- #25208
Category grades
Schools grade is shown separately in the Schools card above.
Census & demographics
- Census place
- Hemet, CA
- County
- Riverside County · 2,287,001 people
- City population
- 137,670
- Metro
- Riverside-San Bernardino-Ontario, CA
- Population (ZIP)
- 45,982
- Household income
- $63,770
- Rent vs Own
- Severe rent burden
- 1813.0
Population outlook (Riverside County) Hauer SSP2
- Today (2025)
- 2,664,475 people
- By 2030
- 2,802,692 · +5.2%
- By 2040
- 3,050,904 · +14.5%
- By 2050
- 3,256,783 · +22.2%
- By 2075
- 3,655,058 · +37.2%
- By 2100
- 3,766,594 · +41.4%
Race, ethnicity, and origin ACS 2023
- Neighborhood character
- Diverse neighborhood (Simpson 0.65)
- Race & ethnicity
- Hispanic / Latino 46% White 35% Two or more races 17% Black 8% Asian 5% Native American 1%
- Hispanic origin (detail)
- Mexican 40%
- Common ancestry
- Slovak 2% Lithuanian 2% Portuguese 1%
- Foreign-born
- 19% · Canada, Vietnam, Jamaica
- Languages at home
- 69% English-only · Spanish 27% Tagalog/Filipino 1% Other Indo-European 1%
Political lean MEDSL · Riverside
- 2024 margin
- Toss-up / Even · D 48.0% · R 49.3% · Other 2.6%
- 2008→2024 swing
- -3.6pp toward R · 2008: 2.3pp · 2024: -1.3pp
- All cycles
- 2024: R+1.3 2020: D+8.0 2016: D+4.3 2012: R+0.4 2008: D+2.3
Not yet ingested
- Civics
- —
Market trends
- HPI YoY
- ▼ -116.25%
- Current HPI
- 356.9414
- Rent YoY
- ▲ 3.74%
- Metro
- Riverside-San Bernardino-Ontario, CA
- State GDP YoY
- ▲ 3.21%
- F500 in state
- 116
Industry mix (Fortune 500 HQ in CA)
| Industry | F500 HQs | Revenue |
|---|---|---|
| Technology | 27 | $1,492B |
|
||
| Financial Services | 3 | $174B |
|
||
| Retail | 3 | $44B |
|
||
| Insurance | 3 | $26B |
|
||
| Media / Entertainment | 2 | $115B |
|
||
| Pharmaceuticals / Biotech | 2 | $62B |
|
||
Cash-flow waterfall
monthlySold comps — $/sqft
last 12 mo · ≤1 miLoading sold comps…