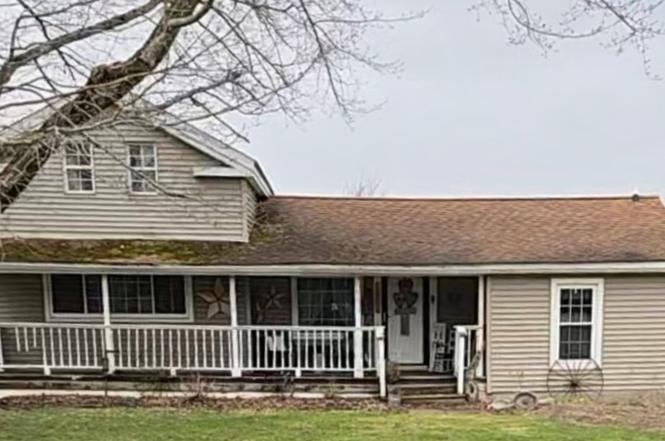
1501 Stumpville Rd · Jefferson, OH
Flood risk 1/10 · Minimal
- FEMA flood zone
- X (unshaded)
- Chance of flooding over 30 yrs
- 0.0%
- Est. flood insurance / yr
- $473 – $860
Fire risk 1/10 · Minimal
- Est. fire insurance / yr
- $713 – $1,323
Heat risk 2/10 · Minimal
- Hot days now (above 95°F)
- 7 days/yr
- Hot days in 30 yrs
- 17 days/yr
Wind risk 1/10 · Minimal
- Chance of severe wind over 30 yrs
- —
Air-quality risk 3/10 · Minor
- Unhealthy air days now
- 2 days/yr
- Unhealthy air days in 30 yrs
- 5 days/yr
Risk factors via First Street. Map © Google.
Why this score? — see what drove the C+ grade
The composite is a weighted blend of 9 inputs, each scored 0–100. Each bar is that input's sub-score; the figure is the points it added to the 100-point composite (weight × sub-score).
- Cash flow +27.2/30.0
- DSCR +9.4/10.0
- ARV discount +7.5/15.0
- 1% rule +7.4/10.0
- Schools +4.6/10.0
- Livability +3.5/5.0
- Rent growth +2.5/5.0
- Condition / age +2.5/5.0
- Appreciation +0.0/10.0
$100,000
🖨 Deal sheet 📄 Offer letter ✓ Due diligence
Listing remarks MLS
If you are looking for a home with character in the country with plenty of space for your toys, cars, equipment or whatever you desire, this is the home you have been waiting for! Check out the size of this garage! This may fit 9 or more vehicles at 64’x 32’. The home itself has had many updates recently as well as insulation in the garage attic. This 2 to 3 bedroom home with 2 full baths may have been built in 1880 but the list of updates go on. The plumbing system has been recently updated with a new well pump, pressure tank, booster pump, alarm system for the well and a new sump pump. New trim, three interior doors and a new front door along with led lighting throughout. Even the septic was replaced within the past 10 years. The hardwood floors have been given a new shine and all new appliances installed. The pellet stove is sure to keep heating bills down in the winter. Seller is offering a one year home warranty plan to the future owner of this great home. Don’t miss this opport
Key facts
- 2.5 acre lot
- 9 garage spots
- Built 1880
Property features AI
Exterior
- Parking: Detached garage with electricity; Garage drains; Paved parking; 9 garage spaces
- Utilities: Well water; Septic tank
- Home design: Single-family property; Above-grade finished living area approximately 1,536
- Construction: Vinyl siding; Asphalt/fiberglass roof
- Exterior features: Deck; Porch; Outbuilding; Storage structure; Wooded lot (2.5 acres)
Interior
- Bedrooms: One main-level bedroom
- Bathrooms: Two full bathrooms (both on the main level)
- Heating & cooling: Baseboard heating; Electric heating; Pellet stove; Wood stove; Zoned heating
- Interior features: Partial basement; One fireplace
Neighborhood map
What this means for you Summary
Snapshot
- This is a 3-bed/2.0-bath single-family listed at $100k.
Deal economics
- At list price, monthly cash flow is $285 ($3k/yr) — positive.
- The deal already cash-flows at list — no discount required.
- Meets the 1% rule at list price ($1k rent vs $100k).
Location & tenants
- Location reads 69/100 on livability (#506 in OH) — a middle-class / working-renter tenant base. Strengths: cost of living A+, housing A+, crime A; Watch: health & safety D, amenities F, commute F.
- Jefferson Area Local (rural): math 46% / reading 62% proficiency, ranked #382 of 656 in OH (top 58%) — acceptable for families but not a draw, mixed tenant base, ~2y average lease.
- Market conditions: 23 active listings in the ZIP; 155 units permitted in Ashtabula County in 2024 (0 in 5+ unit buildings).
Forward outlook
- Local home prices are declining (-3.0%/yr); year-one equity from $691 of loan paydown is wiped out by about $3k of value loss. Plan a longer hold.
- Ashtabula County population projected at -22% by 2050 — secular population decline; favor cash flow + early exit over multi-decade hold.
- At projected returns (-3.0% appreciation + 3.0% rent growth), your $28k cash investment doubles in ~10 years — after that, you're playing with house money.
Negotiation context
- Only 5 days on market — expect competitive offers; lowballing is unlikely to land.
- 7 sale attempts since 22y ago with the ask held roughly flat each time — persistent listings suggest the price (not the market) is what's stuck; bring a comps-based counter.
Risks & watch-outs
- Watch-outs: built in 1880 — expect roof / HVAC / electrical / plumbing capex.
Questions for the listing agent
- Built in 1880 — when were the roof, HVAC, electrical panel, plumbing, and water heater last replaced?
- Is there a deadline driving the sale (1031 exchange, divorce, estate, relocation)? That informs how much negotiation room exists.
- Schools are B-rated — typically a magnet for longer-tenancy family renters. What's the average tenant stay here, and is there a school-zone premium baked into asking?
- What's the average days-on-market for RENTAL listings here right now (not sales)? A rising rental-DOM trend means longer vacancies and softer asking-rent achievability than the comps imply.
- What's the recent tenant-quality profile in this submarket — average credit score on applications, eviction rate, late-payment / NSF rate, and stable-employment percentage? A property-management company in the area should have these aggregated.
- How much new for-sale + rental construction is in the pipeline within 1–3 miles? Heavy new supply typically softens prices + rents 12–24 months out; constrained supply supports both.
Investment metrics
- 1% rule
- 1.24% ✓
- Cap rate
- 9.72%
- Cash-on-cash
- 12.23%
- DSCR
- 1.54
- GRM
- 6.7
CMA / ARV
No comps found within radius.
Projected returns pro-forma
-3.0% appreciation · 3.0% rent growth · sell at horizon
- IRR
- 1.9%
- Equity multiple
- 1.07×
- Total profit
- $1,992
- Equity at exit
- $14,910
- IRR
- 11.5%
- Equity multiple
- 1.90×
- Total profit
- $25,218
- Equity at exit
- $8,646
Cash invested: $28,000 (down + closing). Projections, not guarantees.
Landlord ↔ Tenant lean methodology
- Overall (STATE)
- 73 Landlord-Friendly
- State Ohio
- 73 Landlord-Friendly · R+6
- County
- — inherits STATE
- City
- — inherits STATE
ZIP-level market 44047
- Home prices YoY
- -23.3%
- Active inventory
- 23
- Price-to-rent
- 6.7×
Monthly cashflow live
- Estimated rent
- $1,236 medium interval (Pro) →
- Mortgage (P&I)
- −$524
- Tax est. 1.5%
- −$125 /mo · $1,500/yr
- Insurance
- −$42
- HOA
- −$0
- Vacancy / Maint / Mgmt
- −$260
- Net cashflow
- $285
Break-even live
UW: 25.0% down · 7.5% · 30yr · 1.5% tax · 5.0% vac · 8.0% maint · 8.0% mgmt
Financing live
Cash to close
- Down payment
- $25,000
- Closing costs
- $3,000
- Reserves months
- —
- Total cash needed
- —
Loan-product check · same deal, 3 products live
Conventional
25% down · 7.5% · 30yr
- Down + closing
- —
- Monthly P&I
- —
- Monthly cashflow
- —
- DSCR
- —
- Eligible?
- —
Personal DTI + credit; lowest rate.
DSCR
20% down · 8.5% · 30yr
- Down + closing
- —
- Monthly P&I
- —
- Monthly cashflow
- —
- DSCR
- —
- Eligible?
- —
No personal income docs; deal must DSCR.
Hard money
10% down · 12.0% · 12mo
- Down + closing
- —
- Monthly P&I
- —
- Monthly cashflow
- —
- DSCR
- —
- Eligible?
- —
Short-term bridge; refi at stabilization.
Listing history 6 events
-
2026-06-17status $100,000 Pending 5 DOM
-
2026-06-16days on market $100,000 Contingent 5 DOM
-
2026-06-15days on market $100,000 Contingent 4 DOM
-
2026-06-13days on market $100,000 Contingent 2 DOM
-
2026-06-12remarks 107-char remark
-
2026-06-12$100,000 Contingent 1 DOM
ⓘ Source: listings_history table (triggers on properties + properties_extension) + one-shot
backfill from property_details.listing_events for pre-trigger history.
Climate risk First Street
- Flood 1/10 Low FEMA zone X (unshaded) · 0% chance over 30 yrs
- Wildfire 1/10 Low
- Heat 2/10 Low 7 d/yr ≥95°F today · 17 d/yr by 30 yrs out
- Wind 1/10 Low
- Air quality 3/10 Moderate 2 unhealthy d/yr today · 5 by 30 yrs out
Nearby sold comps map
Loading sold comps map…
Walkable amenities ~0.75 mi
Loading nearby amenities…
Taxation est. · year 1
- Rental income
- $14,833
- − Mortgage interest
- −$5,602
- − Property taxes
- −$1,500
- − Insurance
- −$500
- − Repairs & maintenance
- −$1,187
- − Management
- −$1,187
- − Depreciation
- −$2,909
- Taxable income
- $1,949
- Est. tax owed @ 24.0%
- −$468
- After-tax cash flow
- $2,957/yr
For passive investors: Depreciation is non-cash, so a rental often shows a tax loss while cash-flowing — sheltering income. Rental losses are passive: they offset passive income freely, and up to $25,000/yr can offset ordinary (W-2) income if you actively participate and your MAGI is under $100k (phasing out to $0 by $150k); unused losses carry forward. On sale, claimed depreciation is recaptured at up to 25%, and gains may owe capital-gains tax (a 1031 exchange can defer both). Figures are a year-1 estimate at your 24.0% rate — not tax advice; consult a CPA.
Schools (NCES district)
- District
- Jefferson Area Local
- NCES district ID
- 3904587
- Math proficiency
- 46% ▼ -14.00%
- Reading proficiency
- 62% ▼ -10.00%
- Median HH income
- $50,966
- Composite
- 46.13/100
- National rank
- #2506
- State rank
- #382 of 656 in OH
Livability — Jefferson
- Score
- 69/100
- State rank
- #506
- US rank
- #8526
Category grades
Schools grade is shown separately in the Schools card above.
Census & demographics
- County
- Ashtabula · 97,617 people
- Metro
- Cleveland, OH
- Population (ZIP)
- 8,379
- Household income
- $59,720
- Rent vs Own
- Severe rent burden
- 10.7
Population outlook (Ashtabula County) Hauer SSP2
- Today (2025)
- 92,950 people
- By 2030
- 89,146 · -4.1%
- By 2040
- 80,715 · -13.2%
- By 2050
- 72,270 · -22.2%
- By 2075
- 55,780 · -40.0%
- By 2100
- 40,928 · -56.0%
Race, ethnicity, and origin ACS 2023
- Neighborhood character
- Predominantly White (92%)
- Race & ethnicity
- White 92% Two or more races 5% Hispanic / Latino 4%
- Common ancestry
- Romanian 3% Slovak 3% Scotch-Irish 1%
- Foreign-born
- 2% · Canada
Political lean MEDSL · Ashtabula
- 2024 margin
- Strong R (+28.4) · D 35.4% · R 63.8%
- 2008→2024 swing
- -41.9pp toward R · 2008: 13.5pp · 2024: -28.4pp
- All cycles
- 2024: R+28.4 2020: R+23.5 2016: R+19.0 2012: D+12.1 2008: D+13.5
Not yet ingested
- Civics
- —
Market trends
- HPI YoY
- ▼ -73.79%
- Current HPI
- 243.2537
- Rent YoY
- —
- Metro
- —
- State GDP YoY
- ▲ 1.98%
- F500 in state
- 48
Industry mix (Fortune 500 HQ in OH)
| Industry | F500 HQs | Revenue |
|---|---|---|
| Insurance | 3 | $145B |
|
||
| Industrial Machinery | 3 | $49B |
|
||
| Financial Services | 3 | $24B |
|
||
| Consumer Goods | 2 | $93B |
|
||
| Aerospace / Defense | 2 | $47B |
|
||
| Utilities | 2 | $33B |
|
||
Price history
-23.0% since first listed24 events — show timeline
- 2026-06-12 Contingent — MLSNOW
- 2026-06-09 Listed $100,000 MLSNOW
- 2019-02-05 Pending — MLSNOW
- 2019-02-05 Sold (MLS) $139,234 MLSNOW
- 2018-12-21 Contingent — MLSNOW
- 2018-11-14 Price Changed $138,234 MLSNOW
- 2018-10-02 Price Changed $138,334 MLSNOW
- 2018-08-28 Price Changed $139,834 MLSNOW
- 2018-08-08 Price Changed $142,234 MLSNOW
- 2018-07-25 Listed $145,234 MLSNOW
- 2018-07-23 Listing Removed — MLSNOW
- 2018-06-28 Price Changed $147,500 MLSNOW
- 2018-05-22 Listed $149,900 MLSNOW
- 2017-10-06 Sold (MLS) $123,500 MLSNOW
- 2017-08-09 Pending — MLSNOW
- 2017-08-05 Listing Removed — MLSNOW
- 2017-07-11 Price Changed $139,900 MLSNOW
- 2017-06-05 Listed $149,900 MLSNOW
- 2008-06-30 Sold (MLS) $22,500 MLSNOW
- 2008-05-05 Listed $29,900 MLSNOW
- 2006-01-01 Listing Removed — MLSNOW
- 2005-08-24 Listed $120,000 MLSNOW
- 2004-12-01 Listing Removed — MLSNOW
- 2004-07-16 Listed $129,900 MLSNOW
Cash-flow waterfall
monthlySold comps — $/sqft
last 12 mo · ≤1 miLoading sold comps…