 🏷️ Likely Rental
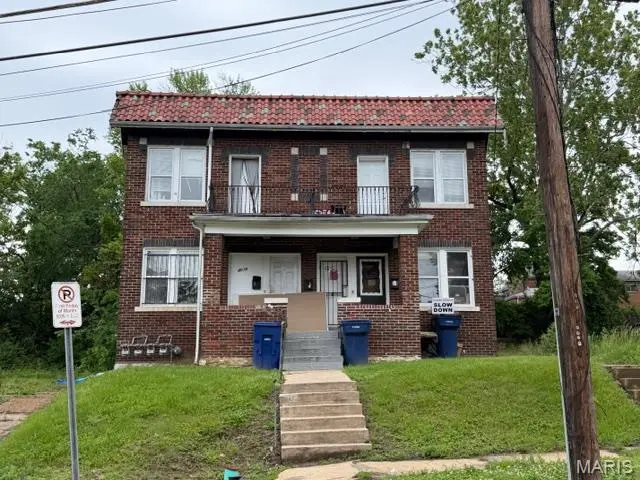
4016 Cora Ave · St. Louis, MO
Flood risk 1/10 · Minimal
- FEMA flood zone
- X (unshaded)
- Chance of flooding over 30 yrs
- 0.0%
- Est. flood insurance / yr
- $473 – $860
Fire risk 1/10 · Minimal
- Est. fire insurance / yr
- $1,054 – $1,958
Heat risk 5/10 · Moderate
- Hot days now (above 107°F)
- 7 days/yr
- Hot days in 30 yrs
- 21 days/yr
Wind risk 2/10 · Minimal
- Chance of severe wind over 30 yrs
- 1.0%
Air-quality risk 4/10 · Minor
- Unhealthy air days now
- 5 days/yr
- Unhealthy air days in 30 yrs
- 6 days/yr
Risk factors via First Street. Map © Google.
Why this score? — see what drove the C- grade
The composite is a weighted blend of 9 inputs, each scored 0–100. Each bar is that input's sub-score; the figure is the points it added to the 100-point composite (weight × sub-score).
- Cash flow +15.0/30.0
- ARV discount +15.0/15.0
- 1% rule +5.0/10.0
- DSCR +5.0/10.0
- Appreciation +3.3/10.0
- Rent growth +2.5/5.0
- Livability +2.5/5.0
- Condition / age +2.5/5.0
- Schools +1.2/10.0
$60,000
🖨 Deal sheet (PDF) 📄 Offer letter ✓ Due diligence
Multi-family units
County records classify this as Multi-Family (2-4 Unit). Listing-text estimate: 1 unit. estimate disagrees with records
Listing remarks MLS
Incredible cash flow from day one on this 3-unit building! There are two units with HUD vouchers in place & one market tenant. Total monthly gross rent is a whopping $2530! It was originally a 4 unit, but now has one townhome unit and two 1 bed units. The seller is moving on to another opportunity and now this one could be yours! No showings without an accepted contract in place.
Key facts
- 5,850 sq ft lot
- Built 1928
- Listed 32 days
Property features AI
Finance
- Other: Living area reported as 3,350 (assessor)
- Financial info: Annual taxes listed (2025): $306
Exterior
- Home design: Residential income property (2–4 units)
- Construction: Brick construction
- Exterior features: Lot roughly 0.13 acre; Neighborhood: Penrose
Interior
- Bedrooms: No bedrooms listed
- Bathrooms: No bathrooms listed
- Heating & cooling: Cooling: Other
- Interior features: Full basement; Cooling system: Other
Neighborhood map
What this means for you Summary
Snapshot
- This is a ?-bed/3.0-bath multifamily listed at $60k.
Deal economics
- At list price, monthly cash flow is $2k ($24k/yr) — positive.
- The deal already cash-flows at list — no discount required.
- Meets the 1% rule at list price ($3k rent vs $60k).
- Recommended offer: $58k (3.0% below list) — sets the bar for market timing.
- Cap rate 46.9% vs local median 5.0% in St. Louis — top-decile yield for the area; either an underpriced asset or a hidden risk that comps aren't pricing in. Stress-test before assuming the spread holds.
Location & tenants
- Location reads: area grade C — affects rentability + tenant quality, not the cash-flow math above.
- St. Louis City (urban): math 10% / reading 18% proficiency, ranked #312 of 324 in MO (top 96%) — low school quality limits family demand, transient renter base, plan for 1-2y turnover; 80% free/reduced lunch — lower-income household profile, screen leases tightly.
- Zoned schools: Ashland Elem. And Br. (math 2% / reading 2%, grade F, #1,099 of 1,115 statewide, top 100%, 226 students, 99% FRL); Sumner High (math 2% / reading 2%, grade F, #520 of 521 statewide, top 100%, 264 students, 99% FRL) — zoned schools average 99% FRL vs 80% district-wide (18 pts higher); higher-poverty schools than district average — tighter screening recommended.
- Market conditions: 99 active listings in the ZIP; 3 comparable units currently listed for rent nearby; rentals lingering (median 45d on market — plan ~5-8 weeks vacancy on turnover, expect pricing pressure); 100% of comp listings sitting > 30 days — soft ceiling on asking rent; lower-income renter base — watch delinquency; 294 units permitted in St. Louis city in 2024 (227 in 5+ unit buildings).
- At $3,029/mo this rent would consume 119% of the median local household income ($31k/yr) (locally 1655% of renters already pay >50% of income on rent) — very limited rent-growth headroom before tenants either downsize or default.
Forward outlook
- Local home prices are declining (-3.0%/yr); year-one equity from $415 of loan paydown is wiped out by about $2k of value loss. Plan a longer hold.
- St. Louis County population projected to shrink 6% by 2050 — rents likely to lag national; underwrite the cash flow, not the appreciation.
- At projected returns (-3.0% appreciation + 3.0% rent growth), your $17k cash investment doubles in ~1 year — after that, you're playing with house money.
Negotiation context
- It's been on market 33 days — a 3% lower offer ($58k) is reasonable based on typical stale-listing flexibility.
- 6 sale attempts since 11y ago with the ask held roughly flat each time — persistent listings suggest the price (not the market) is what's stuck; bring a comps-based counter.
Risks & watch-outs
- Watch-outs: built in 1928 — expect roof / HVAC / electrical / plumbing capex.
- Climate carrying-cost: extreme-heat days projected 7→21/yr by 2055 (HVAC capex compounding) — expect insurance premiums to compound above CPI over the hold.
Questions for the listing agent
- It's been on market 33 days. Have you received any prior offers? Is the seller open to a 3% concession, seller financing, or rate buy-down credit?
- Built in 1928 — when were the roof, HVAC, electrical panel, plumbing, and water heater last replaced?
- Is there a deadline driving the sale (1031 exchange, divorce, estate, relocation)? That informs how much negotiation room exists.
- What's the average days-on-market for RENTAL listings here right now (not sales)? A rising rental-DOM trend means longer vacancies and softer asking-rent achievability than the comps imply.
- What's the recent tenant-quality profile in this submarket — average credit score on applications, eviction rate, late-payment / NSF rate, and stable-employment percentage? A property-management company in the area should have these aggregated.
- How much new apartment / multifamily construction is in the pipeline within 1–3 miles? Heavy new supply (>2% of stock underway) typically softens rents 12–24 months out; light construction supports rent growth.
Investment metrics
- 1% rule
- 5.05% ✓
- Cap rate
- 46.85%
- Cash-on-cash
- 144.86%
- DSCR
- 7.45
- GRM
- 1.7
CMA / ARV
- ARV (on-the-fly)
- $77,050
- Comps found
- 9
Show comp detail 9 sales within ~0.75 mi
| Address | Dist | Beds/Ba | Sqft | Sold | Price | $/sf | Match |
|---|---|---|---|---|---|---|---|
| 4248 N Euclid Ave | 0.53mi | 4/4.0 | 3,468 (+4%) | 0mo | $99,500 | $29 | 65 |
| 4674 Kossuth Ave | 0.14mi | 6/6.0 | 3,294 (-2%) | 17mo | $65,900 | $20 | 64 |
| 4681 Kossuth Ave | 0.16mi | 16/16.0 | 3,254 (-3%) | 6mo | $199,900 | $61 | 63 |
| 4278 Lee Ave #4 | 0.57mi | 4/4.0 | 3,332 (-0%) | 15mo | $65,000 | $20 | 56 |
| 4538 Lexington Ave | 0.32mi | 32/16.0 | 3,264 (-3%) | 10mo | $39,000 | $12 | 52 |
| 4349 Shreve Ave | 0.49mi | 1/3.0 | 3,070 (-8%) | 17mo | $48,000 | $16 | 49 |
| 4460 Bircher Blvd | 0.67mi | 4/4.0 | 3,638 (+9%) | 15mo | $150,000 | $41 | 38 |
| 4448 Ashland Ave | 0.46mi | 1/1.0 | 2,892 (-14%) | 15mo | $75,000 | $26 | 36 |
| 4818 Greer Ave #20 | 0.62mi | 5/2.0 | 3,016 (-10%) | 20mo | $69,000 | $23 | 34 |
Match score weights: distance 35% · size 25% · config 20% · recency 20%. Top-matched comps best support the ARV.
Projected returns pro-forma
-3.0% appreciation · 3.0% rent growth · sell at horizon
- IRR
- —
- Equity multiple
- 8.11×
- Total profit
- $119,456
- Equity at exit
- $8,946
- IRR
- —
- Equity multiple
- 17.10×
- Total profit
- $270,400
- Equity at exit
- $5,188
Cash invested: $16,800 (down + closing). Projections, not guarantees.
Landlord ↔ Tenant lean methodology
- Overall (STATE)
- 81 Strongly Landlord-Friendly
- State Missouri
- 81 Strongly Landlord-Friendly · R+10
- County
- — inherits STATE
- City
- — inherits STATE
ZIP-level market 63115
- Home prices YoY
- -2.6%
- Active inventory
- 99
- Price-to-rent
- 4.7×
Monthly cashflow live
- Estimated rent
- $3,029 high interval (Pro) →
- Mortgage (P&I)
- −$315
- Tax from tax record
- −$25 /mo · $303/yr
- Insurance
- −$25
- HOA
- −$0
- Vacancy / Maint / Mgmt
- −$636
- Net cashflow
- $2,028
Break-even live
Sensitivity live
| Price | -10% $2,062 | -5% $2,045 | +0% $2,028 | +5% $2,011 | +10% $1,994 |
|---|---|---|---|---|---|
| Rent | -10% $1,789 | -5% $1,908 | +0% $2,028 | +5% $2,148 | +10% $2,267 |
| Rate | -1.0pp $2,058 | -0.5pp $2,043 | base $2,028 | +0.5pp $2,012 | +1.0pp $1,997 |
3-unit breakdown (identical units grouped — click to expand)
| Units | Beds | Baths | Est. rent |
|---|---|---|---|
| 1× unit | 3 | 1 | $1,060 |
| 2× units | 2 | 2 | $1,970 |
| #2 | 2 | 2 | $985 |
| #3 | 2 | 2 | $985 |
| Total (3 units) | $3,029 | ||
UW: 25.0% down · 7.5% · 30yr · 1.5% tax · 5.0% vac · 8.0% maint · 8.0% mgmt
Financing live
Cash to close
- Down payment
- $15,000
- Closing costs
- $1,800
- Reserves months
- —
- Total cash needed
- —
Loan-product check · same deal, 3 products live
Conventional
25% down · 7.5% · 30yr
- Down + closing
- —
- Monthly P&I
- —
- Monthly cashflow
- —
- DSCR
- —
- Eligible?
- —
Personal DTI + credit; lowest rate.
DSCR
20% down · 8.5% · 30yr
- Down + closing
- —
- Monthly P&I
- —
- Monthly cashflow
- —
- DSCR
- —
- Eligible?
- —
No personal income docs; deal must DSCR.
Hard money
10% down · 12.0% · 12mo
- Down + closing
- —
- Monthly P&I
- —
- Monthly cashflow
- —
- DSCR
- —
- Eligible?
- —
Short-term bridge; refi at stabilization.
Rent comps 3 comps
| Address | Beds | Baths | Sqft | Rent | $/sqft | DOM | Units | Dist |
|---|---|---|---|---|---|---|---|---|
| 4868 Farlin Ave Unit 2 St. Louis, MO | 2.0 | 1.0 | 2690 | $1,100 | $0.41 | 44d | 1 | 0.37mi |
| 3127 Clay Ave Unit B St. Louis, MO | 1.0 | 1.0 | 3536 | $950 | $0.27 | 44d | 1 | 1.05mi |
| 1416 N Euclid Ave Saint Louis, MO | 2.0 | 2.0 | 2702 | $1,200 | $0.44 | 44d | 1 | 1.37mi |
Listing history 37 events
-
2026-06-21days on market $60,000 Active 33 DOM
-
2026-06-18days on market $60,000 Active 30 DOM
-
2026-06-17days on market $60,000 Active 29 DOM
-
2026-06-16days on market $60,000 Active 28 DOM
-
2026-06-15days on market $60,000 Active 27 DOM
-
2026-06-13days on market $60,000 Active 25 DOM
-
2026-06-09days on market $60,000 Active 21 DOM
-
2026-06-08days on market $60,000 Active 20 DOM
-
2026-06-07days on market $60,000 Active 19 DOM
-
2026-06-05days on market $60,000 Active 16 DOM
-
2026-06-03days on market $60,000 Active 15 DOM
-
2026-06-02days on market $60,000 Active 14 DOM
-
2026-06-01days on market $60,000 Active 13 DOM
-
2026-05-31days on market $60,000 Active 12 DOM
-
2026-05-20$60,000 Active
-
2026-05-19historical $60,000
-
2024-10-02status Pending 386-char remark
Show marketing remark (386 chars)
Incredible cash flow from day one on this 3-unit building! There are two units with HUD vouchers in place & one market tenant. Total monthly gross rent is a whopping $2530! It was originally a 4 unit, but now has one townhome unit and two 1 bed units. The seller is moving on to another opportunity and now this one could be yours! No showings without an accepted contract in place.
-
2024-10-02soldstatus Closed 386-char remark
Show marketing remark (386 chars)
Incredible cash flow from day one on this 3-unit building! There are two units with HUD vouchers in place & one market tenant. Total monthly gross rent is a whopping $2530! It was originally a 4 unit, but now has one townhome unit and two 1 bed units. The seller is moving on to another opportunity and now this one could be yours! No showings without an accepted contract in place.
-
2024-10-02soldstatus $114,000
Show marketing remark (386 chars)
Incredible cash flow from day one on this 3-unit building! There are two units with HUD vouchers in place & one market tenant. Total monthly gross rent is a whopping $2530! It was originally a 4 unit, but now has one townhome unit and two 1 bed units. The seller is moving on to another opportunity and now this one could be yours! No showings without an accepted contract in place.
-
2024-08-30historical Active Under Contract 386-char remark
Show marketing remark (386 chars)
Incredible cash flow from day one on this 3-unit building! There are two units with HUD vouchers in place & one market tenant. Total monthly gross rent is a whopping $2530! It was originally a 4 unit, but now has one townhome unit and two 1 bed units. The seller is moving on to another opportunity and now this one could be yours! No showings without an accepted contract in place.
-
2024-08-23$120,000 Active 386-char remark
Show marketing remark (386 chars)
Incredible cash flow from day one on this 3-unit building! There are two units with HUD vouchers in place & one market tenant. Total monthly gross rent is a whopping $2530! It was originally a 4 unit, but now has one townhome unit and two 1 bed units. The seller is moving on to another opportunity and now this one could be yours! No showings without an accepted contract in place.
-
2024-04-10historical $1,400
-
2024-03-13price $1,400
-
2023-12-26$1,350
-
2020-05-20soldstatus
-
2020-03-04soldstatus $85,000
-
2020-02-27$85,000 21-char remark
Show marketing remark (21 chars)
For Comp Purpose Only
-
2020-02-26soldstatus Closed 21-char remark
Show marketing remark (21 chars)
For Comp Purpose Only
-
2019-11-06soldstatus $41,500
-
2019-11-04status Pending
-
2019-10-29soldstatus Closed
-
2019-08-22historical Active Under Contract
-
2019-08-20$33,500 Active
-
2016-01-29soldstatus Closed
-
2016-01-19historical
-
2015-09-04price $19,900
-
2015-07-08$24,990 Active
ⓘ Source: listings_history table (triggers on properties + properties_extension) + one-shot
backfill from property_details.listing_events for pre-trigger history.
Tax reassessment forecast MO · Resets to sale price
- Current annual tax
- $303 · $25/mo
- Projected year-2 tax
- $582 · $48/mo
- Expected delta
- +$279/yr (+$23/mo · 91.8%)
ⓘ Screening estimate from a state-policy table — verify with the county assessor before closing.
Climate risk First Street
- Flood 1/10 Low FEMA zone X (unshaded) · 0% chance over 30 yrs
- Wildfire 1/10 Low
- Heat 5/10 Major 7 d/yr ≥107°F today · 21 d/yr by 30 yrs out
- Wind 2/10 Low 100% chance of damaging wind over 30 yrs
- Air quality 4/10 Moderate 5 unhealthy d/yr today · 6 by 30 yrs out
Nearby sold comps map
Loading sold comps map…
Walkable amenities ~0.75 mi
Loading nearby amenities…
Taxation est. · year 1
- Rental income
- $36,348
- − Mortgage interest
- −$3,361
- − Property taxes
- −$303
- − Insurance
- −$300
- − Repairs & maintenance
- −$2,908
- − Management
- −$2,908
- − Depreciation
- −$1,745
- Taxable income
- $24,823
- Est. tax owed @ 24.0%
- −$5,957
- After-tax cash flow
- $18,378/yr
For passive investors: Depreciation is non-cash, so a rental often shows a tax loss while cash-flowing — sheltering income. Rental losses are passive: they offset passive income freely, and up to $25,000/yr can offset ordinary (W-2) income if you actively participate and your MAGI is under $100k (phasing out to $0 by $150k); unused losses carry forward. On sale, claimed depreciation is recaptured at up to 25%, and gains may owe capital-gains tax (a 1031 exchange can defer both). Figures are a year-1 estimate at your 24.0% rate — not tax advice; consult a CPA.
Schools (NCES district)
- District
- St. Louis City
- NCES district ID
- 2929280
- Math proficiency
- 10% ▼ -6.00%
- Reading proficiency
- 18% ▼ -3.00%
- Median HH income
- $35,685
- Composite
- 11.54/100
- National rank
- #9699
- State rank
- #312 of 324 in MO
Livability — St. Louis
No livability data for this city. (Only ~50 U.S. cities are tracked.)
Census & demographics
- Census place
- St. Louis, MO
- County
- Saint Louis City · 254,015 people
- City population
- 283,259
- Metro
- St. Louis, MO-IL
- Population (ZIP)
- 14,488
- Household income
- $30,622
- Rent vs Own
- Severe rent burden
- 1655.0
Population outlook (St. Louis County) Hauer SSP2
- Today (2025)
- 315,737 people
- By 2030
- 313,865 · -0.6%
- By 2040
- 305,439 · -3.3%
- By 2050
- 296,529 · -6.1%
- By 2075
- 271,028 · -14.2%
- By 2100
- 255,359 · -19.1%
Race, ethnicity, and origin ACS 2023
- Neighborhood character
- Predominantly Black (95%)
- Race & ethnicity
- Black 95% White 2% Two or more races 2%
- Foreign-born
- 0%
Political lean MEDSL · St. Louis
- 2024 margin
- Solid D (+64.7) · D 81.4% · R 16.7% · Other 2.0%
- 2008→2024 swing
- -3.5pp toward R · 2008: 68.2pp · 2024: 64.7pp
- All cycles
- 2024: D+64.7 2020: D+66.2 2016: D+63.7 2012: D+66.6 2008: D+68.2
Not yet ingested
- Civics
- —
Market trends
- HPI YoY
- ▼ -3.42%
- Current HPI
- 127.3403
- Rent YoY
- —
- Metro
- St. Louis, MO-IL
- State GDP YoY
- ▲ 1.84%
- F500 in state
- 20
Industry mix (Fortune 500 HQ in MO)
| Industry | F500 HQs | Revenue |
|---|---|---|
| Healthcare | 1 | $163B |
|
||
| Insurance | 1 | $21B |
|
||
| Industrial Technology | 1 | $17B |
|
||
| Retail | 1 | $16B |
|
||
| Industrial Distribution | 1 | $10B |
|
||
| Utilities | 1 | $9B |
|
||
Price history
+140.1% since first listed23 events — show timeline
- 2026-05-20 Listed $60,000 MARIS as Distributed by MLS Grid
- 2026-05-19 Coming Soon $60,000 MARIS as Distributed by MLS Grid
- 2024-10-02 Pending — MARIS as Distributed by MLS Grid
- 2024-10-02 Sold (Public Records) $114,000 Public Records
- 2024-10-02 Sold (MLS) — MARIS as Distributed by MLS Grid
- 2024-08-30 Contingent — MARIS as Distributed by MLS Grid
- 2024-08-23 Listed $120,000 MARIS as Distributed by MLS Grid
- 2024-04-10 Rental Removed $1,400 APPFOLIO
- 2024-03-13 Price Changed $1,400 APPFOLIO
- 2023-12-26 Listed for Rent $1,350 APPFOLIO
- 2020-05-20 Sold (Public Records) — Public Records
- 2020-03-04 Sold (Public Records) $85,000 Public Records
- 2020-02-27 Listed $85,000 MARIS as Distributed by MLS Grid
- 2020-02-26 Sold (MLS) — MARIS as Distributed by MLS Grid
- 2019-11-06 Sold (Public Records) $41,500 Public Records
- 2019-11-04 Pending — MARIS as Distributed by MLS Grid
- 2019-10-29 Sold (MLS) — MARIS as Distributed by MLS Grid
- 2019-08-22 Contingent — MARIS as Distributed by MLS Grid
- 2019-08-20 Listed $33,500 MARIS as Distributed by MLS Grid
- 2016-01-29 Sold (MLS) — MARIS as Distributed by MLS Grid
- 2016-01-19 Delisted — MARIS as Distributed by MLS Grid
- 2015-09-04 Price Changed $19,900 MARIS as Distributed by MLS Grid
- 2015-07-08 Listed $24,990 MARIS as Distributed by MLS Grid
Property tax history
-8.0%/yrLatest (2024): $303 · +4.7% YoY. Source: county tax records.
Cash-flow waterfall
monthlySold comps — $/sqft
last 12 mo · ≤1 miLoading sold comps…