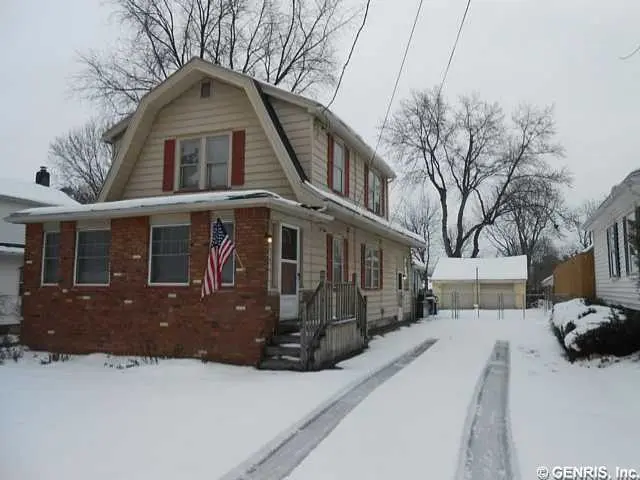
246 Matilda St · North Gates, NY
Flood risk 1/10 · Minimal
- FEMA flood zone
- X (unshaded)
- Chance of flooding over 30 yrs
- 0.0%
- Est. flood insurance / yr
- $473 – $860
Fire risk 1/10 · Minimal
- Est. fire insurance / yr
- $691 – $1,283
Heat risk 2/10 · Minimal
- Hot days now (above 95°F)
- 7 days/yr
- Hot days in 30 yrs
- 15 days/yr
Wind risk 1/10 · Minimal
- Chance of severe wind over 30 yrs
- —
Air-quality risk 2/10 · Minimal
- Unhealthy air days now
- 1 days/yr
- Unhealthy air days in 30 yrs
- 2 days/yr
Risk factors via First Street. Map © Google.
Why this score? — see what drove the C- grade
The composite is a weighted blend of 9 inputs, each scored 0–100. Each bar is that input's sub-score; the figure is the points it added to the 100-point composite (weight × sub-score).
- ARV discount +15.0/15.0
- Cash flow +14.0/30.0
- 1% rule +6.3/10.0
- DSCR +4.3/10.0
- Rent growth +4.1/5.0
- Livability +3.8/5.0
- Schools +3.6/10.0
- Condition / age +2.5/5.0
- Appreciation +0.0/10.0
$159,995
🖨 Deal sheet 📄 Offer letter ✓ Due diligence
Listing remarks MLS
Don't be fooled! Come inside to find a large, open, newly carpeted living/great room, large formal dining room and a huge, open, updated kitchen. New flooring throughout. Updated colors. First floor laundry and powder room. It's a great value! Outside, a fully fenced rear yard, large multi-level deck and 2-car garage. The driveway is extra wide if you need more parking.
Key facts
- Formal dining room
- Expansive kitchen
- Extra wide driveway
Tags
Property features AI
Exterior
- Parking: Detached garage with electricity; 2 garage spaces
- Utilities: Public water connected; Sewer connected
- Home design: 2-story house; Existing/resale property
- Construction: Brick and composite siding; Attic/crawl hatchway(s) insulated; Block and stone foundation; Built previously (existing)
- Exterior features: Blacktop driveway; Gravel driveway; Near public transit; Rectangular residential lot; City street frontage
Interior
- Kitchen: Electric oven; Electric range; Refrigerator; Country-style eat-in kitchen with breakfast bar
- Bedrooms: 1 main-level bedroom
- Flooring: Carpet; Ceramic tile; Hardwood; Vinyl; Varied flooring
- Bathrooms: 1 full bathroom; 1 half bathroom; 1 main-level bathroom
- Heating & cooling: Gas forced-air heating
- Interior features: Breakfast bar; Separate/formal dining room; Eat-in kitchen; Separate/formal living room; Country kitchen; Full basement
- Laundry & utility: Washer; Dryer; Main-level laundry
Neighborhood map
What this means for you Summary
Snapshot
- This is a 3-bed/1.5-bath single-family listed at $160k.
Deal economics
- At list price, monthly cash flow is $22 ($261/yr) — positive.
- The deal already cash-flows at list — no discount required.
- Meets the 1% rule at list price ($2k rent vs $160k).
- Cap rate 6.5% vs local median 4.8% in North Gates — top-decile yield for the area; either an underpriced asset or a hidden risk that comps aren't pricing in. Stress-test before assuming the spread holds.
Location & tenants
- Location reads 75/100 on livability (#245 in NY, #3,859 nationally) — a middle-class / working-renter tenant base. Strengths: housing A+, health & safety A+, cost of living A-; Watch: crime D, schools F, amenities F.
- Gates-Chili Central School District (suburban): math 41% / reading 42% proficiency, ranked #491 of 590 in NY (top 83%) — families likely to look elsewhere, expect single-tenant / working-renter base with shorter leases.
- Market conditions: Rents rising fast (+6.3%/yr); 124 active listings in the ZIP; 2 comparable units currently listed for rent nearby; 1,169 units permitted in Monroe County in 2024 (591 in 5+ unit buildings).
- This rent runs 39% of the median local income ($56k/yr) — at the standard rent-burdened threshold; future hikes will face affordability resistance.
Forward outlook
- Local home prices are declining (-3.0%/yr); year-one equity from $1k of loan paydown is wiped out by about $5k of value loss. Plan a longer hold.
- Monroe County population projected to shrink 6% by 2050 — rents likely to lag national; underwrite the cash flow, not the appreciation.
Negotiation context
- Only 14 days on market — expect competitive offers; lowballing is unlikely to land.
- 4 sale attempts since 12y ago with the ask held roughly flat each time — persistent listings suggest the price (not the market) is what's stuck; bring a comps-based counter.
- Current owner paid $90k; list at $160k implies a 78% gain — meaningful room to come down on a strong offer.
Risks & watch-outs
- Watch-outs: property tax is 3.8% of price; built in 1930 — expect roof / HVAC / electrical / plumbing capex.
Questions for the listing agent
- Built in 1930 — when were the roof, HVAC, electrical panel, plumbing, and water heater last replaced?
- Property tax is high relative to price — has the assessment been appealed recently, and will the sale trigger a re-assessment?
- Is there a deadline driving the sale (1031 exchange, divorce, estate, relocation)? That informs how much negotiation room exists.
- Schools are F-rated, which usually means shorter tenancies and higher turnover. Who's the typical renter profile here, and what's been the actual vacancy rate?
- Crime grade is D in this area — have there been break-ins, vandalism, or insurance claims at this property in the last 3 years? What carrier currently insures it and at what premium?
- What's the average days-on-market for RENTAL listings here right now (not sales)? A rising rental-DOM trend means longer vacancies and softer asking-rent achievability than the comps imply.
- What's the recent tenant-quality profile in this submarket — average credit score on applications, eviction rate, late-payment / NSF rate, and stable-employment percentage? A property-management company in the area should have these aggregated.
- How much new for-sale + rental construction is in the pipeline within 1–3 miles? Heavy new supply typically softens prices + rents 12–24 months out; constrained supply supports both.
Investment metrics
- 1% rule
- 1.13% ✓
- Cap rate
- 6.46%
- Cash-on-cash
- 0.58%
- DSCR
- 1.03
- GRM
- 7.4
CMA / ARV
- ARV (median comp)
- $226,634
- List price
- $159,995
- Delta
- -29.40%
- Verdict
- UNDERPRICED
- Comps
- 20 within 1.0 mi
Show comp detail 12 sales within ~0.75 mi
| Address | Dist | Beds/Ba | Sqft | Sold | Price | $/sf | Match |
|---|---|---|---|---|---|---|---|
| 2525 Lyell Rd | 0.43mi | 3/2.0 | 1,634 (+4%) | 3mo | $285,000 | $174 | 68 |
| 235 Eugene St | 0.04mi | 4/2.5 (+1) | 1,738 (+11%) | 8mo | $240,000 | $138 | 65 |
| 135 Pilot St | 0.66mi | 3/1.5 | 1,520 (-3%) | 3mo | $276,000 | $182 | 62 |
| 38 Debby Ln | 0.61mi | 3/1.0 | 1,528 (-3%) | 6mo | $200,000 | $131 | 60 |
| 89 Ardella St | 0.40mi | 4/2.0 (+1) | 1,682 (+7%) | 3mo | $275,000 | $163 | 60 |
| 81 Elder St | 0.59mi | 4/1.5 (+1) | 1,547 (-1%) | 8mo | $169,900 | $110 | 58 |
| 22 Tarrycrest Ln | 0.30mi | 3/2.0 | 1,728 (+10%) | 10mo | $261,000 | $151 | 58 |
| 87 Simmons St | 0.65mi | 4/1.5 (+1) | 1,520 (-3%) | 6mo | $175,000 | $115 | 54 |
| 4 Drexel Dr | 0.46mi | 3/2.5 | 1,708 (+9%) | 10mo | $270,000 | $158 | 52 |
| 20 Fairchild Rd | 0.41mi | 4/1.0 (+1) | 1,346 (-14%) | 4mo | $203,000 | $151 | 46 |
| 134 Pilot St | 0.67mi | 3/1.5 | 1,332 (-15%) | 5mo | $217,000 | $163 | 40 |
| 111 Lisa Ann Dr | 0.56mi | 3/1.5 | 1,336 (-15%) | 13mo | $268,500 | $201 | 38 |
Match score weights: distance 35% · size 25% · config 20% · recency 20%. Top-matched comps best support the ARV.
Projected returns pro-forma
-3.0% appreciation · 6.28% rent growth · sell at horizon
- IRR
- -10.7%
- Equity multiple
- 0.59×
- Total profit
- $-18,146
- Equity at exit
- $23,856
- IRR
- 3.6%
- Equity multiple
- 1.31×
- Total profit
- $13,991
- Equity at exit
- $13,833
Cash invested: $44,799 (down + closing). Projections, not guarantees.
Landlord ↔ Tenant lean methodology
- Overall (STATE)
- 15 Strongly Tenant-Friendly
- State New York
- 15 Strongly Tenant-Friendly · D+10
- County
- — inherits STATE
- City
- — inherits STATE
ZIP-level market 14606
- Home prices YoY
- -17.9%
- Rents YoY
- 6.3%
- Active inventory
- 124
- Price-to-rent
- 7.4×
Monthly cashflow live
- Estimated rent
- $1,814 medium interval (Pro) →
- Mortgage (P&I)
- −$839
- Tax from tax record
- −$505 /mo · $6,064/yr
- Insurance
- −$67
- HOA
- −$0
- Vacancy / Maint / Mgmt
- −$381
- Net cashflow
- $22
Break-even live
UW: 25.0% down · 7.5% · 30yr · 1.5% tax · 5.0% vac · 8.0% maint · 8.0% mgmt
Financing live
Cash to close
- Down payment
- $39,999
- Closing costs
- $4,800
- Reserves months
- —
- Total cash needed
- —
Loan-product check · same deal, 3 products live
Conventional
25% down · 7.5% · 30yr
- Down + closing
- —
- Monthly P&I
- —
- Monthly cashflow
- —
- DSCR
- —
- Eligible?
- —
Personal DTI + credit; lowest rate.
DSCR
20% down · 8.5% · 30yr
- Down + closing
- —
- Monthly P&I
- —
- Monthly cashflow
- —
- DSCR
- —
- Eligible?
- —
No personal income docs; deal must DSCR.
Hard money
10% down · 12.0% · 12mo
- Down + closing
- —
- Monthly P&I
- —
- Monthly cashflow
- —
- DSCR
- —
- Eligible?
- —
Short-term bridge; refi at stabilization.
Rent comps 2 comps
| Address | Beds | Baths | Sqft | Rent | $/sqft | DOM | Units | Dist |
|---|---|---|---|---|---|---|---|---|
| 155 Canal Landing Blvd Rochester, NY | 1.0–3.0 | 1.5–2.0 | 1174 | $2,050 | $1.75 | 2d | 5 | 0.85mi |
| 19 Garland Ave Rochester, NY | 3.0 | 1.0 | 1104 | $1,850 | $1.68 | 2d | 1 | 1.40mi |
Listing history 10 events
-
2026-06-09statusdays on market $159,995 Pending 14 DOM
-
2026-06-07days on market $159,995 Active 13 DOM
-
2026-06-05days on market $159,995 Active 10 DOM
-
2026-06-03days on market $159,995 Active 9 DOM
-
2026-06-03days on market $159,995 Active 8 DOM
-
2026-06-02statusdays on market $159,995 Active 7 DOM
-
2026-05-04$159,995 Active
-
2015-04-08soldstatus $90,000 372-char remark
Show marketing remark (372 chars)
Don't be fooled! Come inside to find a large, open, newly carpeted living/great room, large formal dining room and a huge, open, updated kitchen. New flooring throughout. Updated colors. First floor laundry and powder room. It's a great value! Outside, a fully fenced rear yard, large multi-level deck and 2-car garage. The driveway is extra wide if you need more parking.
-
2015-01-04$94,995 372-char remark
Show marketing remark (372 chars)
Don't be fooled! Come inside to find a large, open, newly carpeted living/great room, large formal dining room and a huge, open, updated kitchen. New flooring throughout. Updated colors. First floor laundry and powder room. It's a great value! Outside, a fully fenced rear yard, large multi-level deck and 2-car garage. The driveway is extra wide if you need more parking.
-
2014-09-14$94,995
ⓘ Source: listings_history table (triggers on properties + properties_extension) + one-shot
backfill from property_details.listing_events for pre-trigger history.
Tax reassessment forecast NY · Partial reset (capped growth)
- Current annual tax
- $6,064 · $505/mo
- Projected year-2 tax
- $6,064 · $505/mo
- Expected delta
- $0/yr ($0/mo · 0.0%)
ⓘ Screening estimate from a state-policy table — verify with the county assessor before closing.
Climate risk First Street
- Flood 1/10 Low FEMA zone X (unshaded) · 0% chance over 30 yrs
- Wildfire 1/10 Low
- Heat 2/10 Low 7 d/yr ≥95°F today · 15 d/yr by 30 yrs out
- Wind 1/10 Low
- Air quality 2/10 Low 1 unhealthy d/yr today · 2 by 30 yrs out
Nearby sold comps map
Loading sold comps map…
Walkable amenities ~0.75 mi
Loading nearby amenities…
Taxation est. · year 1
- Rental income
- $21,763
- − Mortgage interest
- −$8,962
- − Property taxes
- −$6,064
- − Insurance
- −$800
- − Repairs & maintenance
- −$1,741
- − Management
- −$1,741
- − Depreciation
- −$4,654
- Taxable loss
- −$2,200
- Est. tax savings @ 24.0%
- +$528
- After-tax cash flow
- $788/yr
For passive investors: Depreciation is non-cash, so a rental often shows a tax loss while cash-flowing — sheltering income. Rental losses are passive: they offset passive income freely, and up to $25,000/yr can offset ordinary (W-2) income if you actively participate and your MAGI is under $100k (phasing out to $0 by $150k); unused losses carry forward. On sale, claimed depreciation is recaptured at up to 25%, and gains may owe capital-gains tax (a 1031 exchange can defer both). Figures are a year-1 estimate at your 24.0% rate — not tax advice; consult a CPA.
Schools (NCES district)
- District
- Gates-Chili Central School District
- NCES district ID
- 3611880
- Math proficiency
- 41% ▼ -12.00%
- Reading proficiency
- 42% ▼ -6.00%
- Median HH income
- $55,045
- Composite
- 36.23/100
- National rank
- #4719
- State rank
- #491 of 590 in NY
Livability — North Gates
- Score
- 75/100
- State rank
- #245
- US rank
- #3859
Category grades
Schools grade is shown separately in the Schools card above.
Census & demographics
- Census place
- North Gates, NY
- County
- Monroe County · 674,131 people
- City population
- 27,478
- Metro
- Rochester, NY
- Population (ZIP)
- 25,538
- Household income
- $55,807
- Rent vs Own
- Severe rent burden
- 986.0
Population outlook (Monroe County) Hauer SSP2
- Today (2025)
- 759,460 people
- By 2030
- 757,154 · -0.3%
- By 2040
- 740,644 · -2.5%
- By 2050
- 714,443 · -5.9%
- By 2075
- 645,883 · -15.0%
- By 2100
- 547,084 · -28.0%
Race, ethnicity, and origin ACS 2023
- Neighborhood character
- Diverse neighborhood (Simpson 0.64)
- Race & ethnicity
- White 51% Black 26% Hispanic / Latino 17% Two or more races 8% Asian 3%
- Hispanic origin (detail)
- Puerto Rican 12% Cuban 2%
- Common ancestry
- Romanian 3% Lithuanian 1% Iranian 1%
- Foreign-born
- 10% · Canada, Vietnam, Philippines
- Languages at home
- 79% English-only · Spanish 12% Other Indo-European 3% Other Asian/Pacific 2%
Political lean MEDSL · Monroe
- 2024 margin
- D (+19.1) · D 59.5% · R 40.5%
- 2008→2024 swing
- +1.4pp toward D · 2008: 17.7pp · 2024: 19.1pp
- All cycles
- 2024: D+19.1 2020: D+21.0 2016: D+14.1 2012: D+17.4 2008: D+17.7
Not yet ingested
- Civics
- —
Market trends
- HPI YoY
- ▼ -62.59%
- Current HPI
- 287.6868
- Rent YoY
- ▲ 6.28%
- Metro
- Rochester, NY
- State GDP YoY
- ▲ 2.60%
- F500 in state
- 92
Industry mix (Fortune 500 HQ in NY)
| Industry | F500 HQs | Revenue |
|---|---|---|
| Financial Services | 10 | $950B |
|
||
| Consumer Goods | 9 | $162B |
|
||
| Insurance | 4 | $225B |
|
||
| Telecommunications | 2 | $144B |
|
||
| Pharmaceuticals | 2 | $112B |
|
||
| Media / Entertainment | 2 | $69B |
|
||
Price history
+68.4% since first listed6 events — show timeline
- 2026-06-08 Pending — UNYREIS
- 2026-06-01 Relisted — UNYREIS
- 2026-05-04 Listed $159,995 UNYREIS
- 2015-04-08 Sold (MLS) $90,000 UNYREIS
- 2015-01-04 Listed $94,995 UNYREIS
- 2014-09-14 Listed $94,995 UNYREIS
Property tax history
+5.5%/yrLatest (2025): $6,064 · +28.5% YoY. Source: county tax records.
Cash-flow waterfall
monthlySold comps — $/sqft
last 12 mo · ≤1 miLoading sold comps…