10153 W 600 N · Monterey, IN
Flood risk 1/10 · Minimal
- FEMA flood zone
- X (unshaded)
- Chance of flooding over 30 yrs
- 0.0%
- Est. flood insurance / yr
- $473 – $860
Fire risk 1/10 · Minimal
- Est. fire insurance / yr
- $717 – $1,331
Heat risk 2/10 · Minimal
- Hot days now (above 100°F)
- 7 days/yr
- Hot days in 30 yrs
- 16 days/yr
Wind risk 2/10 · Minimal
- Chance of severe wind over 30 yrs
- —
Air-quality risk 2/10 · Minimal
- Unhealthy air days now
- 1 days/yr
- Unhealthy air days in 30 yrs
- 2 days/yr
Risk factors via First Street. Map © Google.
Why this score? — see what drove the D grade
The composite is a weighted blend of 9 inputs, each scored 0–100. Each bar is that input's sub-score; the figure is the points it added to the 100-point composite (weight × sub-score).
- Cash flow +15.0/30.0
- ARV discount +7.5/15.0
- 1% rule +5.0/10.0
- DSCR +5.0/10.0
- Livability +2.9/5.0
- Schools +2.6/10.0
- Rent growth +2.5/5.0
- Condition / age +2.5/5.0
- Appreciation +0.0/10.0
$29,900
🖨 Deal sheet 📄 Offer letter ✓ Due diligence
Listing remarks
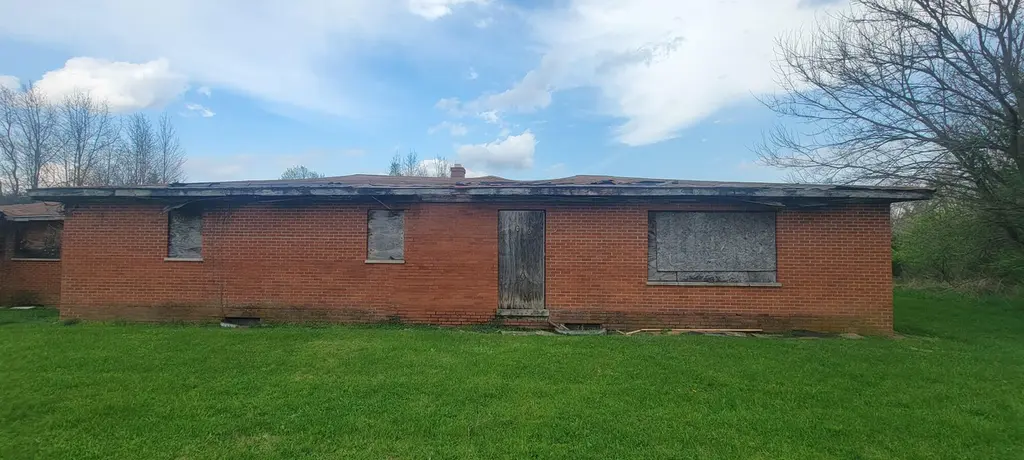
Attention investors and DIY enthusiasts! Multiple exit strategies: finish this remodel then either flip, rent or move in! Home being sold as is. Home has two additional plots attached. Cash preferred but will consider financed all offers. Seller is assisted by an Attorney in Fact. Do not knock on door or approach house without prior communication.
Key facts
- 1.57 acre lot
- Built 1962
- Listed 30 days
Property features AI
Finance
- Other: Occupant status: Vacant
- Financial info: Property listed as fixer (condition may affect financing/repairs)
- HOA & community: No HOA information provided
Exterior
- Parking: Off-street parking
- Security: No security features listed
- Utilities: Public water; Public sewer
- Home design: Single-story home; Built in 1962; Property listed as fixer
- Construction: Unfinished basement (foundation detail); No construction materials or roof information provided
- Exterior features: Neighborhood view
Interior
- Kitchen: No appliances listed
- Bedrooms: Primary bedroom; Two additional bedrooms (three bedrooms total); Total of 5 rooms including bedrooms, living room, and kitchen
- Flooring: No flooring information provided
- Bathrooms: One full bathroom
- Heating & cooling: Forced air heating; No cooling system
- Interior features: No notable interior features listed; Unfinished basement
- Laundry & utility: No laundry or utility appliances listed
Neighborhood map
What this means for you Summary
Snapshot
- This is a 3-bed/1.0-bath single-family listed at $30k.
Deal economics
- At list price, monthly cash flow is $844 ($10k/yr) — positive.
- The deal already cash-flows at list — no discount required.
- Meets the 1% rule at list price ($1k rent vs $30k).
- Recommended offer: $29k (3.0% below list) — sets the bar for market timing.
Location & tenants
- Location reads 58/100 on livability (#588 in IN) — a working-class tenant base; expect higher turnover. Strengths: cost of living A+, housing A+; Watch: crime D+, schools D-, amenities F.
- Culver Community Schools Corporation (rural): math 27% / reading 35% proficiency, ranked #236 of 301 in IN (top 78%) — families likely to look elsewhere, expect single-tenant / working-renter base with shorter leases.
- Market conditions: 97 active listings in the ZIP; 23 units permitted in Fulton County in 2024 (0 in 5+ unit buildings).
Forward outlook
- Local home prices are declining (-3.0%/yr); year-one equity from $207 of loan paydown is wiped out by about $897 of value loss. Plan a longer hold.
- Fulton County population projected at -13% by 2050 — secular population decline; favor cash flow + early exit over multi-decade hold.
- At projected returns (-3.0% appreciation + 3.0% rent growth), your $8k cash investment doubles in ~1 year — after that, you're playing with house money.
Negotiation context
- It's been on market 31 days — a 3% lower offer ($29k) is reasonable based on typical stale-listing flexibility.
Questions for the listing agent
- It's been on market 31 days. Have you received any prior offers? Is the seller open to a 3% concession, seller financing, or rate buy-down credit?
- Built in 1962 — when were the roof, HVAC, electrical panel, plumbing, and water heater last replaced?
- Is there a deadline driving the sale (1031 exchange, divorce, estate, relocation)? That informs how much negotiation room exists.
- Schools are D-rated, which usually means shorter tenancies and higher turnover. Who's the typical renter profile here, and what's been the actual vacancy rate?
- Crime grade is D in this area — have there been break-ins, vandalism, or insurance claims at this property in the last 3 years? What carrier currently insures it and at what premium?
- The area grade is low — what's the realistic commute time and amenity access for the typical tenant pool here? Any planned neighborhood developments (good or bad) we should know about?
- What's the average days-on-market for RENTAL listings here right now (not sales)? A rising rental-DOM trend means longer vacancies and softer asking-rent achievability than the comps imply.
- What's the recent tenant-quality profile in this submarket — average credit score on applications, eviction rate, late-payment / NSF rate, and stable-employment percentage? A property-management company in the area should have these aggregated.
- How much new for-sale + rental construction is in the pipeline within 1–3 miles? Heavy new supply typically softens prices + rents 12–24 months out; constrained supply supports both.
Investment metrics
- 1% rule
- 4.36% ✓
- Cap rate
- 40.18%
- Cash-on-cash
- 121.02%
- DSCR
- 6.38
- GRM
- 1.9
CMA / ARV
No comps found within radius.
Projected returns pro-forma
-3.0% appreciation · 3.0% rent growth · sell at horizon
- IRR
- —
- Equity multiple
- 6.85×
- Total profit
- $48,936
- Equity at exit
- $4,458
- IRR
- —
- Equity multiple
- 14.36×
- Total profit
- $111,882
- Equity at exit
- $2,585
Cash invested: $8,372 (down + closing). Projections, not guarantees.
Landlord ↔ Tenant lean methodology
- Overall (STATE)
- 90 Strongly Landlord-Friendly
- State Indiana
- 90 Strongly Landlord-Friendly · R+11
- County
- — inherits STATE
- City
- — inherits STATE
ZIP-level market 46975
- Home prices YoY
- -28.7%
- Active inventory
- 97
- Price-to-rent
- 1.9×
Monthly cashflow live
- Estimated rent
- $1,303 medium interval (Pro) →
- Mortgage (P&I)
- −$157
- Tax from tax record
- −$16 /mo · $187/yr
- Insurance
- −$12
- HOA
- −$0
- Vacancy / Maint / Mgmt
- −$274
- Net cashflow
- $844
Break-even live
UW: 25.0% down · 7.5% · 30yr · 1.5% tax · 5.0% vac · 8.0% maint · 8.0% mgmt
Financing live
Cash to close
- Down payment
- $7,475
- Closing costs
- $897
- Reserves months
- —
- Total cash needed
- —
Loan-product check · same deal, 3 products live
Conventional
25% down · 7.5% · 30yr
- Down + closing
- —
- Monthly P&I
- —
- Monthly cashflow
- —
- DSCR
- —
- Eligible?
- —
Personal DTI + credit; lowest rate.
DSCR
20% down · 8.5% · 30yr
- Down + closing
- —
- Monthly P&I
- —
- Monthly cashflow
- —
- DSCR
- —
- Eligible?
- —
No personal income docs; deal must DSCR.
Hard money
10% down · 12.0% · 12mo
- Down + closing
- —
- Monthly P&I
- —
- Monthly cashflow
- —
- DSCR
- —
- Eligible?
- —
Short-term bridge; refi at stabilization.
Listing history 18 events
-
2026-06-19days on market $29,900 Active 31 DOM
-
2026-06-18days on market $29,900 Active 30 DOM
-
2026-06-17days on market $29,900 Active 29 DOM
-
2026-06-16days on market $29,900 Active 28 DOM
-
2026-06-15days on market $29,900 Active 27 DOM
-
2026-06-14days on market $29,900 Active 25 DOM
-
2026-06-12days on market $29,900 Active 24 DOM
-
2026-06-09days on market $29,900 Active 21 DOM
-
2026-06-08days on market $29,900 Active 20 DOM
-
2026-06-07days on market $29,900 Active 19 DOM
-
2026-06-07days on market $29,900 Active 18 DOM
-
2026-06-03remarks 349-char remark
-
2026-06-03price $29,900 Active 14 DOM
-
2026-06-02days on market $39,900 Active 14 DOM
-
2026-06-01days on market $39,900 Active 13 DOM
-
2026-05-31days on market $39,900 Active 12 DOM
-
2026-05-30days on market $39,900 Active 11 DOM
-
2026-05-19$39,900 Active
ⓘ Source: listings_history table (triggers on properties + properties_extension) + one-shot
backfill from property_details.listing_events for pre-trigger history.
Tax reassessment forecast IN · Partial reset (capped growth)
- Current annual tax
- $187 · $16/mo
- Projected year-2 tax
- $221 · $18/mo
- Expected delta
- +$33/yr (+$3/mo · 17.8%)
ⓘ Screening estimate from a state-policy table — verify with the county assessor before closing.
Climate risk First Street
- Flood 1/10 Low FEMA zone X (unshaded) · 0% chance over 30 yrs
- Wildfire 1/10 Low
- Heat 2/10 Low 7 d/yr ≥100°F today · 16 d/yr by 30 yrs out
- Wind 2/10 Low
- Air quality 2/10 Low 1 unhealthy d/yr today · 2 by 30 yrs out
Nearby sold comps map
Loading sold comps map…
Walkable amenities ~0.75 mi
Loading nearby amenities…
Taxation est. · year 1
- Rental income
- $15,633
- − Mortgage interest
- −$1,675
- − Property taxes
- −$187
- − Insurance
- −$150
- − Repairs & maintenance
- −$1,251
- − Management
- −$1,251
- − Depreciation
- −$870
- Taxable income
- $10,250
- Est. tax owed @ 24.0%
- −$2,460
- After-tax cash flow
- $7,672/yr
For passive investors: Depreciation is non-cash, so a rental often shows a tax loss while cash-flowing — sheltering income. Rental losses are passive: they offset passive income freely, and up to $25,000/yr can offset ordinary (W-2) income if you actively participate and your MAGI is under $100k (phasing out to $0 by $150k); unused losses carry forward. On sale, claimed depreciation is recaptured at up to 25%, and gains may owe capital-gains tax (a 1031 exchange can defer both). Figures are a year-1 estimate at your 24.0% rate — not tax advice; consult a CPA.
Schools (NCES district)
- District
- Culver Community Schools Corporation
- NCES district ID
- 1802520
- Math proficiency
- 27% ▼ -9.00%
- Reading proficiency
- 35% ▼ -5.00%
- Median HH income
- $43,718
- Composite
- 26.41/100
- National rank
- #7227
- State rank
- #236 of 301 in IN
Livability — Monterey
- Score
- 58/100
- State rank
- #588
- US rank
- #21074
Category grades
Schools grade is shown separately in the Schools card above.
Census & demographics
- County
- Fulton County · 13,824 people
- Metro
- nan
- Population (ZIP)
- 13,824
- Household income
- $61,185
- Rent vs Own
- Severe rent burden
- 238.0
Population outlook (Fulton County) Hauer SSP2
- Today (2025)
- 19,537 people
- By 2030
- 19,013 · -2.7%
- By 2040
- 17,959 · -8.1%
- By 2050
- 17,038 · -12.8%
- By 2075
- 15,117 · -22.6%
- By 2100
- 13,179 · -32.5%
Race, ethnicity, and origin ACS 2023
- Neighborhood character
- Predominantly White (91%)
- Race & ethnicity
- White 91% Hispanic / Latino 4% Two or more races 3%
- Common ancestry
- Iranian 2% Scottish 2% Lithuanian 2%
- Foreign-born
- 1% · Canada
- Languages at home
- 97% English-only · German/W. Germanic 2% Spanish 1%
Political lean MEDSL · Fulton
- 2024 margin
- Solid R (+51.2) · D 23.7% · R 74.9% · Other 1.4%
- 2008→2024 swing
- -35.2pp toward R · 2008: -16.0pp · 2024: -51.2pp
- All cycles
- 2024: R+51.2 2020: R+48.2 2016: R+48.4 2012: R+33.2 2008: R+16.0
Not yet ingested
- Civics
- —
Market trends
- HPI YoY
- ▼ -85.72%
- Current HPI
- 212.9033
- Rent YoY
- —
- Metro
- nan
- State GDP YoY
- ▲ 2.90%
- F500 in state
- 18
Industry mix (Fortune 500 HQ in IN)
| Industry | F500 HQs | Revenue |
|---|---|---|
| Industrial Machinery | 2 | $37B |
|
||
| Healthcare | 1 | $177B |
|
||
| Pharmaceuticals | 1 | $45B |
|
||
| Metals / Steel | 1 | $18B |
|
||
| Agriculture | 1 | $17B |
|
||
| Packaging | 1 | $12B |
|
||
Price history
1 event — show timeline
- 2026-05-19 Listed $39,900 NIRA MLS as Distributed by MLS Grid
Property tax history
+0.6%/yrLatest (2024): $187 · +2.6% YoY. Source: county tax records.
Cash-flow waterfall
monthlySold comps — $/sqft
last 12 mo · ≤1 miLoading sold comps…