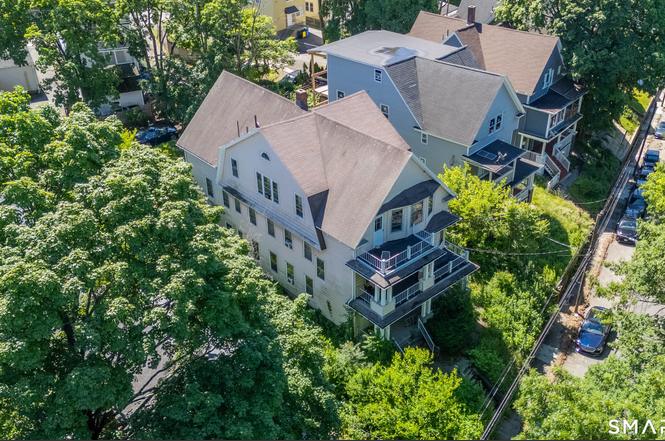
 Triplex
61 Idylwood Ave · Waterbury, CT
Flood risk 1/10 · Minimal
- FEMA flood zone
- X (unshaded)
- Chance of flooding over 30 yrs
- 0.0%
- Est. flood insurance / yr
- $473 – $860
Fire risk 2/10 · Minimal
- Est. fire insurance / yr
- $829 – $1,539
Heat risk 5/10 · Moderate
- Hot days now (above 96°F)
- 7 days/yr
- Hot days in 30 yrs
- 15 days/yr
Wind risk 6/10 · Moderate
- Chance of severe wind over 30 yrs
- 27.0%
Air-quality risk 3/10 · Minor
- Unhealthy air days now
- 2 days/yr
- Unhealthy air days in 30 yrs
- 3 days/yr
Risk factors via First Street. Map © Google.
Why this score? — see what drove the C+ grade
The composite is a weighted blend of 9 inputs, each scored 0–100. Each bar is that input's sub-score; the figure is the points it added to the 100-point composite (weight × sub-score).
- Cash flow +23.9/30.0
- ARV discount +10.8/15.0
- DSCR +7.7/10.0
- 1% rule +6.8/10.0
- Livability +4.0/5.0
- Rent growth +3.3/5.0
- Condition / age +2.5/5.0
- Schools +1.5/10.0
- Appreciation +0.0/10.0
$450,000
🖨 Deal sheet (PDF) 📄 Offer letter ✓ Due diligence
Multi-family units
County records classify this as Multi-Family (2-4 Unit). Listing-text estimate: 3 units. confirmed
Listing remarks
Large 3 family home that will be fully vacant at closing. Here is a chance to renovate and fill with new tenants for top dollar! All utilities are separated. Owner's electrical panel as well as 3 unit panels. 3 separate natural gas boilers and 3 separate natural gas hot water heaters. City water and city sewer. Large units with a total of 9 bedrooms and 4 full baths.
Key facts
- Natural gas boilers
- City water
- Separated utilities
Tags
Property features AI
Exterior
- Utilities: Public water connected; Public sewer connected; Natural gas hot water
- Home design: Multi-family property (3-family)
- Construction: Frame construction; Stone foundation; Asphalt shingle roof; Aluminum siding
- Exterior features: Porch; Level lot
Interior
- Bedrooms: 8 bedrooms
- Bathrooms: 4 full bathrooms
- Heating & cooling: Hot water heating; Natural gas fuel for heat and hot water
- Interior features: 17 total rooms; Full unfinished basement; Attic with hatch access
Neighborhood map
What this means for you Summary
Snapshot
- This is a 3 × 3-bed/1.3-bath units multifamily listed at $450k.
Deal economics
- At list price, monthly cash flow is $870 ($10k/yr) — positive. Per door: $290/mo.
- The deal already cash-flows at list — no discount required.
- Meets the 1% rule at list price ($5k rent vs $450k).
- Cap rate 8.6% vs local median 3.5% in Waterbury — top-decile yield for the area; either an underpriced asset or a hidden risk that comps aren't pricing in. Stress-test before assuming the spread holds.
Location & tenants
- Location reads 79/100 on livability (#32 in CT, #2,205 nationally) — a middle-class / working-renter tenant base. Strengths: commute A+, cost of living A+, housing A+; Watch: crime D, employment D.
- Waterbury School District (suburban): math 12% / reading 23% proficiency, ranked #148 of 153 in CT (top 97%) — low school quality limits family demand, transient renter base, plan for 1-2y turnover; 73% free/reduced lunch — lower-income household profile, screen leases tightly.
- Zoned schools: Gilmartin School (math 8% / reading 14%, grade F, #505 of 553 statewide, top 91%, 480 students, 77% FRL); Crosby High School (math 2% / reading 17%, grade F, #187 of 194 statewide, top 96%, 1,400 students, 84% FRL).
- Market conditions: Rents rising (+3.4%/yr); 82 active listings in the ZIP; 1 comparable units currently listed for rent nearby; 502 units permitted in Naugatuck Valley Planning Region in 2024 (171 in 5+ unit buildings).
- At $5,292/mo this rent would consume 118% of the median local household income ($54k/yr) (locally 1690% of renters already pay >50% of income on rent) — very limited rent-growth headroom before tenants either downsize or default.
Forward outlook
- Local home prices are declining (-3.0%/yr); year-one equity from $3k of loan paydown is wiped out by about $14k of value loss. Plan a longer hold.
Negotiation context
- Only 4 days on market — expect competitive offers; lowballing is unlikely to land.
Risks & watch-outs
- Watch-outs: built in 1914 — expect roof / HVAC / electrical / plumbing capex.
- Climate carrying-cost: major wind risk, 27% chance of damaging wind over 30y; extreme-heat days projected 7→15/yr by 2055 (HVAC capex compounding) — expect insurance premiums to compound above CPI over the hold.
Questions for the listing agent
- Can we see the unit-by-unit rent roll, current vacancy, and any below-market leases? What's the average tenancy length?
- What capital expenditures (roof, boiler, parking lot, exteriors) have been made in the last 5 years, and what's planned in the next 2?
- Built in 1914 — when were the roof, HVAC, electrical panel, plumbing, and water heater last replaced?
- Is there a deadline driving the sale (1031 exchange, divorce, estate, relocation)? That informs how much negotiation room exists.
- Schools are D-rated, which usually means shorter tenancies and higher turnover. Who's the typical renter profile here, and what's been the actual vacancy rate?
- Crime grade is D in this area — have there been break-ins, vandalism, or insurance claims at this property in the last 3 years? What carrier currently insures it and at what premium?
- What's the average days-on-market for RENTAL listings here right now (not sales)? A rising rental-DOM trend means longer vacancies and softer asking-rent achievability than the comps imply.
- What's the recent tenant-quality profile in this submarket — average credit score on applications, eviction rate, late-payment / NSF rate, and stable-employment percentage? A property-management company in the area should have these aggregated.
- How much new apartment / multifamily construction is in the pipeline within 1–3 miles? Heavy new supply (>2% of stock underway) typically softens rents 12–24 months out; light construction supports rent growth.
Investment metrics
- 1% rule
- 1.18% ✓
- Cap rate
- 8.61%
- Cash-on-cash
- 8.28%
- DSCR
- 1.37
- GRM
- 7.1
CMA / ARV
- ARV (on-the-fly)
- $485,463
- Comps found
- 4
Show comp detail 4 sales within ~0.75 mi
| Address | Dist | Beds/Ba | Sqft | Sold | Price | $/sf | Match |
|---|---|---|---|---|---|---|---|
| 181 Fairlawn Ave | 0.61mi | 9/3.0 | 3,432 (-0%) | 5mo | $485,000 | $141 | 67 |
| 149 Southmayd Rd | 0.42mi | 9/3.0 | 3,750 (+9%) | 5mo | $425,000 | $113 | 61 |
| 80 Englewood Ave | 0.06mi | 9/3.0 | 2,976 (-14%) | 23mo | $430,000 | $144 | 55 |
| 280 Meriden Rd | 0.54mi | 8/3.0 (-1) | 3,443 (0%) | 24mo | $430,000 | $125 | 50 |
Match score weights: distance 35% · size 25% · config 20% · recency 20%. Top-matched comps best support the ARV.
Projected returns pro-forma
-3.0% appreciation · 3.37% rent growth · sell at horizon
- IRR
- -3.2%
- Equity multiple
- 0.88×
- Total profit
- $-15,354
- Equity at exit
- $67,096
- IRR
- 6.9%
- Equity multiple
- 1.53×
- Total profit
- $66,948
- Equity at exit
- $38,908
Cash invested: $126,000 (down + closing). Projections, not guarantees.
Landlord ↔ Tenant lean methodology
- Overall (STATE)
- 27 Tenant-Leaning
- State Connecticut
- 27 Tenant-Leaning · D+7
- County
- — inherits STATE
- City
- — inherits STATE
ZIP-level market 06705
- Home prices YoY
- -11.0%
- Rents YoY
- 3.4%
- Active inventory
- 82
- Price-to-rent
- 21.3×
Monthly cashflow live
- Estimated rent
- $5,292 high interval (Pro) →
- Mortgage (P&I)
- −$2,360
- Tax from tax record
- −$764 /mo · $9,165/yr
- Insurance
- −$188
- HOA
- −$0
- Vacancy / Maint / Mgmt
- −$1,111
- Net cashflow
- $870
Break-even live
Sensitivity live
| Price | -10% $1,124 | -5% $997 | +0% $870 | +5% $742 | +10% $615 |
|---|---|---|---|---|---|
| Rent | -10% $452 | -5% $661 | +0% $870 | +5% $1,079 | +10% $1,288 |
| Rate | -1.0pp $1,096 | -0.5pp $984 | base $870 | +0.5pp $753 | +1.0pp $634 |
3-unit breakdown (identical units grouped — click to expand)
| Units | Beds | Baths | Est. rent |
|---|---|---|---|
| 3× units | 3 | 1.3 | $5,292 |
| #1 | 3 | 1.3 | $1,764 |
| #2 | 3 | 1.3 | $1,764 |
| #3 | 3 | 1.3 | $1,764 |
| Total (3 units) | $5,292 | ||
UW: 25.0% down · 7.5% · 30yr · 1.5% tax · 5.0% vac · 8.0% maint · 8.0% mgmt
Financing live
Cash to close
- Down payment
- $112,500
- Closing costs
- $13,500
- Reserves months
- —
- Total cash needed
- —
Loan-product check · same deal, 3 products live
Conventional
25% down · 7.5% · 30yr
- Down + closing
- —
- Monthly P&I
- —
- Monthly cashflow
- —
- DSCR
- —
- Eligible?
- —
Personal DTI + credit; lowest rate.
DSCR
20% down · 8.5% · 30yr
- Down + closing
- —
- Monthly P&I
- —
- Monthly cashflow
- —
- DSCR
- —
- Eligible?
- —
No personal income docs; deal must DSCR.
Hard money
10% down · 12.0% · 12mo
- Down + closing
- —
- Monthly P&I
- —
- Monthly cashflow
- —
- DSCR
- —
- Eligible?
- —
Short-term bridge; refi at stabilization.
Rent comps 1 comps
| Address | Beds | Baths | Sqft | Rent | $/sqft | DOM | Units | Dist |
|---|---|---|---|---|---|---|---|---|
| 20 Coe St Waterbury, CT | 9.0 | 3.0 | 3240 | $1,800 | $0.56 | 4d | 1 | 1.25mi |
Listing history 3 events
-
2026-06-21days on market $450,000 Active 4 DOM
-
2026-06-17remarks 369-char remark
-
2026-06-17$450,000 Active 1 DOM
ⓘ Source: listings_history table (triggers on properties + properties_extension) + one-shot
backfill from property_details.listing_events for pre-trigger history.
Tax reassessment forecast CT · Partial reset (capped growth)
- Current annual tax
- $9,165 · $764/mo
- Projected year-2 tax
- $9,398 · $783/mo
- Expected delta
- +$232/yr (+$19/mo · 2.5%)
ⓘ Screening estimate from a state-policy table — verify with the county assessor before closing.
Climate risk First Street
- Flood 1/10 Low FEMA zone X (unshaded) · 0% chance over 30 yrs
- Wildfire 2/10 Low
- Heat 5/10 Major 7 d/yr ≥96°F today · 15 d/yr by 30 yrs out
- Wind 6/10 Major 27% chance of damaging wind over 30 yrs
- Air quality 3/10 Moderate 2 unhealthy d/yr today · 3 by 30 yrs out
Nearby sold comps map
Loading sold comps map…
Walkable amenities ~0.75 mi
Loading nearby amenities…
Taxation est. · year 1
- Rental income
- $63,504
- − Mortgage interest
- −$25,207
- − Property taxes
- −$9,165
- − Insurance
- −$2,250
- − Repairs & maintenance
- −$5,080
- − Management
- −$5,080
- − Depreciation
- −$13,091
- Taxable income
- $3,630
- Est. tax owed @ 24.0%
- −$871
- After-tax cash flow
- $9,564/yr
For passive investors: Depreciation is non-cash, so a rental often shows a tax loss while cash-flowing — sheltering income. Rental losses are passive: they offset passive income freely, and up to $25,000/yr can offset ordinary (W-2) income if you actively participate and your MAGI is under $100k (phasing out to $0 by $150k); unused losses carry forward. On sale, claimed depreciation is recaptured at up to 25%, and gains may owe capital-gains tax (a 1031 exchange can defer both). Figures are a year-1 estimate at your 24.0% rate — not tax advice; consult a CPA.
Schools (NCES district)
- District
- Waterbury School District
- NCES district ID
- 0904830
- Math proficiency
- 12% ▼ -7.00%
- Reading proficiency
- 23% ▼ -8.00%
- Median HH income
- $40,040
- Composite
- 14.85/100
- National rank
- #9380
- State rank
- #148 of 153 in CT
Livability — Waterbury
- Score
- 79/100
- State rank
- #32
- US rank
- #2205
Category grades
Schools grade is shown separately in the Schools card above.
Census & demographics
- Census place
- Waterbury, CT
- County
- New Haven County · 688,236 people
- City population
- 115,012
- Metro
- New Haven-Milford, CT
- Population (ZIP)
- 25,266
- Household income
- $53,954
- Rent vs Own
- Severe rent burden
- 1690.0
Population outlook (Naugatuck Valley County) Hauer SSP2
- By 2040
- 496,846
Race, ethnicity, and origin ACS 2023
- Neighborhood character
- Highly diverse neighborhood (Simpson 0.71)
- Race & ethnicity
- White 34% Hispanic / Latino 34% Black 22% Two or more races 14% Asian 4%
- Hispanic origin (detail)
- Mexican 2% Puerto Rican 22% Dominican 3%
- Common ancestry
- Lithuanian 6% Hispanic 3% Romanian 2%
- Foreign-born
- 19% · Canada, Jamaica, China
- Languages at home
- 66% English-only · Spanish 22% Other Indo-European 6% French/Haitian/Cajun 3%
Political lean MEDSL · Naugatuck Valley
- 2024 margin
- Lean R (+7.4) · D 45.6% · R 53.0% · Other 1.4%
- All cycles
- 2024: R+7.4
Not yet ingested
- Civics
- —
Market trends
- HPI YoY
- ▼ -37.50%
- Current HPI
- 304.4948
- Rent YoY
- ▲ 3.37%
- Metro
- New Haven-Milford, CT
- State GDP YoY
- ▲ 1.06%
- F500 in state
- 38
Industry mix (Fortune 500 HQ in CT)
| Industry | F500 HQs | Revenue |
|---|---|---|
| Industrial Machinery | 4 | $38B |
|
||
| Insurance | 3 | $71B |
|
||
| Financial Services | 2 | $25B |
|
||
| Transportation / Logistics | 2 | $18B |
|
||
| Healthcare | 1 | $247B |
|
||
| Telecommunications | 1 | $55B |
|
||
Price history
1 event — show timeline
- 2026-06-15 Listed $450,000 Smart MLS
Property tax history
+5.1%/yrLatest (2023): $9,165 · +71.8% YoY. Source: county tax records.
Cash-flow waterfall
monthlySold comps — $/sqft
last 12 mo · ≤1 miLoading sold comps…