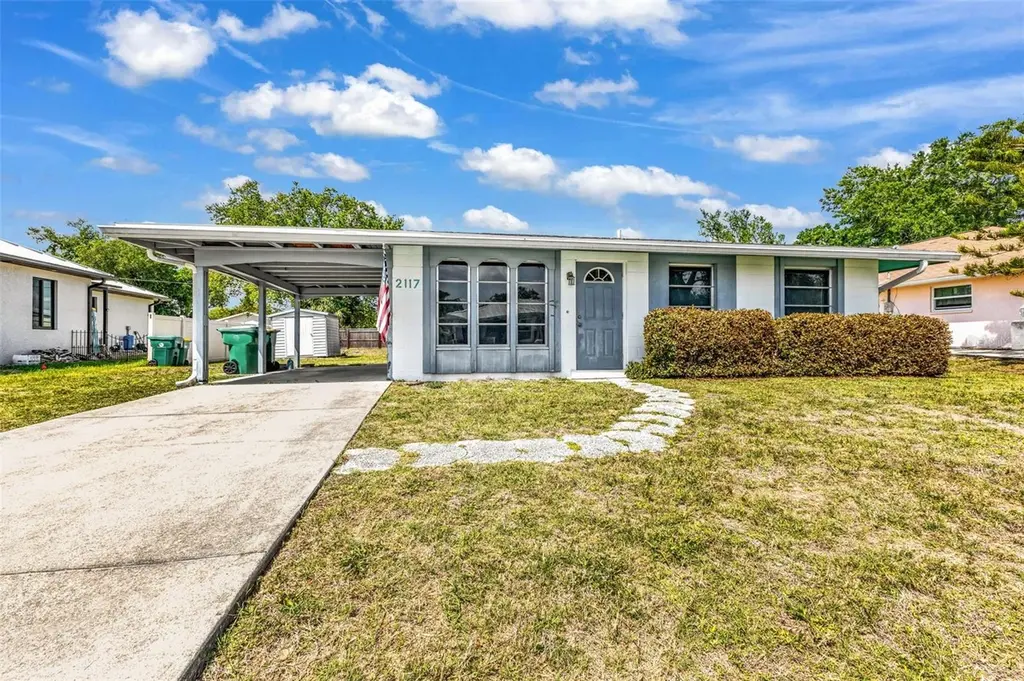
2117 Dewitt St · Port Charlotte, FL
Flood risk 6/10 · Moderate
- FEMA flood zone
- X (shaded)
- Chance of flooding over 30 yrs
- 0.58%
- Est. flood insurance / yr
- $507 – $1,088
Fire risk 1/10 · Minimal
- Est. fire insurance / yr
- $947 – $1,759
Heat risk 10/10 · Severe
- Hot days now (above 107°F)
- 7 days/yr
- Hot days in 30 yrs
- 30 days/yr
Wind risk 10/10 · Severe
- Chance of severe wind over 30 yrs
- 99.0%
Air-quality risk 3/10 · Minor
- Unhealthy air days now
- 2 days/yr
- Unhealthy air days in 30 yrs
- 2 days/yr
Risk factors via First Street. Map © Google.
Why this score? — see what drove the D grade
The composite is a weighted blend of 9 inputs, each scored 0–100. Each bar is that input's sub-score; the figure is the points it added to the 100-point composite (weight × sub-score).
- Cash flow +13.5/30.0
- ARV discount +7.7/15.0
- Schools +4.6/10.0
- DSCR +4.1/10.0
- 1% rule +3.7/10.0
- Livability +3.2/5.0
- Condition / age +2.5/5.0
- Rent growth +2.2/5.0
- Appreciation +0.0/10.0
$179,000
🖨 Deal sheet 📄 Offer letter ✓ Due diligence
Listing remarks
Under contract-accepting backup offers. Some homes need everything, this one just needs you!! This well-maintained 2-bedroom, 2-bath in Port Charlotte is the perfect opportunity to make this solid home your own. Major updates include a new roof (2023) and HVAC package unit (2023), giving you peace of mind on the big-ticket items while leaving room to add your personal touch. Inside, you’ll find a functional layout with comfortable living areas, well-sized bedrooms, and a private ensuite bathroom in the primary suite. Sliding glass doors lead to a Florida room—ideal for a cozy sitting area, home office, or hobby space. The home also features interior laundry with washer and dryer
Key facts
- Florida room
- New a c
- Ensuite bathroom
Tags
Property features AI
Exterior
- Parking: Carport (1 space)
- Utilities: Public water; Septic tank; Electricity connected; Sewer available
- Home design: Single family residence; One story; Faces east; Residential property in fixer condition
- Construction: Block and stucco construction; Shingle roof; Slab foundation; Built area approximately 1,402 square feet
- Exterior features: Private mailbox; Rain gutters; Cleared lot; Paved road access; Shed(s)
Interior
- Kitchen: Dishwasher; Range; Microwave; Refrigerator
- Bedrooms: 2 bedrooms
- Flooring: Carpet; Ceramic tile
- Bathrooms: 2 full bathrooms
- Heating & cooling: Central heating; Central air conditioning
- Interior features: Window treatments
- Laundry & utility: Washer; Dryer; Laundry inside
Neighborhood map
What this means for you Summary
Snapshot
- This is a 2-bed/1.0-bath single-family listed at $179k.
Deal economics
- At list price, monthly cash flow is $6 ($76/yr) — positive.
- The deal already cash-flows at list — no discount required.
- To meet the 1% rule (rent ≥ 1% of price), the offer needs to be $156k (12.8% below list).
- Recommended offer: $156k (12.8% below list) — sets the bar for 1% rule.
- Cap rate 6.3% vs local median 4.4% in Port Charlotte — top-decile yield for the area; either an underpriced asset or a hidden risk that comps aren't pricing in. Stress-test before assuming the spread holds.
Location & tenants
- Location reads 65/100 on livability (#655 in FL) — a middle-class / working-renter tenant base. Strengths: cost of living A+, housing A+; Watch: schools D+, employment D, amenities F.
- Charlotte (suburban): math 54% / reading 54% proficiency, ranked #22 of 73 in FL (top 30%) — acceptable for families but not a draw, mixed tenant base, ~2y average lease.
- Market conditions: Rents soft (-1.4%/yr); 707 active listings in the ZIP; 38 comparable units currently listed for rent nearby; rentals at typical pace (median 21d on market — plan ~3-4 weeks tenant-placement turnaround); 4,585 units permitted in Charlotte County in 2024 (703 in 5+ unit buildings).
- This rent runs 31% of the median local income ($61k/yr) — at the standard rent-burdened threshold; future hikes will face affordability resistance.
Forward outlook
- Local home prices are declining (-3.0%/yr); year-one equity from $1k of loan paydown is wiped out by about $5k of value loss. Plan a longer hold.
- Charlotte County population projected at +24% by 2050 — long-run rental-demand tailwind backs the buy-and-hold thesis.
Negotiation context
- It's been on market 84 days — a 6% lower offer ($168k) is reasonable based on typical stale-listing flexibility.
- 2 sale attempts with the ask held roughly flat each time — persistent listings suggest the price (not the market) is what's stuck; bring a comps-based counter.
- Current owner paid $56k; list at $179k implies a 220% gain — meaningful room to come down on a strong offer.
Risks & watch-outs
- Climate carrying-cost: major flood risk; severe wind risk, 99% chance of damaging wind over 30y; extreme-heat days projected 7→30/yr by 2055 (HVAC capex compounding) — expect insurance premiums to compound above CPI over the hold.
Questions for the listing agent
- It's been on market 84 days. Have you received any prior offers? Is the seller open to a 13% concession, seller financing, or rate buy-down credit?
- Built in 1972 — when were the roof, HVAC, electrical panel, plumbing, and water heater last replaced?
- Why hasn't it sold? Are there any deal-killer items the seller is aware of (foundation, flood, title, zoning, code violations)?
- Is there a deadline driving the sale (1031 exchange, divorce, estate, relocation)? That informs how much negotiation room exists.
- Schools are D-rated, which usually means shorter tenancies and higher turnover. Who's the typical renter profile here, and what's been the actual vacancy rate?
- The area grade is low — what's the realistic commute time and amenity access for the typical tenant pool here? Any planned neighborhood developments (good or bad) we should know about?
- What's the average days-on-market for RENTAL listings here right now (not sales)? A rising rental-DOM trend means longer vacancies and softer asking-rent achievability than the comps imply.
- What's the recent tenant-quality profile in this submarket — average credit score on applications, eviction rate, late-payment / NSF rate, and stable-employment percentage? A property-management company in the area should have these aggregated.
- How much new for-sale + rental construction is in the pipeline within 1–3 miles? Heavy new supply typically softens prices + rents 12–24 months out; constrained supply supports both.
Investment metrics
- 1% rule
- 0.87% ✗
- Cap rate
- 6.34%
- Cash-on-cash
- 0.15%
- DSCR
- 1.01
- GRM
- 9.6
CMA / ARV
- ARV (on-the-fly)
- $179,716
- Comps found
- 12
Show comp detail 12 sales within ~0.75 mi
| Address | Dist | Beds/Ba | Sqft | Sold | Price | $/sf | Match |
|---|---|---|---|---|---|---|---|
| 21403 Glendale Ave | 0.20mi | 3/1.0 (+1) | 1,009 (+0%) | 11mo | $252,500 | $250 | 76 |
| 21475 Gibralter Dr | 0.47mi | 2/1.0 | 1,017 (+1%) | 10mo | $93,000 | $91 | 68 |
| 21327 Midway Blvd | 0.08mi | 2/2.0 | 1,116 (+11%) | 8mo | $200,000 | $179 | 67 |
| 21190 Midway Blvd | 0.23mi | 2/2.0 | 1,039 (+4%) | 16mo | $219,000 | $211 | 66 |
| 21426 Meehan Ave | 0.25mi | 2/2.0 | 1,056 (+5%) | 18mo | $151,000 | $143 | 61 |
| 2271 Hariet St | 0.55mi | 2/1.0 | 988 (-2%) | 14mo | $225,000 | $228 | 60 |
| 21914 Cellini Ave | 0.49mi | 3/1.0 (+1) | 952 (-5%) | 5mo | $197,500 | $207 | 59 |
| 21139 Bersell Ave | 0.44mi | 3/1.0 (+1) | 874 (-13%) | 1mo | $150,000 | $172 | 52 |
| 22163 Lasalle Rd | 0.74mi | 2/1.0 | 938 (-7%) | 7mo | $124,000 | $132 | 49 |
| 2392 Elkcam Blvd | 0.65mi | 3/2.0 (+1) | 972 (-3%) | 18mo | $80,000 | $82 | 41 |
| 21019 Malden Ave | 0.59mi | 2/2.0 | 858 (-14%) | 8mo | $215,000 | $251 | 38 |
| 2395 Alda Ln | 0.72mi | 2/2.0 | 1,150 (+14%) | 6mo | $120,000 | $104 | 33 |
Match score weights: distance 35% · size 25% · config 20% · recency 20%. Top-matched comps best support the ARV.
Projected returns pro-forma
-3.0% appreciation · 0.0% rent growth · sell at horizon
- IRR
- -19.5%
- Equity multiple
- 0.34×
- Total profit
- $-33,158
- Equity at exit
- $26,689
- IRR
- -20.1%
- Equity multiple
- 0.08×
- Total profit
- $-45,962
- Equity at exit
- $15,477
Cash invested: $50,120 (down + closing). Projections, not guarantees.
Landlord ↔ Tenant lean methodology
- Overall (STATE)
- 87 Strongly Landlord-Friendly
- State Florida
- 87 Strongly Landlord-Friendly · R+3
- County
- — inherits STATE
- City
- — inherits STATE
ZIP-level market 33952
- Home prices YoY
- -4.8%
- Rents YoY
- -1.4%
- Active inventory
- 707
- Price-to-rent
- 9.6×
Monthly cashflow live
- Estimated rent
- $1,561 high interval (Pro) →
- Mortgage (P&I)
- −$939
- Tax from tax record
- −$214 /mo · $2,564/yr
- Insurance
- −$75
- HOA
- −$0
- Vacancy / Maint / Mgmt
- −$328
- Net cashflow
- $6
Break-even live
UW: 25.0% down · 7.5% · 30yr · 1.5% tax · 5.0% vac · 8.0% maint · 8.0% mgmt
Financing live
Cash to close
- Down payment
- $44,750
- Closing costs
- $5,370
- Reserves months
- —
- Total cash needed
- —
Loan-product check · same deal, 3 products live
Conventional
25% down · 7.5% · 30yr
- Down + closing
- —
- Monthly P&I
- —
- Monthly cashflow
- —
- DSCR
- —
- Eligible?
- —
Personal DTI + credit; lowest rate.
DSCR
20% down · 8.5% · 30yr
- Down + closing
- —
- Monthly P&I
- —
- Monthly cashflow
- —
- DSCR
- —
- Eligible?
- —
No personal income docs; deal must DSCR.
Hard money
10% down · 12.0% · 12mo
- Down + closing
- —
- Monthly P&I
- —
- Monthly cashflow
- —
- DSCR
- —
- Eligible?
- —
Short-term bridge; refi at stabilization.
Rent comps 38 comps
| Address | Beds | Baths | Sqft | Rent | $/sqft | DOM | Units | Dist |
|---|---|---|---|---|---|---|---|---|
| 21426 Glendale Ave Port Charlotte, FL | 3.0 | 1.5 | 1423 | $1,511 | $1.06 | 13d | 1 | 0.21mi |
| 1506 Dewitt St Port Charlotte, FL | 3.0 | 2.0 | 1198 | $1,800 | $1.50 | 21d | 1 | 0.26mi |
| 21499 Glendale Ave Port Charlotte, FL | 3.0 | 1.0 | 1077 | $1,600 | $1.49 | 21d | 1 | 0.34mi |
| 21155 Meehan Ave Port Charlotte, FL | 3.0 | 1.0 | 1060 | $1,300 | $1.23 | 21d | 1 | 0.35mi |
| 21385 Gibralter Dr Port Charlotte, FL | 2.0 | 2.0 | 1172 | $1,650 | $1.41 | 21d | 1 | 0.35mi |
| 2171 Birchcrest Blvd Port Charlotte, FL | 2.0 | 1.5 | 1162 | $1,500 | $1.29 | 21d | 1 | 0.40mi |
| 21322 Stillwater Ave Port Charlotte, FL | 2.0 | 1.0 | 1080 | $1,300 | $1.20 | 21d | 1 | 0.43mi |
| 21061 Midway Blvd Port Charlotte, FL | 2.0 | 1.0 | 897 | $1,600 | $1.78 | 21d | 1 | 0.50mi |
| 22070 Gatewood Ave Port Charlotte, FL | 2.0 | 1.0 | 812 | $1,350 | $1.66 | 13d | 1 | 0.54mi |
| 21026 Glendale Ave Port Charlotte, FL | 2.0 | 1.0 | 812 | $1,400 | $1.72 | 21d | 1 | 0.55mi |
| 21307 Gertrude Ave Port Charlotte, FL | 2.0 | 3.0 | 1170 | $1,650 | $1.41 | 21d | 1 | 0.56mi |
| 2300 Aaron St #114 Port Charlotte, FL | 2.0 | 2.0 | 869 | $1,250 | $1.44 | 21d | 1 | 0.71mi |
| 2395 Alda Ln Port Charlotte, FL | 2.0 | 2.0 | 1150 | $1,775 | $1.54 | 21d | 1 | 0.74mi |
| 2425 Caring Way Unit 205 Port Charlotte, FL | 2.0 | 2.0 | 900 | $1,400 | $1.56 | 21d | 1 | 0.74mi |
| 1299 Birchcrest Blvd Port Charlotte, FL | 3.0 | 2.0 | 1176 | $1,800 | $1.53 | 21d | 1 | 0.76mi |
| 2456 Elkcam Blvd Port Charlotte, FL | 2.0 | 2.0 | 1015 | $1,700 | $1.67 | 21d | 1 | 0.76mi |
| 22203 Lasalle Rd Port Charlotte, FL | 2.0 | 1.0 | 874 | $1,325 | $1.52 | 21d | 1 | 0.78mi |
| 22086 Beverly Ave Port Charlotte, FL | 2.0 | 1.0 | 1031 | $1,250 | $1.21 | 21d | 1 | 0.80mi |
| 22017 Beverly Ave Port Charlotte, FL | 3.0 | 2.0 | 1472 | $1,600 | $1.09 | 13d | 1 | 0.86mi |
| 3006 Caring Way Port Charlotte, FL | 1.0–2.0 | 1.0–2.0 | 708 | $2,500 | $3.53 | 21d | 3 | 0.89mi |
| 3006 Caring Way Port Charlotte, FL | 2.0 | 2.0 | 783 | $2,050 | $2.62 | 13d | 2 | 0.89mi |
| 21422 Kenyon Ave Port Charlotte, FL | 2.0 | 2.0 | 1149 | $1,400 | $1.22 | 21d | 1 | 0.89mi |
| 21405 Olean Blvd Port Charlotte, FL | 1.0–2.0 | 1.0–2.0 | 708 | $1,445 | $2.04 | 21d | 2 | 0.89mi |
| 2472 Picnic St Port Charlotte, FL | 2.0 | 2.0 | 990 | $1,575 | $1.59 | 21d | 1 | 0.91mi |
| 1293 Dorchester St Port Charlotte, FL | 2.0 | 2.0 | 1250 | $1,800 | $1.44 | 13d | 1 | 0.94mi |
| 21440 Mallory Ave Port Charlotte, FL | 2.0 | 1.0 | 930 | $1,550 | $1.67 | 21d | 1 | 0.94mi |
| 2377 Starlite Ln Port Charlotte, FL | 3.0 | 1.5 | 1253 | $1,575 | $1.26 | 21d | 1 | 0.96mi |
| 3100 Harbor Blvd Port Charlotte, FL | 2.0 | 1.0–1.5 | 994 | $1,472 | $1.48 | 21d | 2 | 1.01mi |
| 3126 Harbor Blvd Unit 3A Port Charlotte, FL | 2.0 | 2.0 | 1100 | $1,500 | $1.36 | 13d | 1 | 1.05mi |
| 3108 Whiting Ln Port Charlotte, FL | 2.0 | 1.0 | 828 | $1,350 | $1.63 | 21d | 1 | 1.08mi |
| 22153 Olean Blvd Port Charlotte, FL | 2.0 | 2.0 | 1337 | $1,425 | $1.07 | 21d | 1 | 1.09mi |
| 1636 Hayworth Rd Port Charlotte, FL | 2.0 | 2.0 | 884 | $1,300 | $1.47 | 21d | 1 | 1.13mi |
| 20362 Emerald Ave Port Charlotte, FL | 2.0 | 2.0 | 1220 | $1,750 | $1.43 | 21d | 1 | 1.14mi |
| 164 Tradewinds Dr NW Port Charlotte, FL | 2.0 | 1.0 | 750 | $1,350 | $1.80 | 21d | 1 | 1.21mi |
| 3281 Easy St Port Charlotte, FL | 3.0 | 2.0 | 1196 | $1,750 | $1.46 | 13d | 1 | 1.30mi |
| 394 Ferris Dr NW Port Charlotte, FL | 3.0 | 2.0 | 842 | $1,395 | $1.66 | 21d | 1 | 1.38mi |
| 2451 Aquilos Ct Port Charlotte, FL | 2.0 | 2.0 | 1307 | $2,000 | $1.53 | 13d | 1 | 1.45mi |
| 322 Lasayette Dr NE Port Charlotte, FL | 2.0 | 1.5 | 1140 | $1,475 | $1.29 | 21d | 1 | 1.45mi |
Listing history 22 events
-
2026-06-17status $179,000 Pending 84 DOM
-
2026-06-17days on market $179,000 Active 84 DOM
-
2026-06-16days on market $179,000 Active 83 DOM
-
2026-06-15days on market $179,000 Active 82 DOM
-
2026-06-14days on market $179,000 Active 80 DOM
-
2026-06-13days on market $179,000 Active 79 DOM
-
2026-06-10days on market $179,000 Active 77 DOM
-
2026-06-09days on market $179,000 Active 76 DOM
-
2026-06-08days on market $179,000 Active 75 DOM
-
2026-06-07days on market $179,000 Active 74 DOM
-
2026-06-05days on market $179,000 Active 71 DOM
-
2026-06-03days on market $179,000 Active 70 DOM
-
2026-06-02days on market $179,000 Active 69 DOM
-
2026-06-01days on market $179,000 Active 68 DOM
-
2026-05-31days on market $179,000 Active 67 DOM
-
2026-05-30days on market $179,000 Active 66 DOM
-
2026-05-12status Active
-
2026-05-06status Pending
-
2026-04-17price $179,000
-
2026-03-20$185,000 Active
-
1992-02-01soldstatus $56,000
-
1990-12-01soldstatus $45,000
ⓘ Source: listings_history table (triggers on properties + properties_extension) + one-shot
backfill from property_details.listing_events for pre-trigger history.
Tax reassessment forecast FL · Resets to sale price
- Current annual tax
- $2,564 · $214/mo
- Projected year-2 tax
- $2,564 · $214/mo
- Expected delta
- $0/yr ($0/mo · 0.0%)
ⓘ Screening estimate from a state-policy table — verify with the county assessor before closing.
Climate risk First Street
- Flood 6/10 Major FEMA zone X (shaded) · 58% chance over 30 yrs
- Wildfire 1/10 Low
- Heat 10/10 Extreme 7 d/yr ≥107°F today · 30 d/yr by 30 yrs out
- Wind 10/10 Extreme 99% chance of damaging wind over 30 yrs
- Air quality 3/10 Moderate 2 unhealthy d/yr today · 2 by 30 yrs out
Nearby sold comps map
Loading sold comps map…
Walkable amenities ~0.75 mi
Loading nearby amenities…
Taxation est. · year 1
- Rental income
- $18,734
- − Mortgage interest
- −$10,027
- − Property taxes
- −$2,564
- − Insurance
- −$895
- − Repairs & maintenance
- −$1,499
- − Management
- −$1,499
- − Depreciation
- −$5,207
- Taxable loss
- −$2,957
- Est. tax savings @ 24.0%
- +$710
- After-tax cash flow
- $786/yr
For passive investors: Depreciation is non-cash, so a rental often shows a tax loss while cash-flowing — sheltering income. Rental losses are passive: they offset passive income freely, and up to $25,000/yr can offset ordinary (W-2) income if you actively participate and your MAGI is under $100k (phasing out to $0 by $150k); unused losses carry forward. On sale, claimed depreciation is recaptured at up to 25%, and gains may owe capital-gains tax (a 1031 exchange can defer both). Figures are a year-1 estimate at your 24.0% rate — not tax advice; consult a CPA.
Schools (NCES district)
- District
- Charlotte
- NCES district ID
- 1200240
- Math proficiency
- 54% ▼ -6.00%
- Reading proficiency
- 54% ▼ -1.00%
- Median HH income
- $44,864
- Composite
- 45.62/100
- National rank
- #2586
- State rank
- #22 of 73 in FL
Livability — Port Charlotte
- Score
- 65/100
- State rank
- #655
- US rank
- #13081
Category grades
Schools grade is shown separately in the Schools card above.
Census & demographics
- Census place
- Port Charlotte, FL
- County
- Charlotte County · 196,994 people
- City population
- 102,180
- Metro
- Punta Gorda, FL
- Population (ZIP)
- 35,231
- Household income
- $61,382
- Rent vs Own
- Severe rent burden
- 733.0
Population outlook (Charlotte County) Hauer SSP2
- Today (2025)
- 198,646 people
- By 2030
- 210,507 · +6.0%
- By 2040
- 230,857 · +16.2%
- By 2050
- 247,148 · +24.4%
- By 2075
- 281,777 · +41.8%
- By 2100
- 293,609 · +47.8%
Race, ethnicity, and origin ACS 2023
- Neighborhood character
- Predominantly White (76%)
- Race & ethnicity
- White 76% Hispanic / Latino 14% Two or more races 8% Black 6% Asian 2%
- Hispanic origin (detail)
- Mexican 2% Puerto Rican 3% Cuban 2%
- Common ancestry
- Lithuanian 2% Romanian 2% Italian 2%
- Foreign-born
- 12% · Canada, Vietnam
- Languages at home
- 85% English-only · Spanish 10% French/Haitian/Cajun 1% Russian/Polish/Slavic 1%
Political lean MEDSL · Charlotte
- 2024 margin
- Solid R (+34.0) · D 32.7% · R 66.7%
- 2008→2024 swing
- -26.7pp toward R · 2008: -7.2pp · 2024: -34.0pp
- All cycles
- 2024: R+34.0 2020: R+26.6 2016: R+27.8 2012: R+14.3 2008: R+7.2
Not yet ingested
- Civics
- —
Market trends
- HPI YoY
- ▼ -17.18%
- Current HPI
- 339.0932
- Rent YoY
- ▼ -1.35%
- Metro
- Punta Gorda, FL
- State GDP YoY
- ▲ 3.28%
- F500 in state
- 36
Industry mix (Fortune 500 HQ in FL)
| Industry | F500 HQs | Revenue |
|---|---|---|
| Industrial Technology | 2 | $29B |
|
||
| Insurance | 2 | $17B |
|
||
| Retail | 1 | $60B |
|
||
| Technology Distribution | 1 | $58B |
|
||
| Homebuilding | 1 | $35B |
|
||
| Technology Manufacturing | 1 | $35B |
|
||
Price history
+297.8% since first listed6 events — show timeline
- 2026-05-12 Relisted — Stellar MLS as Distributed by MLS Grid
- 2026-05-06 Pending — Stellar MLS as Distributed by MLS Grid
- 2026-04-17 Price Changed $179,000 Stellar MLS as Distributed by MLS Grid
- 2026-03-20 Listed $185,000 Stellar MLS as Distributed by MLS Grid
- 1992-02-01 Sold (Public Records) $56,000 Public Records
- 1990-12-01 Sold (Public Records) $45,000 Public Records
Property tax history
+13.2%/yrLatest (2025): $2,564 · -5.2% YoY. Source: county tax records.
Cash-flow waterfall
monthlySold comps — $/sqft
last 12 mo · ≤1 miLoading sold comps…